Boonton 55 Series User manual

55 Series Wideband USB Sensor
Page 1of 28
Quick Start Guide
Version 2.0
Revision date 9/22/2014
©Copyright in 2013-2014, by BOONTON Electronics,
a subsidiary of the Wireless Telecom Group, Inc.
Parsippany, NJ, USA. All rights reserved.

55 Series Wideband USB Sensor
Page 2of 28
Table of Contents
1 Introduction .......................................................................................................................................... 3
2 Key Features.......................................................................................................................................... 3
3 Technical Specifications of Boonton 55 Series Wideband USB Sensor................................................. 4
4 Safety Summary .................................................................................................................................... 5
5 Getting Started...................................................................................................................................... 5
6 Installing Boonton Power Analyzer Suite Software .............................................................................. 6
7 Connecting Sensors to the PC ............................................................................................................... 9
8 Connect USB Sensor Head to RF Source ............................................................................................... 9
9 RF Power Measurements.................................................................................................................... 10
10 Using Boonton Power Analyzer Suite Software.............................................................................. 10
11 Remote Programming..................................................................................................................... 22
12 Software Upgrade ...........................................................................................................................23
13 Firmware Upgrade ..........................................................................................................................23
14 Maintenance ...................................................................................................................................23
15 Troubleshooting.............................................................................................................................. 24
16 Repair Policy.................................................................................................................................... 27
17 Contact and Support ....................................................................................................................... 28

55 Series Wideband USB Sensor
Page 3of 28
1Introduction
The 55 series wideband USB power sensors are the latest series of products from Boonton Electronics that turn
your PC or laptop using a standard USB 2.0 port into a state of the art power meter without the need for any other
instrument. RF power measurements from the USB sensor can be displayed on your computer or can be integrated
into a test system with a set of user-defined software functions. This guide will take you through the software
installation process and then outline some typical hardware configurations to enable you to get the most out of
your software and power sensor. The RF power measurement and related applications are the part of Boonton
Power Meter products and is available free of charge from Boonton official website under "Resource Library".
This manual includes the following sections:
Key features
Technical Specifications
Installing Software
Connecting Sensor to the PC
Using the software
Getting more from your system
2Key Features
The key features of Boonton 55 series USB power sensors are:
Real-Time Power Processing™: No latency due to buffer processing by host PC
Highly accurate and reliable RF power measurements, equally suitable for product development, compliance
testing, and site monitoring applications.
Perfect for most RF power measurement needs, including:
- Trigger stability
- Waveform fidelity
- Installation and maintenance
- Manufacturing test
- ATE
- Research and Development
Easy to use software
Quick configuration
Very flexible set-up and system integration
Small, compact and rugged
Multiple sensor support on a single PC.
No calibration required
Low cost alternative to traditional power meters
55 Series Wideband USB Sensor
Page 4of 28
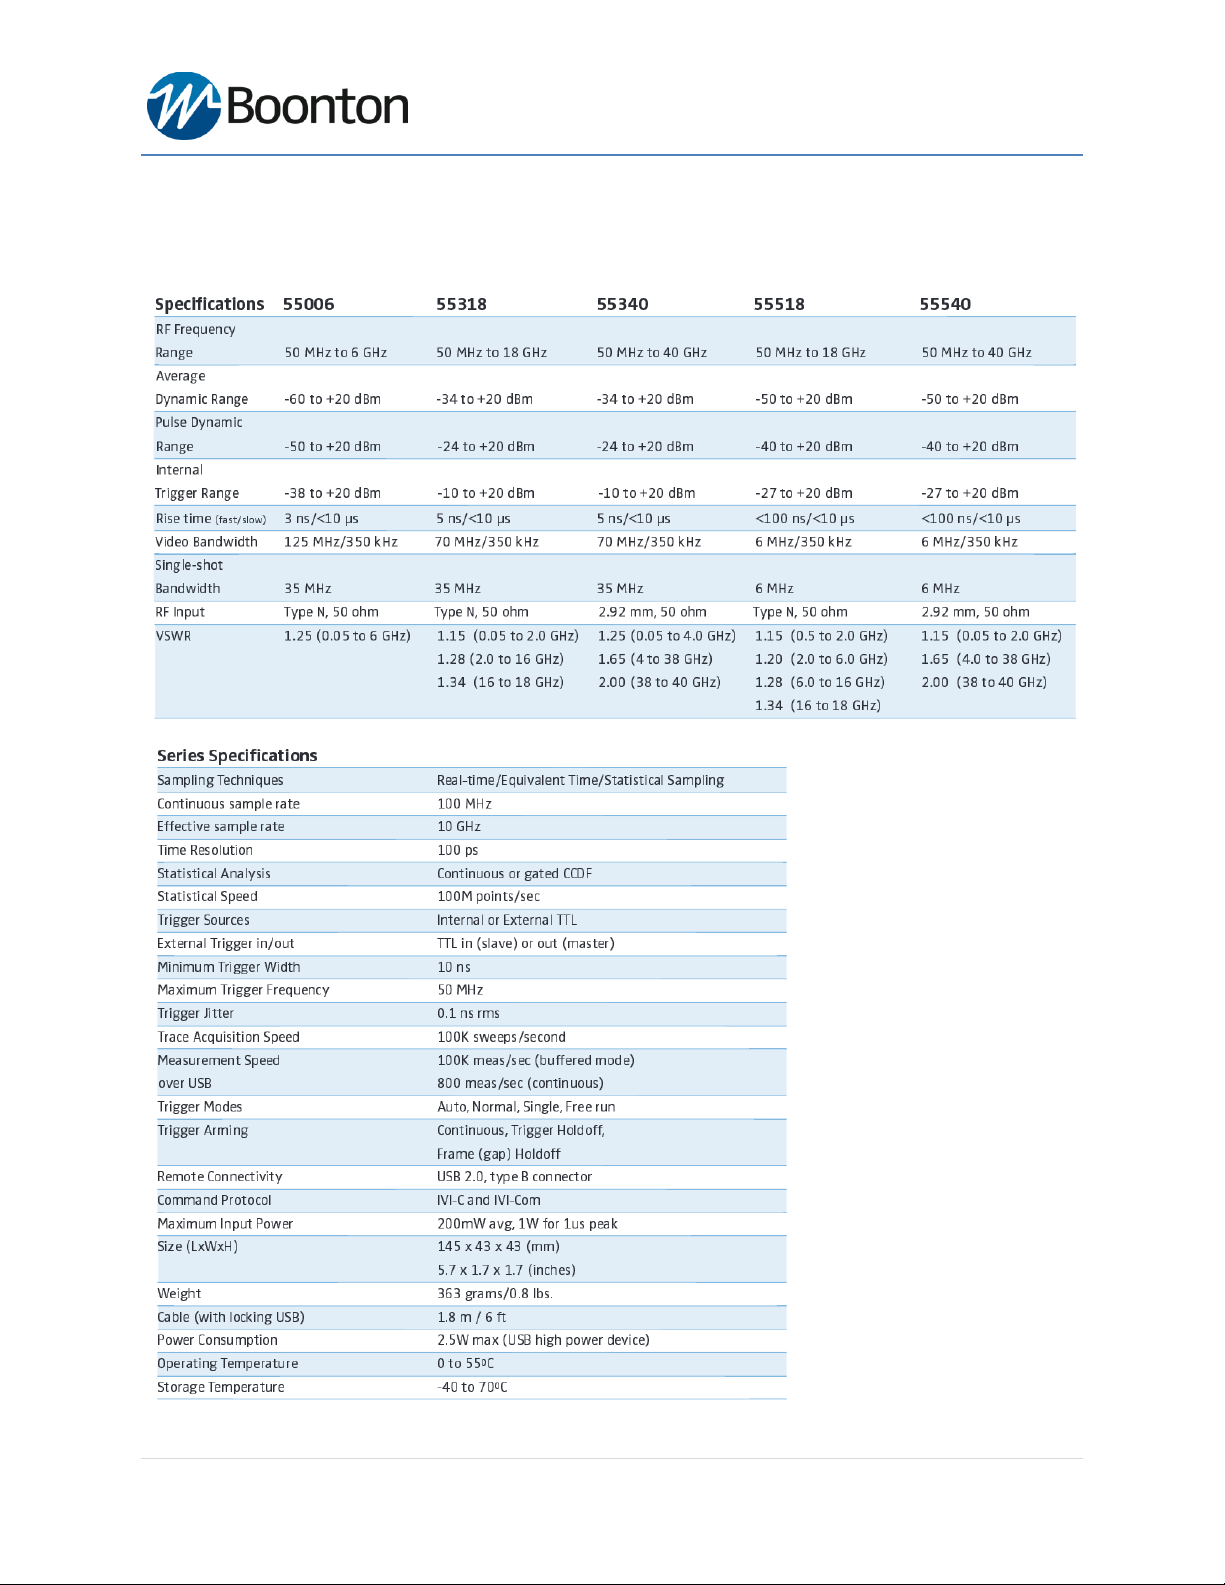
3Technical Specifications of Boonton 55 Series Wideband USB Sensor

55 Series Wideband USB Sensor
Page 5of 28
4Safety Summary
The following general safety precautions must be observed during all phases of operation and maintenance of the
Boonton 55 Series Wideband USB Power Sensor. Failure to comply with these precautions or with specific
warnings elsewhere in this manual violates safety standards of design, manufacture, and intended use of the
instruments. Boonton Electronics Corporation assumes no liability for the customer’s failure to comply with these
requirements.
DO NOT OPERATE THE INSTRUMENT IN AN EXPLOSIVE ATMOSPHERE
Do not operate the instrument in the presence of flammable gases or fumes.
KEEP AWAY FROM LIVE CIRCUITS
Operating personnel must not remove USB device covers. Component replacement and internal
adjustments must be made by Boonton service and maintenance personnel only. Never replace
components or operate the device with the covers removed and the USB cable connected.
DO NOT SUBSTITUTE PARTS OR MODIFY INSTRUMENT
Do not substitute parts or perform any unauthorized modification of the USB device. Return the
instrument to Boonton Electronics for repair to insure that the warranty and safety features are
maintained
5Getting Started
Before you start, make sure you have the following items in your 55 series USB Power Sensor package:
•Boonton 55 Series Wideband USB Power Sensor
•USB Type-A Cable (6 ft)
•External Trigger Multi-I/O Cable (SMB to BNC)
•Trigger Sync Cable (SMB to SMB) for triggering multiple sensors
•Boonton Power Analyzer Suite Software (on a CD-ROM or from Boonton website)
•Quick Start Guide (on a CD-ROM or from Boonton website)
If any of these items are missing or damaged, then please contact your local representative immediately and refer
to “Contact and Support”section of this guide.
Minimum PC requirements:
Your minimum recommended PC specifications are:
Windows XP SP3 and above
512 MB RAM
1 GHz Processor
USB Port (2.0 or greater)
NOTE: USB 2.0 port is recommended on Windows XP and Windows 7 due to lack of built-in support for USB3.0.
USB 3.0 port is only recommended on Windows 8.x systems
55 Series Wideband USB Sensor
Page 6of 28
6Installing Boonton Power Analyzer Suite Software
This section describes the installation and use of Boonton Power Analyzer Suite software for 55 series wideband
USB sensors. Before you start, check your PC for software compatibility.
Caution: Do not connect the power sensor to your PC until you have installed the Boonton Power Analyzer
software.
Procedure:
To install the Boonton Power Analyzer Suite software, follow these steps:
(1) Install Boonton Power Analyzer Suite by selecting . The installation package can be
downloaded from "Manual & Software" section of the product page on Boonton website:
http://boonton.com/products/sensors/55-series-wideband-usb-power-sensor?go=manuals_software
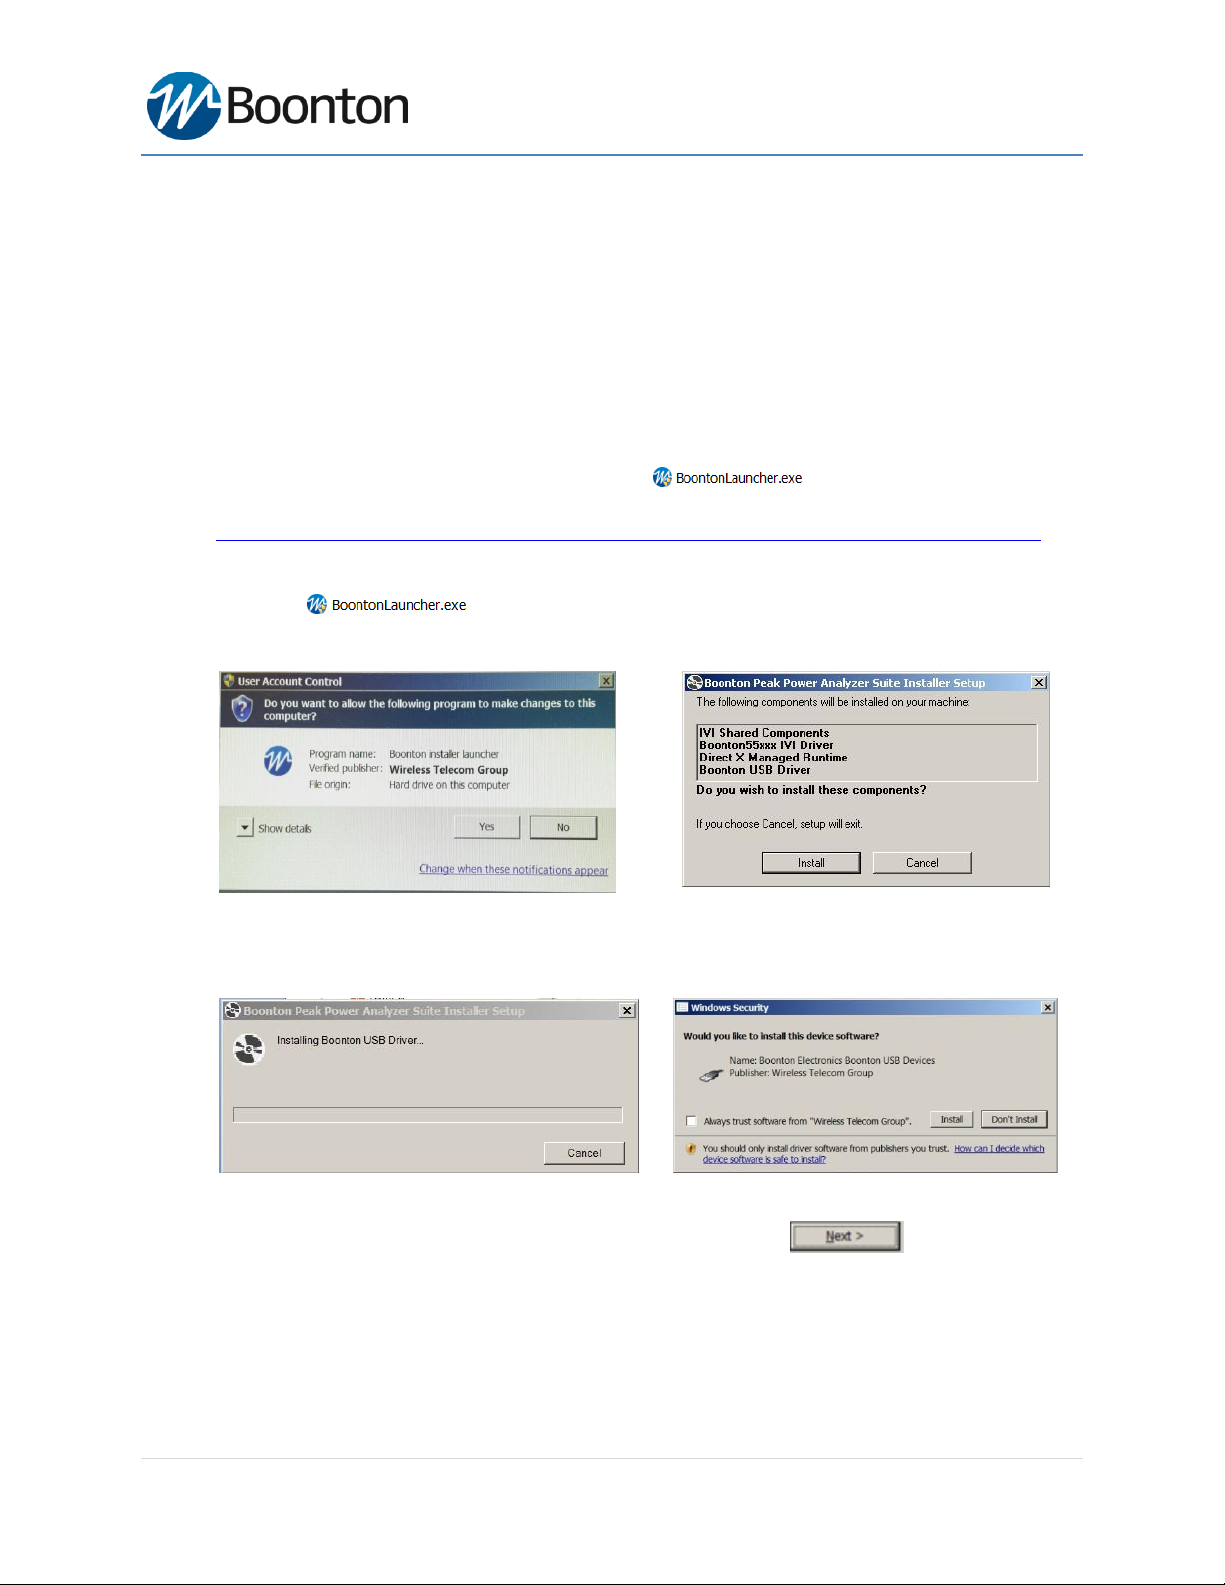
(2) The Installation process is initiated by running “BoontonLauncher.exe” with admin permissions. When you
select the for the first time, select "Yes" and then click on "Install" in order to
proceed with the installation process.
(3) Initially Boonton USB driver file will be installed. You might receive a windows security warning message
as below. The USB driver file will be installed once you select the checkbox to accept the windows
security.
(4) Next IVI Shared Components installation wizard will appear as a part of the installation process. This will
allow to install necessary API files for remote communications. Select to continue the
installation process.

55 Series Wideband USB Sensor
Page 7of 28
(5) Once IVI Shared Components installation is completed, then Microsoft DirectX setup wizard will appear
and will guide you through the installation process.
(6) Now Boonton Peak Analyzer Suite software installation wizard will appear. Select "Run" in order to
continue with the installation process.
(7) Read the license agreement, accept it and then follow the instruction by clicking several
buttons.

55 Series Wideband USB Sensor
Page 8of 28
(8) By default software will be installed at C:\Program Files (x86)\Boonton\Peak Power Analyzer Suite\ .
(9) Start the installation process by following windows wizard instructions, accepting license agreement and
click several buttons. This will install all necessary driver files and required DLL files.
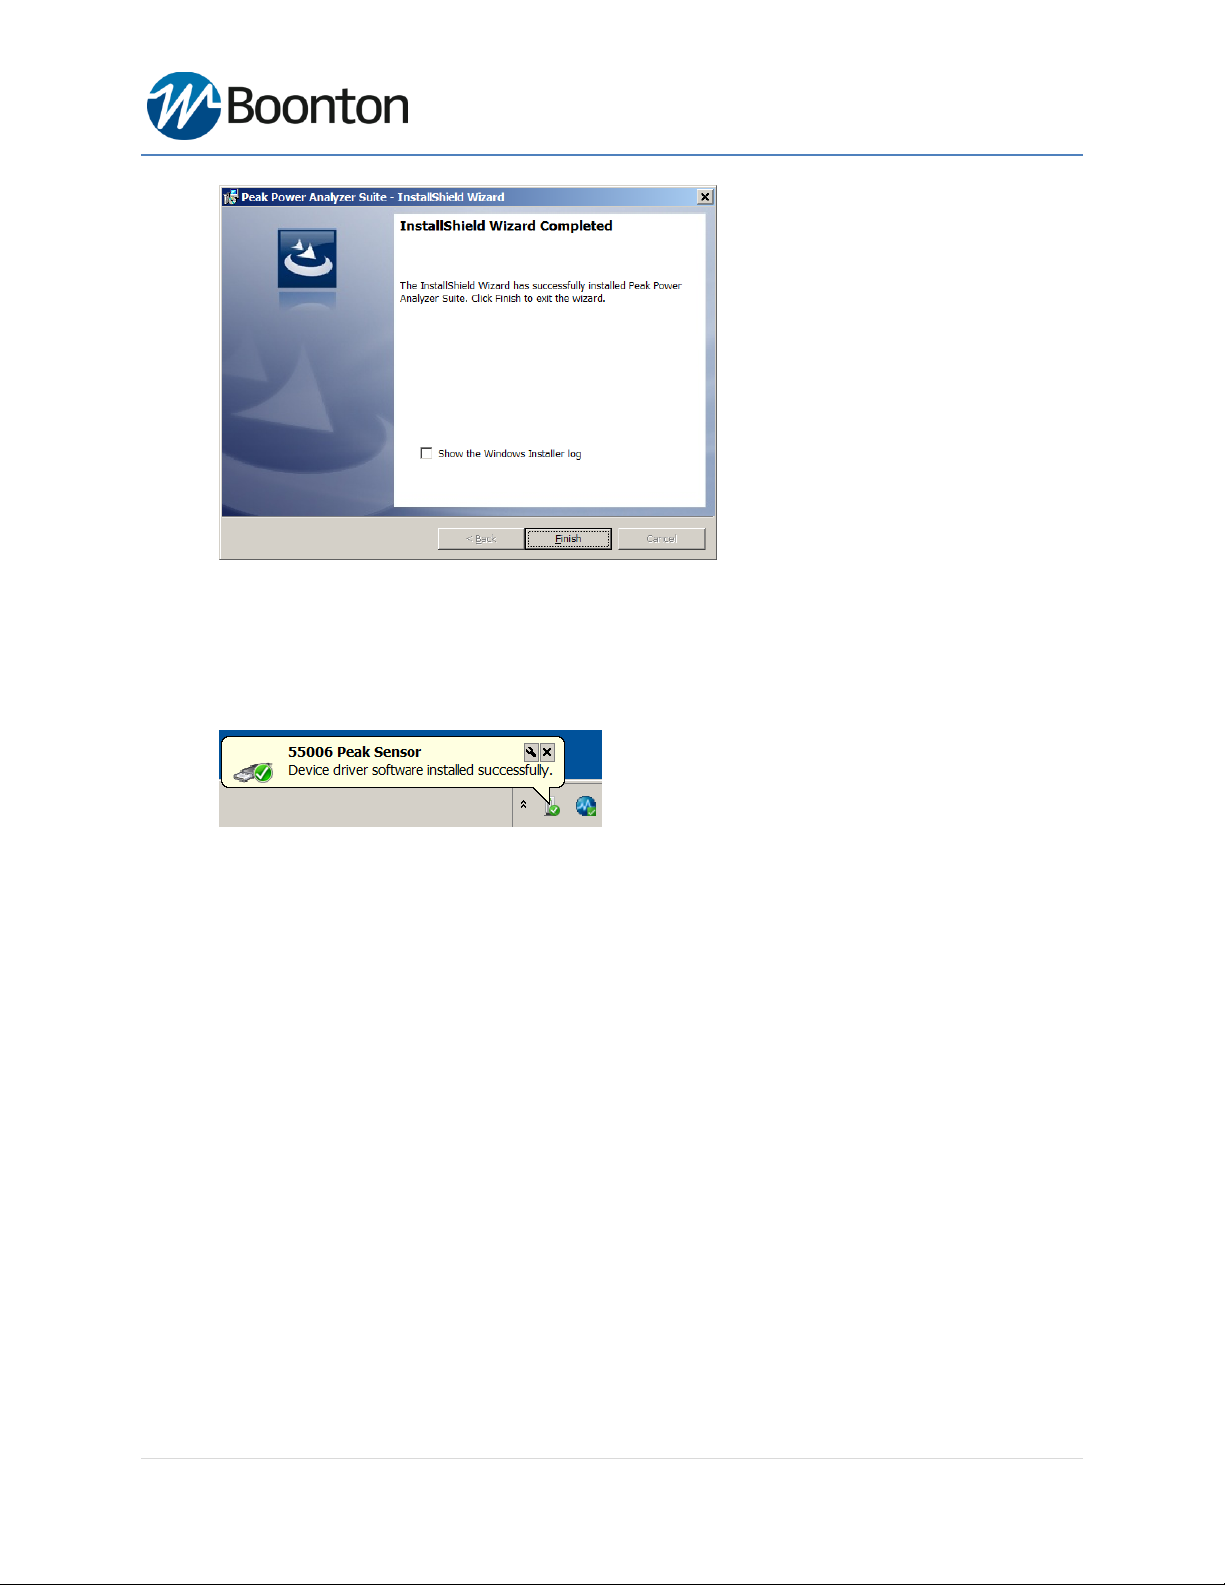
(10) During installation, you will notice the software installation progress as below:
(11) Once the installation is done successfully, Click button to exit the wizard. Now, the
Boonton Peak Power Analyzer software will open automatically.
55 Series Wideband USB Sensor
Page 9of 28
(12) Now a sensor device can be connected to the USB port of the PC. Refer to the section "Connecting USB
sensor to the PC" on next pages.
(13) When the sensor device is connected to the USB port, there will be a one-time driver file installation. Wait
until you see an automatic device detection message and Windows OS installs the driver file.
7Connecting Sensors to the PC
Connect the Boonton 55 series USB sensor to your PC through the supplied USB cable. The power sensor is USB 2.0
compatible. It is recommended that you use the USB cable supplied with your sensor.
8Connect USB Sensor Head to RF Source
All 55 series USB power sensor has a standard N-type connection port. Connect the sensor head to a RF source.
Caution: Do not turn the body of the sensor when connecting the sensor to a unit under test (UUT). To avoid
internal sensor damage, connect and disconnect the sensor by turning the metal nut only.
Caution: Ensure that you do not apply any excessive force on the sensor once it has been connected.
Caution: Do not exceed +20 dBm of RF power at the RF input of the sensor.
55 Series Wideband USB Sensor
Page 10 of 28
9RF Power Measurements
The RF Power measurements and related applications are the part of Boonton Power Meter products
and is available free of charge from Boonton official website under resource library. All Boonton power
meter instruction manuals cover the details of RF power measurement techniques. Visit following links
to find more application notes, article, webinars and white papers related to RF Power measurements
and techniques:
Principle of RF Power Measurements: http://www.boonton.com/resource-library/power-measurement-
reference-guide
Application Notes: http://www.boonton.com/resource-library?brand=Boonton&go=application_notes
Whitepapers: http://www.boonton.com/resource-library?brand=Boonton&go=white_papers
Articles: http://www.boonton.com/resource-library?brand=Boonton&go=articles
Webinars: http://www.boonton.com/resource-library?brand=Boonton&go=webinars
10 Using Boonton Power Analyzer Suite Software
Once you have installed the software, configured your USB drivers and connected the sensor to the PC, you are
ready to make measurements using the Boonton Power Analyzer Suite software.
NOTE: 55 Series USB driver file is provided by Boonton Electronics and digitally signed by Microsoft Corporation.
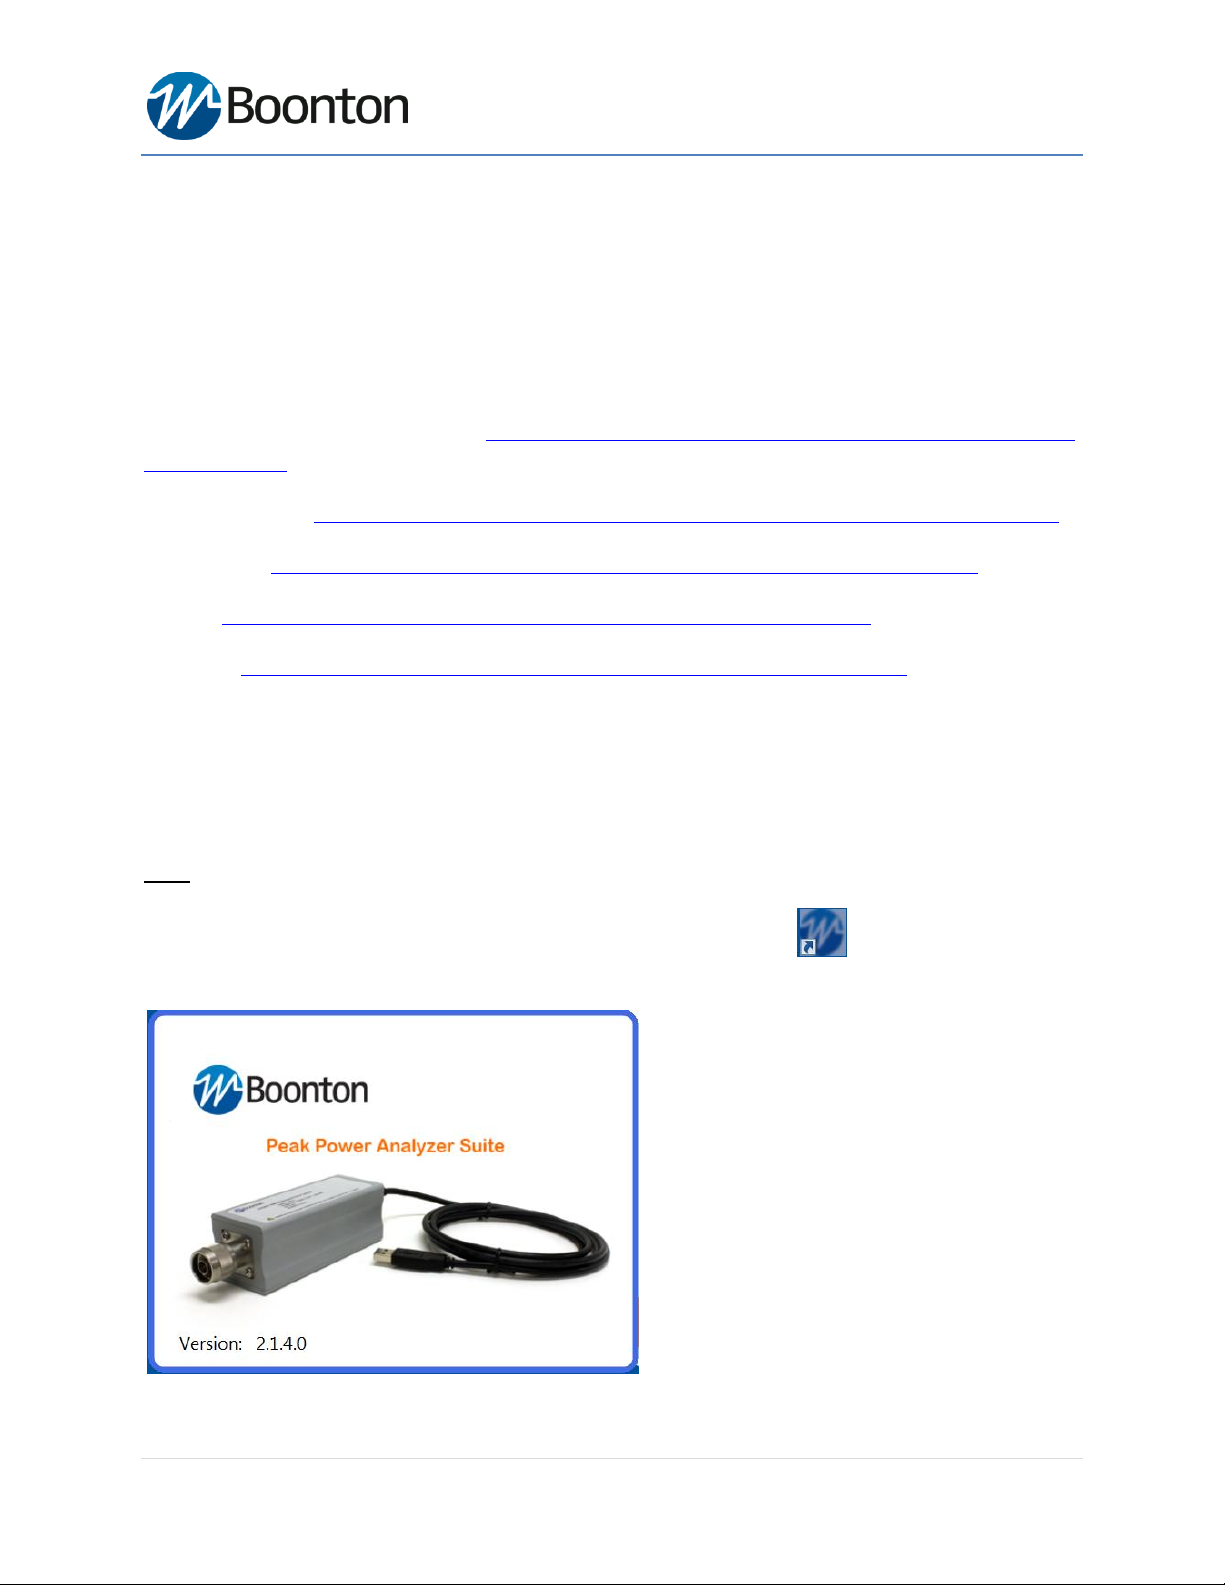
(1) Open Boonton Power Analyzer Suite by double clicking on the desktop icon . Below is an example splash
screen once the application starts.

55 Series Wideband USB Sensor
Page 11 of 28
(2) Under "Available Resources", a pop up box will appear as below with the list of connected devices name and
hardware information. The initial view of the Boonton Peak Power Analyzer software will look like as below:
(3) Check the “Select” box, select the tab "New Virtual Pwr Analyzer" at the bottom, a new Virtual Power Analyzer
window will show up. If you have a RF signal connected already to the USB sensor, the measured signal should
display on the window.
Docking Windows:
Boonton Power Analyzer Suite uses dockable windows to allow the user to arrange the various windows in the
configuration of their choice. You can drag a docked window by clicking its title bar. This action enables you to
move the window to a different docked position or undock it. To know more about dragging a floating window to a
new position, refer to this link for Docking a Window and also visit at How to: Arrange and Dock Windows .
To dock tool windows
oClick the tool window you want to dock.
oDrag the window toward the middle of the software main window.
- A guide diamond will appear with four arrows point toward the four sides of the main window.
oWhen the tool window you are dragging reaches the location where you want to dock it, move the pointer
over the corresponding portion of the guide diamond. The designated area is shaded blue.
oTo dock the window in the position indicated, release the mouse button. Note that docked windows can be
overlapped. By selecting individual tab it is possible to resize each tool windows and can be repositioned as
below picture.
- Alternatively, you can dock a tool window to a portion of one of the side walls of the software by dragging
it to the side until you see a secondary guide diamond. Click one of the four arrows to dock the tool
window to that portion of the side wall.

55 Series Wideband USB Sensor
Page 12 of 28
The following diagram shows the guide diamonds with arrows that appear when you drag a tool window toward
the center of the Boonton software main window. The diamond on the right edge only appears when you drag a
tool window toward the edge of the software.
Note: Each tool windows are highlighted as rectangular box to be positioned by dragging toward each individual
direction of the main window. Below picture is just an example, but you can always rearrange these tool windows
as you prefer to see them within your main software window.
Figure : Docking and undocking sidebars on several directions of the main window (recommended setup).
Main Application:
The main application window is divided into several major sections and dockable windows depending on the type
of measurement selection. These windows can be arranged easily by docking and undocking within the main
application display area.
Available Resources:
Sensors can be selected under "Available Resources". The status message will show the hardware
version , model and channel information including alias. User can select up to 8 resources per Virtual
Power Analyzer. Once any sensor model is selected and then clicked on "New Virtual Pwr Analyzer" tab,
a new measurement windows will show up by default with a pulse measurement.

55 Series Wideband USB Sensor
Page 13 of 28
The Main Toolbar:
The software provides a main toolbar that is located at the top of the main program window and hosts
shortcuts to commonly used functions and measurements.
Making Pulse Measurement:
In order to display a pulse measurement user need to select icon from the main toolbar. The
trace button tries to adjust level scaling, trigger level and timing according to the applied signal. All other
parameters are set back to defaults. If the auto set process fails, all settings are left untouched.
The settings and settings related to pulse measurement can be selected from
main toolbar and can be applied to the measurement.

55 Series Wideband USB Sensor
Page 14 of 28
The suggested measurement window setup for a pulse measurements by selecting sensor models are
listed below as an example. Following screenshot is provided as a recommended default setup.
Figure : Main application window of Boonton Power Analyzer Suite for pulse signal measurement.
Boonton Power Analyzer software allows to use custom entry fields for most numeric data under both Channel
Control View and Time/Trigger View. These entry fields are closely related to regular text entry boxes that allow
the user to enter any number.
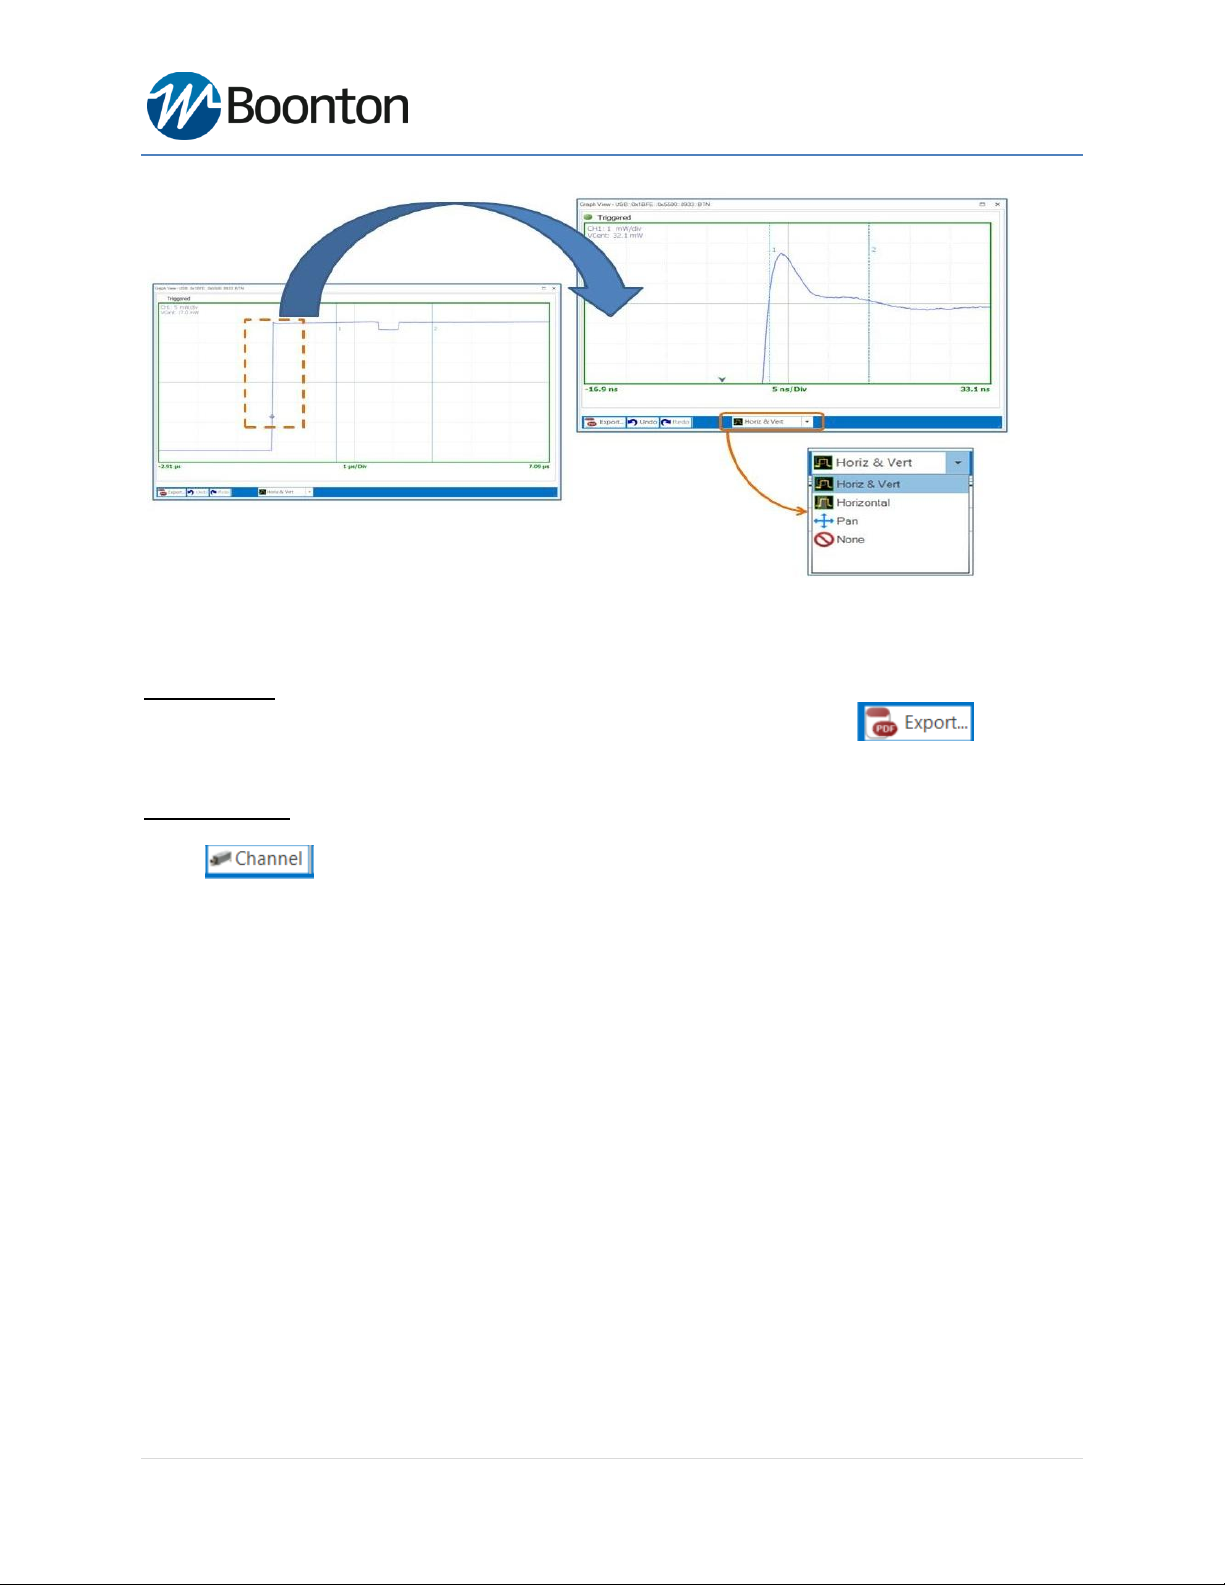
Zoom into a special area:
The software has an additional feature which allows a user to drag a rectangular box in order to zoom onto a
special area of the displayed waveform. The highlighted dragged rectangular area indicates the minimum area that
will be shown when the zoom operation completes. The zoom area is constrained to the preset timebase settings
and trigger vernier limits.
55 Series Wideband USB Sensor
Page 15 of 28
User can also perform zoom feature in details be selecting four options from the lower toolbar of the trace
window. Available options for zoom are: Horizontal & Vertical, Horizontal, Pan and None with Undo and Redo
selections.
Export as PDF:
Any trace window can be exported, printed and saved as a PDF document by selecting button from
the lower toolbar of the trace window. Exported trace file can be used for any report file or documentation.
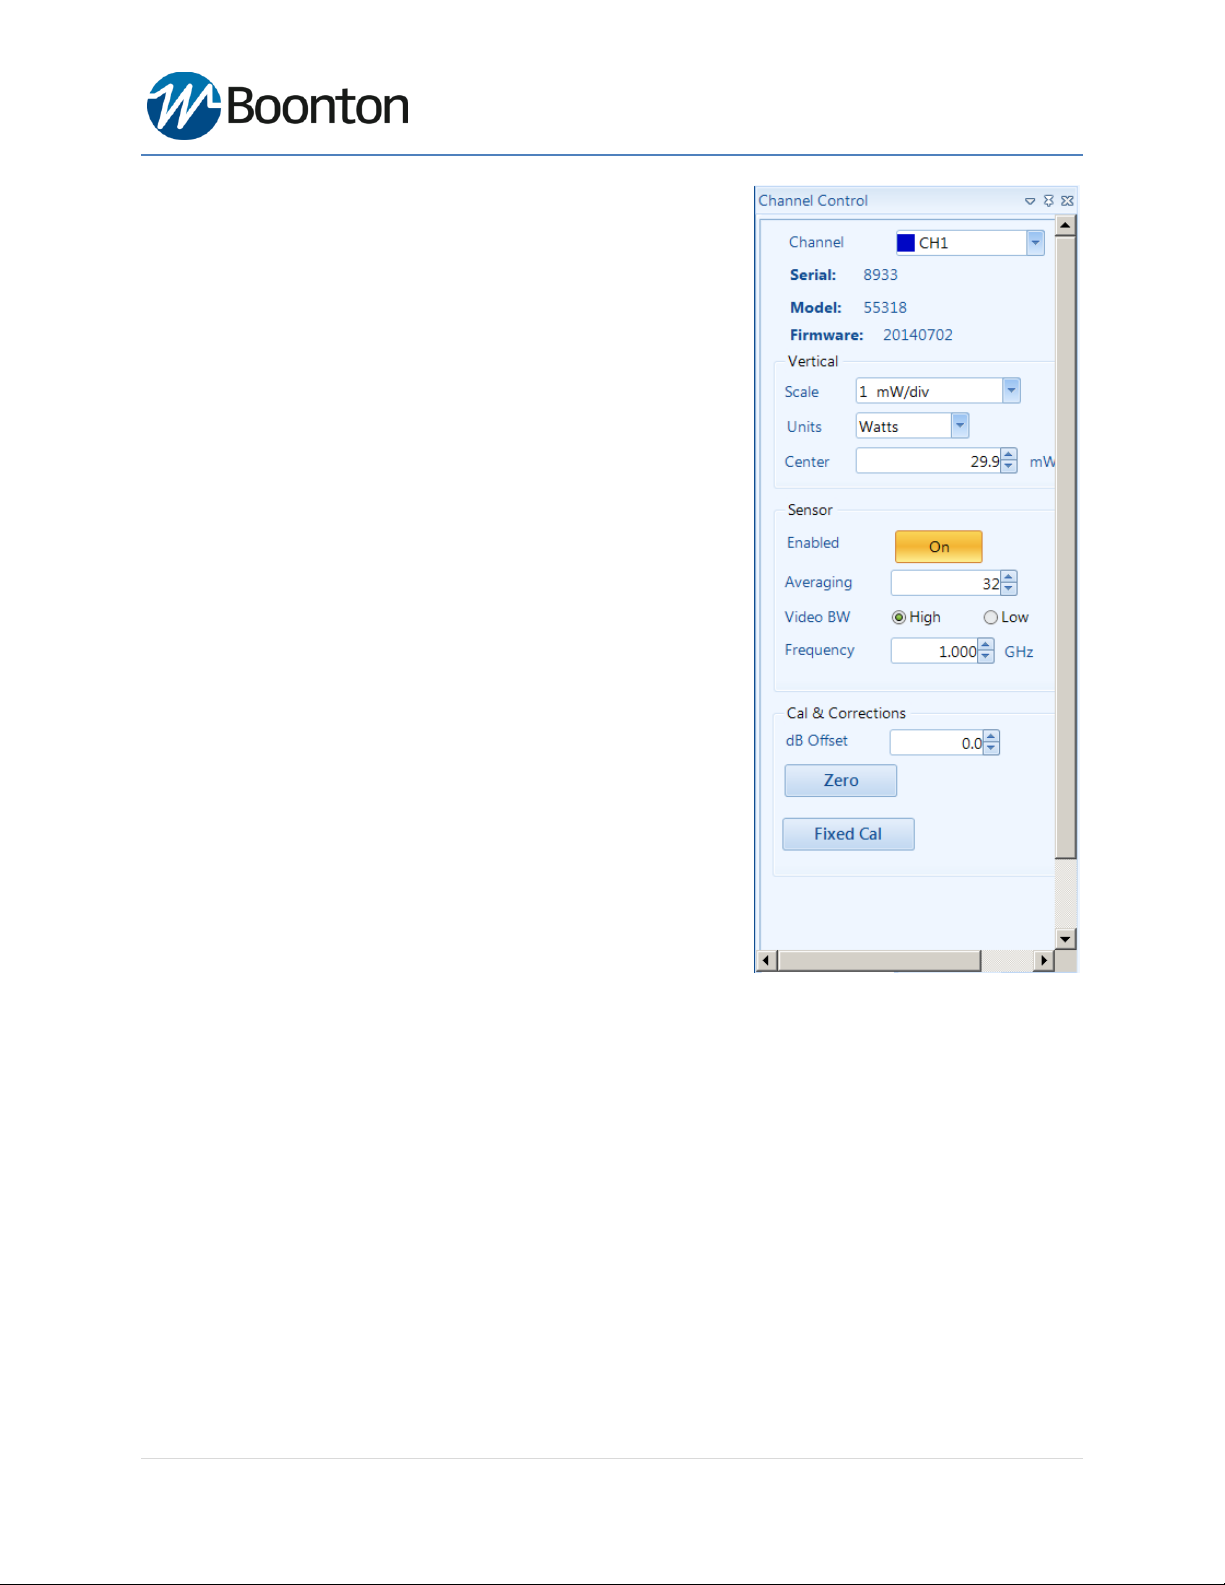
Channel Control:
Select icon and a sidebar will appear on the right hand side of the software by default. This
allows you to change all related settings to control sensor channels. The Peak Power Analyzer software
has the capability of handing multiple control channels by selecting each individual from the drop down
list. Channel control setting is defined by several parameters as listed below:
55 Series Wideband USB Sensor
Page 16 of 28
Channel: You can select an individual or all channels (for
multi-channels) by using drop down list. Sensor model with
serial number and firmware version displayed under this
channel parameter.
Multi-Channel: Simultaneous measurement of multiple
channels can be performed by selecting from drop down list.
The Multi-Channel capability of the software provides up to
8 parallel power measurements by allowing 8 resources per
Virtual Power Analyzer software.
Scale: Vertical scale sets the scaling of the level axis with the
selection of units
Units: Three units can be used : dBm, watt and voltage
Center: Center position can be adjusted by using up and
down arrow keys.
Sensor Enabled: Individual sensor or all selected sensors can
be enabled or disabled by using ON button.
Averaging: Sensor averaging can be selected by selecting up-
down arrow keys.
Video BW: High or Low video bandwidth selection.
Frequency: Operating frequency can be adjusted by selecting
up and down arrow keys or numerically. Note that cal data is
automatically adjusted with the selection of operating
frequency.
Cal & Corrections: dB offset can be set by using arrow keys or
numerically.
Zeroing and Fixed cal : Sensor zeroing and fixed calibration
can be performed by selecting each specific button.

55 Series Wideband USB Sensor
Page 17 of 28
Trigger/Time:
By selecting icon you will be able to customize all related settings for both timebase and
trigger of a pulse signal.
Time base: Boonton software uses a fixed grid of 10 divisions
for the time-scale. The time resolution is set per division with
the lowest possible value of 5 ns/div.
Trigger Delay: Trigger delay can be adjusted both manually
entering numerical value into the field or using up-down
arrow keys.
Trigger Position: Trigger position can be changed by entering
numerical values into the field and also by dragging a
horizontal bar toward three default positions: Left, Middle
and Right.
Trigger sources and modes: Several trigger modes available
for each trigger source. Multiple trigger sources available
under the drop down list including both "Internal" and
"External" selection.
Trigger Mode: Four trigger modes available: Normal, Auto,
AutoLevel and Free run.
Trigger Level: Trigger level can be changed by using arrow
keys
Slope: Trigger slope can be selected by using positive and
negative options under slope.
Holdoff: Holdoff position allows user to select two different
modes: Normal and Gap.

55 Series Wideband USB Sensor
Page 18 of 28
Marker Settings:
Marker settings will allow you to change both marker 1
and marker 2 positions by using either arrow keys or
entering numerical values into the field. It will also display
the delta value between two markers.
Pulse Definition:
Pulse definition setting allows user to define distal, mesial
and proximal values for pulse thresholds. It is also possible
to change pulse unit from watts to volts. Pulse start and
end gate can be changed both numerically and by
changing up/down arrow keys.
55 Series Wideband USB Sensor
Page 19 of 28
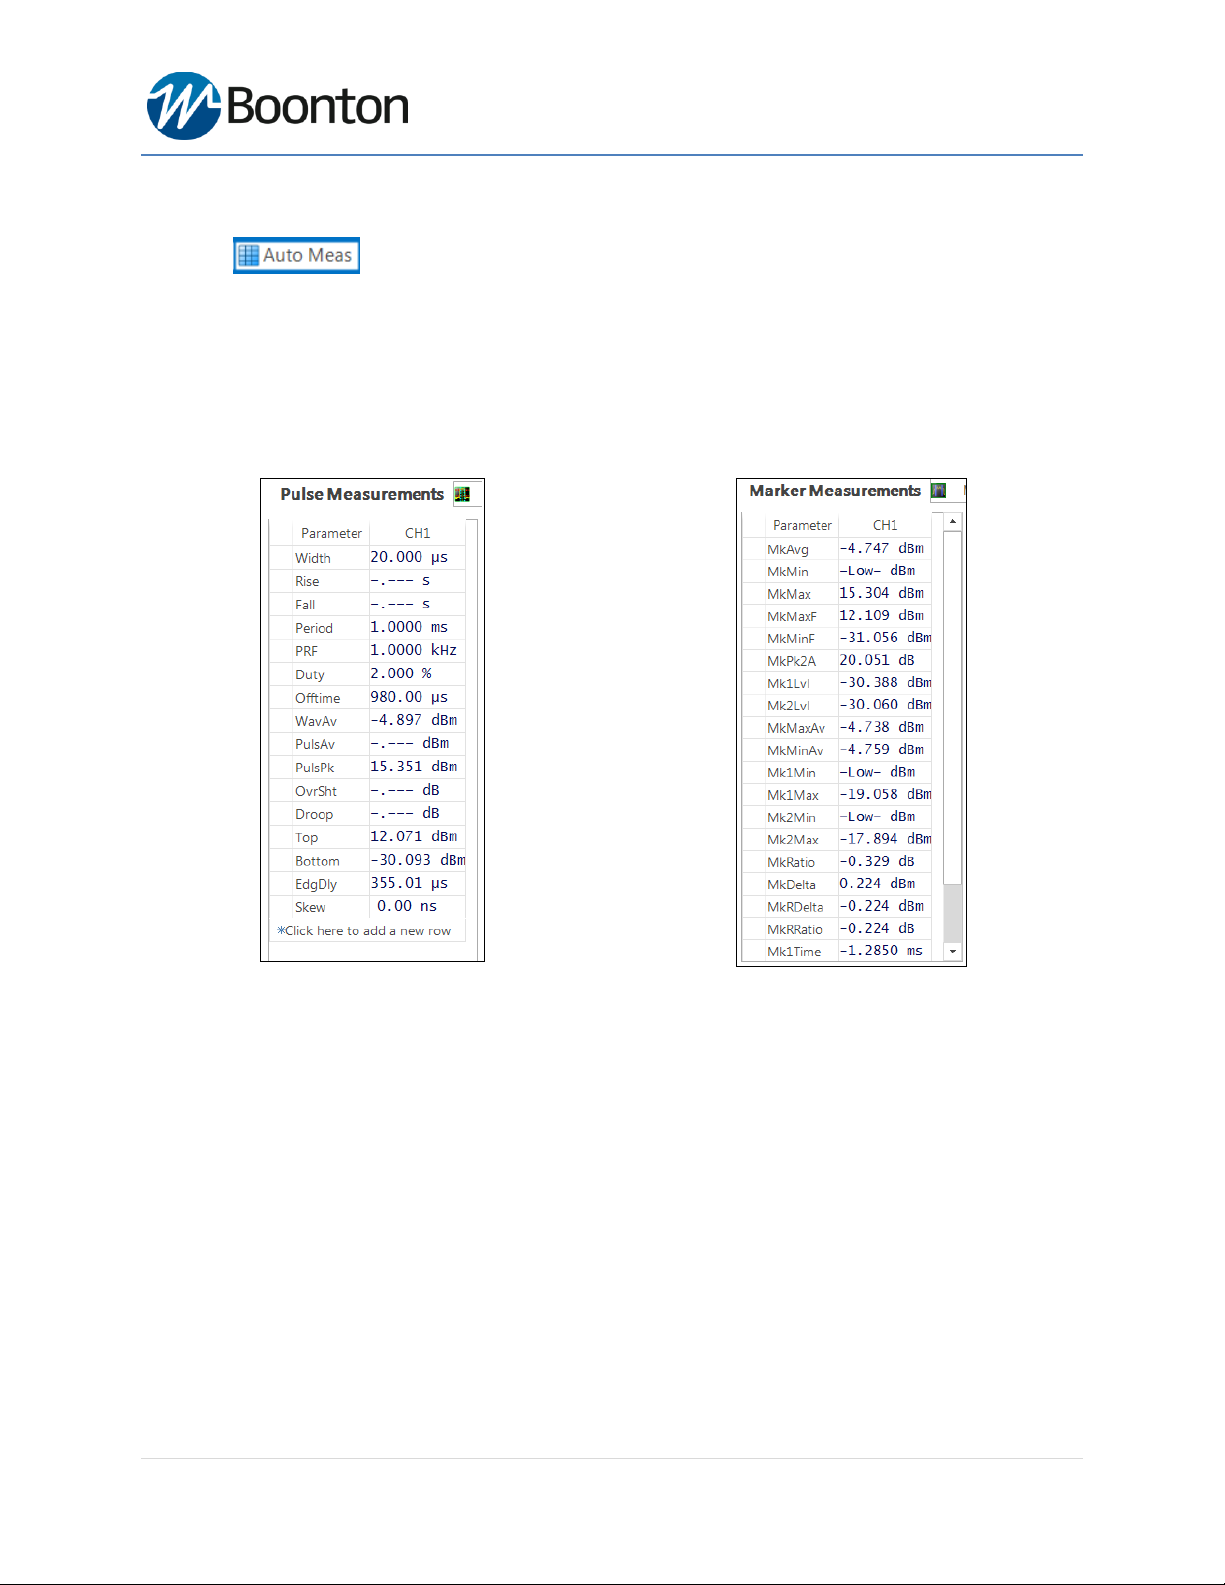
Automatic Measurements:
Selecting icon will allow you to display a tabulated field with a list of parameters for a RF
pulse measurements including marker measurements. Below is an example screenshot for automatic
parameters displayed for a pulse measurements.
NOTE: All field parameters are customizable, can be edited or deleted from the list. The whole table can
be copied and pasted into a spreadsheet in order to make any custom report file along with captured
screenshots by selecting export button as provided by the software.
Fig: A tabulated automatic parameters displayed for a pulse
signal measurement
Fig: A tabulated marker measurements displayed for a pulse
signal
Customize Field Parameters:
All field parameters under automatic measurement are customizable, can be edited or deleted from the
list by selecting individual parameter fields and then by using right click button of the mouse.
Export or Copy Field Parameters:
The whole automatic table or individual parameter field can be copied and then pasted into a simple
spreadsheet or document in order to make a custom report file along with captured screenshots
provided by the software.

55 Series Wideband USB Sensor
Page 20 of 28
Display Settings:
This option allows user to select different trace and graph colors for multiple channels including color
options by selecting both enable/disable features for Average, Envelope, Maximum and Minimum trace
of the measurement. It is also possible to adjust marker color, background, grid colors and more under
"Graph Colors" section of the display settings.
This manual suits for next models
5
Table of contents
Other Boonton Accessories manuals


Popular Accessories manuals by other brands

Ubiquiti
Ubiquiti UniFi USP-Plug quick start guide

Pentel
Pentel Otenznero quick start guide

Scame
Scame ADVANCE-GRP 125A Series quick start guide

Endress+Hauser
Endress+Hauser Deltapilot S FMB70 Safety instructions

Tesla
Tesla SMART PLUG DUAL user manual

WeighTech
WeighTech MicroWeigh Standard Checkweigher product manual


