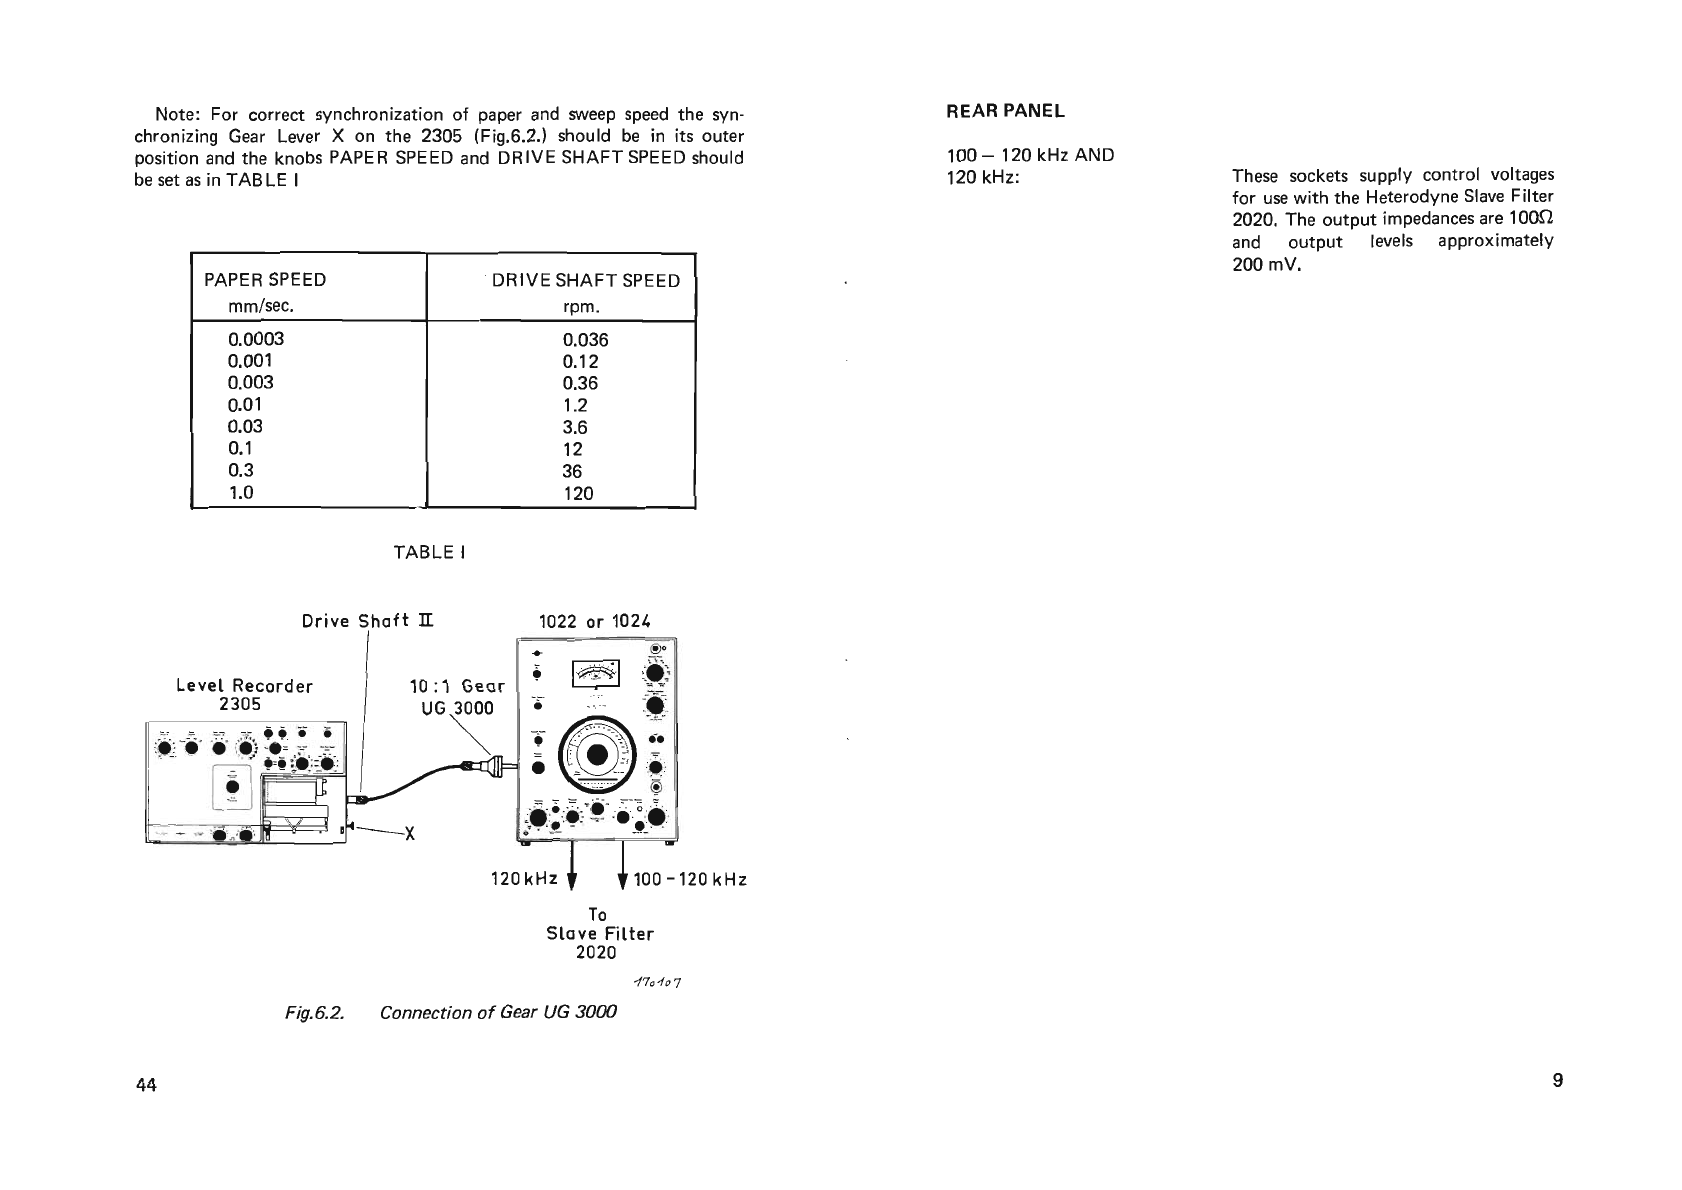
BRUEL & KJAER 1022 User guide

••
B & K INSTRUMENTS:
ACOUSTlCAL.
...
Condeoser
Microphone
s
Pi
ezo-E
lectric
Microphones
M
icrop
h
one
Pr
eamplifiers
Micro
pho
ne
Calibration
Equip.
Sound
Level
Meters
(general
purpose-precision-
and
impulse)
Standing
Wave
Apparatus
Tapping
Machines
Noise
Limit
Indicators
ELECTROACOUSTICAL.
.
..
Artificial
Ears
Artificial
Mouths
Artificia
l Masto
ids
Hearing
Aid
Test Boxes
Telephone
Measuring E
quipment
Audiometer
Calibrators
Audio
Reproduction
Te
st Equip.
STRAIN
....
Strain
Gauge
Appar
atus
Mu
ltipoi
nt
Panels
Automat
ic Sel
ec
t
ors
Balan
cing
Un
its
VIBRATION
....
Acceleromete
rs
Accelerometer
Preamplifiers
A
cc
elerometer
Calibrator
s
Vibration
Meters
Magnetic
Transducers
Capacitive
Tr
ansducers
Vibration
Exciter
Controls
Vibration
Programmer
s
Vib
ration
Signal
Selectors
Mini-Shakers
Complex
Modulu
s
Apparatus
Stroboscopes
GENERATING
....
Beat Fr
equency
Oscillators
Random
Noise
Gene
ra
tor
s
Sine-
Ran
dom
Generators
MEASURING
...
.
Measuring
Amp
l
ifiers
Voltmeters
Deviation
Bridges
Meg
ohmmeters
ANALYZING
....
Band-Pass
Filter
Sets
Frequency
Spectrometers
F
requency
Analyzers
Real-Time Analyzers
Slave Filters
P
sophometer
Filters
Statist
ica
l
Analyzers
RECORDING
....
Level
Recorder
s
(strip-chart
and polar)
Fr
equency
Response
Tracers
Tape
Recorders
BFlUEL&
K ....
A:.FI
DK
-2
850
Nrerum, Denmark.
Te
leph.:
(0
1)
800500. Cable: BRUKJA, Copenhagen. Telex:
5316
,
!l
rtoga El
el('[
(
cr
ikh S
i:JrJ
s-<
a
;::
rer ng
\NVI/W
.
aef
se
+
~&
,
~,
_
~,'l,:,.~
. .
",
,
.'
'.
l • "0
~
.;;..
, .
~
'
~
"
~
,
-....!..
-o -':",
~
•
..
~
..
•
.~.
......._
. Jo..,
~.
-
•
..
:
..
.
~
.
.:
tJ
,
Beat Frequency Oscillator
Type 1022
A signal
generator
covering the
range
of
20-20,000 Hz and designed
especially
for acoustic and e·
lectro-
aco
ustic
measurements. Logarithmic
sweep and
automatic
drive for
recording
of
frequency
response
curves. The
output
s
igna
l can
be
frequency
modulated
and
controlled
by a
compressor
loop.

c:::
o
I-
e::(
.J
.J
U
(fl
o
>-
U N O
Z
UJ N
O
r--
(J)
:J
d
UJ
c:::
L.L.
w
Q..
>-
I-
.r;
u
....
<O
:2
I-
e::(
UJ
m
UJ
I
I-

CONTENTS
1.
INTRODUCTION.
. . . . . . . . . . . . . . . . . . . . . . . . . . . . . . . . . .
..
5
2.
CONTROlS.
• . . . • . . . . . . . . . . . . . • . . . . . . . . . . . . . . . . . . .
..
6
3.
TECHNICAl
DESCRIPTION
..................
..
........
10
4. OPERATION
..
.
.........................
"
..........
15
Preliminary Adjustments
................
.
..........
15
A. Calibration
..........
..
.
..
..........
.
..........
15
B.
Operation using
load
Termi
nals
.......
...
...
. . .
...
16
C.
Operation using Attenuator
Output
.................
16
D.
Frequency Modulation
...............
.
..........
16
E.
Automatic Regulation
of
Output
Power
.............
17
F.
Automatic
Recording .
..........................
18
G.
Remote Controi
....
..
............
.
.............
21
H.
Partial Blocking
of
Frequency
Range
. .
..............
22
I.
Use
with
2020
.....................
.
..
........
. 24
5. APPLlCATIONS
..........
.
...........................
25
A. Electronic Measurements
.................
.
.......
25
B.
Acoustical Measurements .
...........
...
. .
........
28
C.
Mechanical Measurements
...........
.
...........
.
41
6. ACCESSORI
ES
.......................................
43
10:1
Gear
UG
3000
....
.....
. . .
......
.
............
43
Output
Transformers TU 0005 . . .
...
.....
...........
45
7. SPECIFICATIONS
.....•..............................
46
Dimensions:
Ext. dials and knobs Height
Type 1022 A 48 cm
19
inches
Type 1022 B 50.5 cm
20 inches
Type 1022 C 53.2 cm
21
inches
Accessories Supplied
1 Power Cord
1 Flexible Drive Shaft
UB
0041
1 Remote Controi
Plug
Jp 4722
3
Fuses
VF
0009
2
Scale
lamps
VS
1271
2
Scale
lamps
VS 1273
Width
38
cm
15
inches
40 cm
16
inches
48.2 cm
19
inches
Depth Weight
20
cm
15
kg
8 inches 331bs
27.3 cm
19
kg
11
inches 421b$
20.5 cm 19
kg
8 inches 421bs
49

Accuracy
of
Attenuators
Over full
frequency
range
2%
Power Requirements
Mains supplies
of
100-115-127-150-220-240
Volts AC and
50
to
400
Hz.
Power
consumption:
Without
load
With
2.5
W load
20
Watt
26
Watt
Cabinets:
With
the
mechanical design
of
all B &
Kapparatus,
it
is
very easy
to
interchange
the
instruments
with
the
various cabinets.
The
instruments
are
delivered
in
metal cases as
standard
fittings which can be
mounted
in
any
desired way i.e. -mahogany
cabinet
or
frame
for
19"
standard
rack.
Type
1022A
The
B.F.O.
is
in
a metal case.
Type
10228
Similar
to
Type
1022A
but
the
instrument
and
the
metal case are housed
in a mahogany
cabinet
with cover.
In
this
cabinet
it
is
easy
to
transport
the
instrument.
Type
1022C
Similar
to
Type
1022A,
but
it
is
supplied in a frame ready for
mounting
the
instrument
in
a
19"
standard rack.
The
instrument
is
delivered
together
with a chain wheel which can be
coupled
with
the
chain drive supplied with
2305
C.
(The Level Recorder used
for
19"
standard
rack mounting).
1.
INTRODUCTlON
The
Beat
Frequency
Oscillator
Type
1022
is
a precision signal
generator
using solid
state
circuitry
throughout.
It covers
the
range
20-20,000
Hz
and
is
designed
for
acoustical, vibrational
and
electrical measurements.
The
1022
works
on
the
heterodyne
principle using
two
high
frequency
oscillators
one
of
which
operates
at
a fixed
frequency
while
the
frequency
of
the
other
can be varied.
The
required audio
frequency
is
then
obtained
by
mixing
these
frequencies
to
produce
a
beat
frequency.
The
instrument
contains
several features
that
aid experimental work. A
regulator stage
is
provided so
that
for instance
constant
sound
pressure
or
vibration level may be maintained.
The
output
signal can be
automatically
frequency
modulated
by
an inter·
nal
generator
to
produce
a warble
tone
for use during reverberation mea·
surements.
Alternatively
the
output
signal can be
externally
modulated
to
allow wider choice
of
modulation
frequency
and
frequency
deviation.
The
output
attenuator
has a range
of
100
dB
in
10 dB steps and
the
output
impedance can
be
varied
to
give
maximum
power
(2.5
W)
in a load
of
6·60-600
or
6000n.
The
1022
may be
swept
continuously
through
its
frequency
range
by
means
of
an
externa
I
motor
drive. Alternately, parts
of
the
frequency
range
may
be
blocked with adjustable cams
to
suit
any
particular sweep program.
If
it
is
driven
by
the
Level Recorder
2305
it can also be
automatically
synchronized
with
frequency
calibrated paper.
Outputs
of
100-120
kHz variable
and
120
kHz fixed frequencies are
available
for
use
as
controi
frequencies for
the
Heterodyne
Slave Filter
2020.
Remote
controi
facilities are provided
to
start
and
stop
the
scanning
and
the
oscillator and
for
instance
to
lift
the
pen
on
the
Level Recorder
when
the
oscillator
is
sweeping
outside
the
frequency
range
of
interest.
48
5

2.
, CONTROLS
r
------~---------..
Att
enuotor
s.---
Ou
t
pu
t
P
ow
er
Powe
r
Fre'1uency M
atc
hing
Se
at
Automat
ic
Scanning
F
re'1
uency
In
cre
ment e
,.1
___._
Compressor
I
nput
Modulation
Out
pu
t
Fr
e'1
uency Level
~
({
)
;
~'
~
10
00Hz
R
ef
. Signal
Fre'1
ue
nc
y
Co
mp
re
ssor
Sc
ale
Sp
e
ed
Alig
nment
Fig.2.
1.
Front
Panel
FRONT
PANEL
POWER: On/
off
switch for mains supply.
POWER
FREQUENCY
BEAT:
Pushbutton.
When depressed
and
held
in, a
beat
between
the
power
supply
fre-
quency
and
the
output
frequency
of
the
B.F.O. can be
observed
on
the
meter.
Ry
th
15
mE'~'!5
thE'
outp'.!t frequency can
be cal ibrated
with
the
main
frequency
scale.
Frequency
Modulation
Internal: Variable in steps,
1-1.6-2
.5-
4-6.3-10-16
-25
Hz.
Oscillator
Stop
By silent
push-button
or
by
remote
controI.
Attenuator
Output
Ma
ximum
Output
Voltage
12
V
Load
Output
Maximum Pöwer
Output
2.5W
Minimum permissible load impe-
dances are
marked
at
the
Matching
I
mpedance
switch positions.
They
are:
6n
60 n
600 n
6000 n
120 kHz
and
100-120
kHz
Outputs
Output
Level
approx.
200 mV
Output
Impedance
100 n
Compressor
Input
Input
Impedance
approx
. 25 kn
Maximum
input
level 50 V
Remote
Controi
Socket
For
th
e r
equ
ire
ment
s of this sock
et
, see R
emo
te
C
on
tro
l,
Operation
ch
ap
-
ter.
6
47

7. SPECIFICATIONS
Frequency
Range
20-20.000
Hz.
Frequency
Sca
les
Main Scale: Logarithmic over 3
decades.
Incremental
Scale
:
Range
of
-50
to
+ 50 Hz
of
main
scale
setting.
Frequency Characteristics
(without
compressor loop)
Attenuator
Output:
Better than ±0.3 dB
Load
Output
(with 1
watt
load): Better than ±0.5 dB
Distortion
Frequency
Hz
20 200 2000 20,000
Attenuator
Output
(rv
lOV
output)
0.2% 0.1%
0.1
% 0.2%
Load
Output
(1
watt
load) 0.3% 0.15% 0.15% 0.4%
Automatic
Output
Regulation
The built-in compressor amplifier maintains regulation up
to
55
dB
and
will
maintain a constant voltage, current
or
sound pressure level
to
with
in 1.5 dB
over
the
whole frequency
range.
Linearity
of
the frequency characteristic
is
better than ±0.3 dB.
Regulation
speed
variable in steps:
30-100-300-1000
dB/see.
Frequency Deviation
Internal: Variable in
steps,
O± 10 ± 16 ± 25
±40
± 63 ± 100 ± 160
±250 Hz
Externai: With externai generator continuously variable
from
O
to
±300 Hz. Maximum Modulation Sensitivity 5
mV
/Hz
(at 250 Hz frequency
deviation).
AUTOMATIC
SCANNING:
FREOUENCYINCREMENT:
OSCILLATOR
STOP:
MODULATION
FREOUENCY:
REMOTE CONTROL:
FREOUENCY
DEVIATION:
COMPRESSOR SPEED:
FREOUENCY SCALE
ALlGNMENT:
1000 Hz
REF.SIGNAL:
OUTPUT
LEVE
L:
Connects the variable capacitor
of
the
B.F.O.
to
a
worm
drive which
can
be
connected
to
and
driven
by
an
externaI
motor.
Allows exact variation
of
the
output
fre-
quency
within
-50
to
+50
Hz
of
that
indicated
by
the main frequency
scale.
Pushbutton
to
interrupt
the oscillator.
It
is
fitted
for
reverberation measure-
ments and
is
noiseless.
Selects frequency
of
modulation. Choi-
ce
of
1-1.6-2.5-4-6.3-10-16-25
Hz
or
externai modulation.
Six-pin socket
for
connection
of
various
forms
of
remote controi and externai
frequency modulation. For connections
see
Operation chapter paragraph
G.
Modulates the frequency
of
the
fixed
oscillator and hence the
output
frequen-
cy
by O
to
±250 Hz.
Selects the
time
constant in the regula-
tion
circuit. Gives regulation
speeds
of
30-100-300-1000
dB/see.
Fine and
Coarse
potentiometers
to
ad-
just
the
output
frequency
to
coincide
with
that
indicated on
the
main
scale.
When this
button
is
depressed and the
main frequency
scale
is
set
to
"1000
Hz,
Ref.Signal"
an
output
reference signal
is
produced.
Potentiometer giving continuous adjust-
ment
of
output
signal when the com-
pressor
circuit
is
not
in operation.
46 7

COMPRESSOR INPUT:
COMPRESSOR
VOLTAGE
:
LOAD:
MATCHING IMPEDANCE:
ATTENUATOR:
ATTENUATOR
OUTPUT:
MECHANICAL
DRIVE
CONNECTION:
For
connection
of
the
signal
from
the
regulating
transducer
when
automatic
regulation
of
the
B.
F.O.
output
is
re-
quired.
Input
impedance
25
kU
Maxi-
mum
range
of
regulation 50 dB.
Logarithmic
potentiometer
for
controi
of
the
output
voltage
of
the
instrument,
when
compressor
loop
is
applied.
Output
terminals
of
variable
output
im-
pedance.
Contro"ed
by
Matching Im-
pedance
knob.
The
right-hand
terminal
is
grounded.
6-60-600-6000D
indicates
the
mini-
mum
load
impedance
for
each
switch
position.
Another
position
feeds
the
output
through
the
Attenuator.
When
"Matching
Impedance"
is
set
to
"Att"
the
output
signal
can
be
attenuat-
ed
in
ten
accurate
steps
of
10 dB.
The
other
values
indicated
by
the
knob
posi-
tions
refer
to
the
RMS voltage (mV)
available
at
full scale
meter
deflection.
Output
signal fed
through
this
socket
when
"Matching
Impedance"
set
to
"Att"
.
Agrounding
socket
is
placed be-
side it.
Located
on
both
sides
of
the
instrument
are
sockets
for
the
connection
of
an
ex-
ternal
mechanical drive
for
automatic
frequency
sweep.
The
shaft
connection
fits
the
Flexible Drive
Shaft
UB
0041
which
forms
the
mechanical link be-
tvV6eii the B.F.O.
and
the
Level
Recor-
der
2305.
OUTPUT
TRANSFORMER
TU
0005
This
transformer
is
designed
to
a"ow
symmetrical
output
from
the
atten-
uator
output
of
the
B.
F
.0
. 1022.
(Symmetry
better
than
0.1
%1.
The
out-
put
impedance
is
600D
and
the
distortion
0.5%
at
20
Hz
with
maximum
output
voltage
from
the
B.F.O. (12.5
V)
.
The
accuracy
of
the
Transformer
is
±0.2
dB
in
the
frequency
range 10 Hz
to
35 kHz.
In
addition
a
core
material has been
chosen
for
the
transformer,
which
makes it possible
to
"preload"
the
secondary
winding
with
a
current
of
100
mA
without
causing
additional
distortion
for
frequencies
above
300 Hz.
The
transformer
ratio
is
\ffQT.'"'
The
voltage transmission loss
of
the
transformer
when
loaded
by
600D
is
approximately
16 dB.
8 45

Note: For correct synchronization
of
paper and sweep speed
the
syn·
chronizing Gear Lever X
on
the
2305
(Fig.6.
2.1
should be
in
its
outer
position and
the
knobs PAPER SPEED and DRIVE
SHAFT
SPEED should
be set as
in
TABLE I
PAPER SPEED . DRIVE SHAFT SPEED
mm/see. rpm.
0.0003
0.036
0.001
0.12
0.003
0.36
0.01 1-2
0.03
3.6
0.1
12
0.3
36
1.0
120
TABLE I
Drive
Sheft
II
1022
or
1024
~
o
e
.
~
... ;.
,
"".
;
~
.
~~.:.
~
-
...
Level
Recorder
10:1
Geer
2305
..
,:~
~
f
:
UG~
.
-.-
e"
'
~
.-.
~~
~
.
=
~
=~
~~
-
~.
~
~
·~
OOlft
II :.--
,.
e:."
.:T
.'
,.
--
..
0:.·..,
h,:
.
'
,,~,
•
....
~
.:.
--
_
.-
-
120
kHz
100-120kHz
To
Sleve
Filter
2020
-170107
Fig.6.2. Connection
of
Gear UG
3000
REAR PANEL
100
-
120
kHz AND
120
kHz: These sockets supply controi voltages
for use with
the
Heterodyne Slave Filter
2020. The
output
impedances are
100n
and
output
levels approximately
200
mV.
44 9

3.
TECHNICAL
DESCRIPTION
A block diagram
of
the
1022
is
shown in Fig.3.1.
L
ood
OUTPUT
Ert
.
120~Hl
Mod.
Output
'n
pv,
Aue'''JoIO{
(ontro(
R.mot.
O".IPUI
Input
I"
..
"J
'
Fig.3.1. Block Diagram
The
fixed oscillator
is
atuned
LC
type
and
works
at
120
kHz. Incorporat-
ed
in
the
tuned
circuit
is
a variable
capacitor
which
is
operated
by
the
Frequency
Increment
knob.
This
allows
exact
frequency selection within
±
50
Hz
about
any setting
on
the
main scale.
In
addition
this capacitor per-
mits frequencies
down
to
10
Hz
to
be
obtained
at
the
risk of slightly more
distortion.
An
output
to
supply a reference signal
or
a
controi
signal for
the
Hetero-
dyn
e Slave Filter
2020
is
provided.
The
output
impedance of
the
120
kHz
output
socket
is
1
oon
and
the
signailevei
is
of
the
order
of
200
mV.
The
fixed oscillator can be frequency
modulated
to
produce
a warble
tone.
The
oscillator
is
connected
directly
to
a reactance circuit
to
enable
~x
ternal
modulati
on
of
the
s
ig
na!, b
ut
in
the
case
of
in
te
r
iiu!
mod
ul
at
ion a
relaxation
type
of oscillator employing a unijunction transistor
to
controi
the
reactance circuit
is
also used.
6. ACCESSORIES
10:1 GEAR
UG
3000
When making narrow band frequency analyses of a spectrum
that
has
narrow resonances it
is
important
to
have a slow and
constant
sweep speed.
Clearly
if
the
sweep speed varied,
the
narrow filter might
jump
past
one
of
the
resonances.
The
2020
is
driven electrically from
the
1022
which
is
in
turn
driven by a
flexible
shaft
from
the
Level
Recorder 2305. Hence for narrow band ana-
lyses
the
10:1 Gear
UG
3000
is
recommended (Fig.6.1.l. Generators
1022
or
1024
connect
directly
to
this gear, which
is
driven from DRIVE
SHAFT
II
of
the
2305
Level Recorder via
the
Flexible Shaft
UB
0041,
as shown in
Fig.6.2.
Thus
the
mechanical loading
on
the
Flexible
Shaft
is
considerably
reduced and
the
sweep speed regulation
is
improved by a factor
of
10
or
more.
To
1022
or
1024
To
UB
004i
Fig.6.1.
The
10:1
Gear
UG
3000
43
10

To
measure
the
strain
on
the
test
object
a resistance strain gage should be
used and a Strain Gage
Apparatus
1516
will be
found
ideal as
the
measuring
bridge. The
output
voltage from
the
Strain Gage Apparatus can be fed
directly
to
a Level Recorder with linear
potentiometer
for
automatic
record-
ing.
An example
of
such a recording,
taken
on
a
thin
metaI bar, showing
the
mechanical strain and indicating its resonant frequency,
is
shown
in
Fig
.
5.21.
DDDDDDOOOODDODODDDDDDDODDDJ
50
db
20
10
o
50
100
200
Hz
300
~o
1?DD
I{q
Fig.5.21. Recording
of
mechanical strain in a
bar.
Instrumentation set-up
as
in Fig.5.20.
The
reactance circuit
is
needed
to
controi
the
actual frequency deviation
(modulation swing)
of
the
fixed oscillator by producing an inductive react-
ance across
the
oscillator's
tuned
collector. The deviation can be varied
linearly from O
to
±
250
Hz
where
the
sensitivity
is
approximately
5 mV/Hz.
A
saw·tooth
generator determines
the
frequency
of
modulation i.e.
the
rate
of
change
of
the
frequency swing
of
the
oscillator. Frequencies
of
1-1.6-2.5-4-6.3-10-16-25
Hz
are available. Provision
is
also made
for
modulation by an external generator. Alternative modulation frequencies
or
wave shapes can
the
n be chosen and frequency swings
of
up
to
±
300
Hz
obtained
(but
the
modulation sensitivity varies).
The
signal
from
the
fixed oscillator
is
passed
to
aregulating
amplifier
which controls
the
output
level.
The
regulating amplifier
is
used
to
perform
the
oscillator
stop
and dead zone blocking. A compressor amplifier can
be
switched
in
to
controi
the
regulating amplifier so
that
constant
output
level
is
obtained.
When
the
instrument
is
being used for instance
to
power a
loudspeaker,
the
compressor circuit can be used with a
microphone
to
main-
tain a
constant
sound pressure level.
The
compressor circuit consists
of
an amplifying stage and a full-wave
averaging rectifier stage.
The
signal from
the
rectifying stage
is
then
used
to
varv
the
gain
of
the
regulating amplifier. A variable
potentiometer
(Com-
pressor Voltage)
in
the
input
circuit
of
the
regulating amplifier
can
be used
to
controi
the
output
power from
the
instrument
when
automatic
regula-
tion
is
used.
The
speed with which
the
variation
in
output
level
is
regulated
back
to
normal
depends
on
the
setting
of
the
Compressor Speed knob,
but
also
depends
to
a certain
extent
on
the
amount
of
the
deviation from
the
normal
level. Compressor speeds
of
30
-
100
-
300
-
1000
dB/sec. are available
and are
determined
by
the
integration time
constant
of
the
rectifying cir-
cuit.
The
input
impedance
of
the
Compressor Input
is
approximately
25
kQ
and
the
maximum
range
of
regulation
is
50
dB. Regulation characteristics
for
different
positions
of
the
Output
Level
potentiometer
are shown
in
Fig.3.2.
The
variable oscillator
is
of
similar design
to
the
fixed
one
except
that
it
has a variable capacitor
in
its
tuned
circuit
to
varv
the
oscillation
frequency
between
100
and
120
kHz. A worm gear,
connected
to
the
capacitor
42
11

• dB
Output
L.v.l
10
Distorled
Signal
MAX.
METER
DEFLECTION
-10
-20
-30
Output
LeveL
- o }
~~10
dB
dB down from
~30
dB
max~
meter
-40
50
dB
~
deftection
-50
-60
-70
_Naise
LeveL
of
B.F.O.
-80
,--,:'-::::='-~====
]
-90
-20
-12
-6
-3
---t--~----~------~----~----------~--.~
dBre
1Y
..
y
0~1
0.2
0.3
0.4
0.5
0~6
0.7
0.8
0~9
Camp~
Voltage
on
"Compressor
Input"
CCompressor Voltage"'
on
maximum)
17oo})1j
Fig.3.2. Regu!ation characteristics
for
different
positions
of
Output
Leve!
potentiometer
spindie, perrnits
automatic
tuning
with
the
aid
of
an externai
motor
such
as
that
of
the
Level Recorder 2305. A rnagneiic ci
utc
h, which can be
remoteiy
controlled,
is
used
for
connection
of
the
externai drive
to
the
capacitor
spindie.
C. MECHANICAL MEASUREMENTS
Strain Measurements
on
Vibrated Objects
In
the
measuring
of
mechanical strain
on
objects
under
vibration, it
is
essentiai
that
the
vibration acceleration
is
kept
constant
within
the
range
of
frequencies
at
which measurements are being
taken
and
that
inherent
re-
sonances in
the
system have no
effect
on
the
magnitude
of
the
driving force.
The
illustration
in
Fig.5.20. shows a
test
rig
for
strain measurements
of
small mechanical
constructions,
the
B.F.O.
1022
section
of
the
Automatic
Frequency
Response Recorder
Type
3308
feeding
the
shaker,
the
object
under
test
being placed
on
the
shaker
table.
2623
smaLL
(;lo mechanicaL
•
I~I
,j
:
-.
:"j:
construc-
tion
·e"-'"'0
\
..
•
~
~
J
'.
-
~
o
....
;:i
!;
:
·!·.:!._
~
Ern
!
.
l2-
~
•
3308
17""
'If
Fig.5.20.
Set-up
for
the measurement
of
vibration in small specimens.
To
keep
the
acceleration
constant
a controlling system
is
utilized. This
system consists
of
an Accelerometer
mounted
on
top
of
the
test
object. As
the
acceleration has
to
be
constant
and
under
controi
the
output
voltage
is
connected
via a Preamplifier
2623
and
a Measuring Amplifier
2606
to
the
compressor
input
of
the
B.F.O.
By using
the
Measuring Amplifier
2606
the
acceleration can be read
directly, so
the
force
on
the
test
object
can be calculated knowing
itsmass.
12
41

le-veIRe-corde-r
2305
M,
oll"';"
; Amp
löf
l. t
260
6
M
eo~u
.
i
ng
Amp
li
fi• •
2606
BF
O
102 2
ffi
(
~
:
510"fI
Filler
..
.;;.
:
i'
202
0
r~
i
.
~-
.
-
~
,
-'.... _ a
~
_
.~
:
:i
!~,'!
i!
:.
'.
' .
, F
1
00-
1
20
kHI
12
01c
Hl
Fig.5.
19.
Set-up
for
automatic
recording
of
hearing
aid
harmonies
The
percentage
harmonic
distortion
can
now
be calculated
and
ios defined
by:
Pr
-x
100
%
P
Where
"Pr"
is
the
RMS
harmonic
sound
pressure level excluding funda-
mental
and
"P"
is
the
overall RMS
sound
pressure level.
Alternatively
this
can be expressed by:
(P22 +
P3
2 +
P4
2 x
100
%
·
-----
-t
Harmonic Distortion =
~12
+ P 2 +
P3
2
2
where P1 =
amplitude
of
fundamental
sound
pressure
Pn
=
amplitude
of
the
n
th
harmonic.
Note: When
the
"Rejection"
output
is
used
for
harmonic
analysis
the
compressor feedback voltage can be
taken
from
the
"Output"
of
the
same
instrument,
since
both
"Rejection"
and
"Output"
circuits
function
simul-
taneously.
When
the
capacitor
is
set
to
frequencies above
20
kHz
or
below
20
Hz
the
signal from
the
fixed oscillator
is
blocked so
that
no
output
voltage
is
obtained.
This has
the
advantage
that
when
automatic
recordings are being
taken
with
the
Level Recorder
2305,
no
unwanted
curves
appear
on
the
paper.
The
cut-off
section can be made wider by means
of
the
adjustable
cams fixed
on
the
capacitor
spindie (Fig.4.5).
The
Remote
Controi plug
is
also needed
to
make
certain
connections
inside
the
instrument.
By
this
method
the
overall frequency range
of
the
apparatus
can be reduced
to
about
one
octave. In applications where
the
1022
is
used
with
the
Level
Recorder
2305
the
adjustable cams can be made
to
operate
the
pen
lift
..
A
1000
Hz
reference signal can be supplied
at
the
output
sockets
when
the
Reference Oscillator
is
connected
and
the
scale
pointer
is
set
to
the
position
1000
Hz
Ref.signal.
The
use
of
this reference signal can be seen in
the
operation
chapter.
The
signals from
the
fixed and variable oscillators are mixed and
then
passed
to
a low-pass filter.
The
filter has a cut-off
frequency
of
50
kHz
and
is
used primarily
to
eliminate
any
100
-
120
kHz
or
220
-
240
kHz
compo-
nents.
The
filtered signal
is
then
fed
to
the
output
amplifier. This will give
an
output
power
of
2.5
W nominal load (Le.
the
load indicated on
the
Match-
ing
I
mpedance
switch).
The
output
ampl ifier
is
current
limited
to
protect
the
transistors.
Finally
the
output
signal
is
fed
to
an
auto
transformer
for
impedance
matching with
the
load.
The
markings
6-60-600-6000D.
around
the
Matching Impedance Switch indicate
the
minimum
load impedances
that
should be used for each switch position.
The
signal
can
also be passed
to
an
output
attenuator
which allows
output
signals
to
be selected
between
120
pV
and 12 V, (full scale
deflectionl,
in
accurate
10
dB
steps.
The
over-
all
accuracy
of
the
attenuators
is
2%.
The
voltage at
the
output
terminals
is
indicated
by
a
transistor
voltmeter
which measures
the
average value. It
is
calibrated
in
RMS
values
of
a sinusoidal voltage and
the
accuracy over
the
frequency
range
20-20,000
Hz
is
1.5%
at
full scale deflection.
Additionally
,
there
is
a dB sca
le
which gives dB values
re
1 volt.
It
should be
noted
that
when
the
Attenuator
Output
is
used,
the
output
voltage
only
equals
the
corresponding
meter
deflection
when
the
impedance
of
the
load
connected
to
the
terminal
is
high
compared
with
the
50D.
attenuator
impedance.
The
sensitivity
of
the
voltmeter
is
automatically
changed
when
the
posi-
tion
of
the
Matching
Impedance
switch
is
altered. Full scale
meter
deflec-
tion
in volts
is
indicated
for
each switch position.
The
Attenuator
switch
is
similarly marked
and
in
addition
has dB values re 1 volt.
40
13

The
signal-to-noise ratio
of
the
instrument
is
better
than
70
dB
for
maxi-
mum
output
voltage. It
is
independent
of
the
position
of
the
attenuator,
but
somewhat
dependent
on
the
position
of
the
Output
Level
potentiometer.
The
optimum
setting
is
when
the
voltmeter
indicates
20
dB.
The
amount
of
harmonic distortion also
depends
on
the
setting
of
the
Output
Level
potentiometer.
As
long as
the
output
is
kept within
the
meter
range
the
distortion
will be
of
the
order
indicated
in
Fig.3.3.
The
1022
can be operated
from
100,
115,
127,150,
220,240VoltsAC
and
50
to
400
Hz mains supplies and
the
maximum power
consumption
is
of
the
order
of
26
Wwith full load.
O·L l
Watt
La
a d
fa3
/
z
c "
'"
1'-..
V
~
0·2
.........
2 V V
~
i'-
r--
V
o
t--
l..--At"t.
la
v
Na
lo
a d
:;
o·,
r--
t---
-
I----
u
c
l
c
o
Z
10
20
3o 50 laO l k lOk
20k
Frequency
( Hz) _
1700
JS
Fig.3.
3.
Distortion curves
for
different loads
D D D D D D D D D D D D D D D O D D D D D D D D D D O D D D [
e'
Q
~
j
CII'
~
50 25
B.Gel&
(!Gr
-Objott
-
--
db db
Sound
tran
sm
ission
.,
'"
recording
wIthout
Filtering
JO
"
...
"'-
'"
10
0-
,
"""
RICI
~
z-,
L..r
~
L l
.....
F
r
~
20
10
,
p
""
'W
r.
So.,:
p
....
Sp..:
50
e
o.,
MuhfpIy
Fnq.
Sco&.
b
r;
_'
_ o 0 -50
100
200
"'"
1000 2000
>XXI
1
00
1lO1lO
OP1123
100
1000 10(
00
16'3S.5"
Fig.5.18. Sound transmission recording
without
filtering
An
instrument
set up
for
the
automatic
recording
of
hearing aid harmo-
nics
is
shown
in
Fig.5.19.
The
test
environment
is
provided by
the
Type
4212
Hearing Aid Test
Box, which gives practically free-field
conditions
over
the
frequency range
150
Hz
to
5 kHz.
The
receiver
of
the
hearing aid
under
test
is
excited by a
loudspeaker inside
the
anechoic
chamber
of
the
test
box.
Sound
pressure
at
the
position
of
the
receiver
is
maintained
constant
byaregulating
condenser
mi
crophone
which provides feedback
to
the
compressor circuit
of
the
oscil-
lator supplying
the
loudspeaker signal.
The
hearing aid
output
is
coupled
to
an artificial ear as required by
the
I
EC
(Recommendation
118).
The
artifi-
cial ear contains a pressure response
microphone
which
detects
the
output
from
the
earphone. Using
the
Slave Filters
"Output"
(L.F.) and
"Rejection"
out
p
ut
s the respective frequency and har
monie
analys
is
spectrogr
<lms
can be
recorded on
the
same
frequency
calibrated
chart
using
the
Level Recorder.
14
39

[ooooooooooooooooooooooooooooooJ
Br
O.1
& KjCllr
....
BnW"
klc-
-"''''
_ot;o<t-
__
.....
Sound
transmission
anal;tsis
'"
'"
uSlng
2020
Slcve
Filter
3.16Hz
Bandwidth
'"
"
'"
10
'"
"-
""'
"'"'
"""
RMS
z-t-
,
10
5
LlJ&
Fr
.:
20
,,.
50
'r
h.
Sp
. e
0.1
.......
,
'-
""'"
.,,
_1_
••
.....
~
200
....
'00
'000
2000
",..
'OX
OP
1123
'"
100
"'"
1000
10C
00
16f35~
Fig.5.
17. Sound transmission analysis using a Heterodyne
Slave Filter
2020
with 3.15 Hz bandwidth
Experimental results
obtained
for
a receiving
room
where a high level
of
background noise was
present
are
shown
in
Fig.5.17.
and
5.18.
The
results
obtained
using
the
2020
(Fig.5.17.)
show
a considerable
improvement
in
signal
to
noise
compared
to
those
obtained
with no filter (Fig.5.18.).
Note:
To
ensure
that
the
compressor
circuit
is
controlled
from
the
funda-
mental
of
the
sound
source,
another
2020
could
be
used with
the
2606
in
the
compressor loop.
Automatic
Recording
of
Harmonics in Hearing Aids
Another
use
of
the
Heterodyne
Slave Filter with
the
1022
is
shown
below.
The
2020
can be used
for
frequency
rejection
whereby
it
will reject
frequencies
by
over
40
dB over a
3.15
Hz
bandwidth.
38
4.
OPERATION
PRELlMINARY
ADJUSTMENTS
Before
the
instrument
is
used check
the
voltage
selector
on
the
rear panel
is
set
to
the
correct
line voltage. If not, remove
the
central fuse
and
adjust
with a small coin
or
screwdriver.
A.
CALlBRATION
1.
Switch
on
and
allow 1
minute
to
warm
up.
2.
Set
MODULATION
FREOUENCY
and
COMPRESSOR SPEED
to
"Off".
3.
Set
main scale
pointer
to
the
frequency
of
the
mains
supply
(e.g.
50
or
60
Hz) checking
that
the
frequency
increment
scale
is
set
to
zero.
4.
Set
the
meter
deflection
to
higher
than
centre
sca
le
reading with OUT-
PUT LEVEL knob.
5. Press POWER FREOUENCY BEAT
button
and
hold
"in".
At
the
same
time
slowly
adjust
the
FREOUENCY
SCALE
ALlGNMENT
FINE
knob
until a large
fluctuation
registers, slows up,
and
practically ceases
on
the
meter
dia!.
6.
Set
main scale
pointer
to
20
Hz and
subtract
20
Hz
with
FREOUENCY
INCREMENT knob.
If
the
meter
deflection
dropsto
zero
then
the
B.F.O.
is
·calibrated. If
not,
continue
to
point
7.
7.
If
the
meter
deflection
does
not
drop
to
zero,
adjust
FREOUENCY
SCA-
LE
ALIGNMENT COARSE with a screwdriver until
the
meter
deflection
does.
8. Reset
the
main scale
po
i
nter
to
the
frequency
of
the
mains
supply.
Reset
frequency
increment
scale
to
zero. Make a final
adjustment
with FRE-
OUENCY SCALE
ALlGNMENT
FINE
to
obtain
the
exact
position
of
"slow
beat"
as in
point
5.
The
B.F.O.
isthen
calibrated.
15

B.
OPERATION USING
LOAD
TERMINALS
1.
Set up and calibrate
the
Oscillator as above
in
A.
2.
Select suitable matching impedance for the load using
MATCHI
NG
IMPE-
DANCE switch.
3. Connect load
to
LOAD
terminals.
4. Turn pointer on main frequency dial
to
desired frequency, finely adjust-
ing with FREOUENCY INCREMENT knob
if
necessary.
5. Select required
output
voltage using OUTPUT LEVEL knob.
C.
OPERATION USING ATTENUATOR OUTPUT
1.
Set up and calibrate
the
Oscillator
as
above
in
A.
2.
Set MATCHING IMPEDANCE switch
to
"Att".
3. Select appropriate voltage range with ATTENUATOR knob.
4. Connect load
to
ATTENUATOR OUTPUT.
5. Turn pointer on main frequency dial
to
desired frequency, finely adjust-
ing with FREOUENCY INCREMENT knob
if
necessary.
6.
Select required
output
voltage using OUTPUT LEVEL knob.
Note: The meter reading
is
correct only when the impedance of
the
load
is
high compared
to
the
50,Q attenuator impedance.
D. FREQUENCY MODULATION
When a frequency modulated
output
signal
is
required:
1.
Set
knobs:
MODULATION FREOUENCY required value
FREOUENCY DEVIATION zero
2.
Calibrate
the
Oscillator from point
A.
3. above.
3. Set FREOUENCY DEVIATION knob
to
required bandwidth.
:0
o D C O O O D C Q O O O
[J
O D O D D O O O O D O O O D O O O C O O O O
Cl
O O O D O O
CI
O O O O D O O
"'
~
Goto+
L
I.-
ho
_ .
........
_
~
---
-
.....
,.
_
.
~
-
....
__
.
"-_.
-
~
ap
0123
m
1000
10000
Fig.5.15. Reading obtained
with
a set-up
as
in
Fig. 5.14.
50
dB
range
potentiometer
used
in
Leve/ Recorder
A set up
is
shown
in
Fig.5.16. where a compressor loop
is
used
to
keep
the
sound level constant. The feedback signal
is
amplified by a Measuring
Amplifier 2606. Another 2606
is
used
in
conjunction with
the
2020
to
analyze
the
attenuated signal
in
the
receiving room. The analyzed signal
is
then recorded on frequency calibrated paper using a
Level
Recorder 2305
and thus provides a direct measure of
the
sound insulation qualities
of
the
room
at
any frequency
in
the
measuring range.
S
our(
e R
O(lm
Re
, . ;
...
ln9 R(lem l
ev
el Re
(ord
. r
2305
Micro
p
hon
e
414
5
1
02
2
@o
•
I
~
I
,
~
:
51
0ve
Fi
ll
er
:.
-.
2020
ii
r~
:i
~
~
~
HI
~------------
~
-.
w
..
.- •
;
_
i:~
~
'
!
-
-
.
:
!
_
.
~
....----.,
I •
1
00
-1
2
0kH:t
12 0
kH
z:
170
Q
1.{7
Fig.5.16. Set-up
for
measurement
of
airborne sound insu/ation
using a Heterodyne
S/ave
F
i/ter
2020
37
16

receiver room transmi
tter
room
414
5 4145
L
.
S
·
'~1+t-1I
--,
261
9 2619
- -
=1=1
_:.
!:
r-
@o
44
08 ·
.
~
."-',
·
~
.
;
i
~
:
e:
-
.-
e
:'
....
···
\
.,
'
;
:
~
I '1
•
\
~
i
.
..
""7'"
ift
:
.
i
!
~
:
'
!
·
'
:;
~
.
-,-
'
.
'
.
~
I'
lIP
t!!
:~
4Tl
@
~
-:,~
,
~
--
-----u>O6 [m' 3
30
8
..
1
11oo'lb
Fig.5.14. Set-up for measurement
of
the sound insu/ation
properties
of
a wall
ing Amplifier
2606,
the
different
sound
leve
Is
picked up
in
the
two
rooms
are taken alternately and ampl ified before being fed
to
the
Level
Recorder.
The
result
is
that
two
independent curves are automatically reproduced
on
the
recording paper, enabling
the
sound level difference between
the
two
sides
of
the
wall
to
be read off
in
decibels. Such a recording
is
shown
in
Fig.5.15. The sound absorbed by
the
receiving room must be taken into
account
.
The
main problems
in
the
transmission and reception
of
airborne sound
are
the
power
aV;Jilable
from
the
source and
the
signal
to
noise ratio
of
the
receiver. Both these problems can be eased
if
a narrow band noise source
and a narrow band receiver are used.
The Heterodyne Slave Filter
2020
has very narrow bandwidths
and
is
ideal for such measurements. It can also be directly controlled by
the
1022.
4. Proceed from
point
B.
20r
C.
2 as required.
E.
AUTOMATIC REGULATION OF OUTPUT POWER
By
means
of
the
compressor circuit it
is
possible
to
regulate
the
output
from
the
oscillator. When a
constant
voltage
is
required,
the
output
voltage
from
the
oscillator should be used as a controi voltage. (Fig.4.1a.l. A con-
stant
current
is
obtainable
if
the
voltage
drop
across a resistor
in
series with
the
load
is
used as
the
controi voltage (Fig.4.1 b.l.
Similarlya
reference
microphone can be used
to
controi sound pressure
or
an accelerometer can
be used
to
controi vibration level. Examples can be seen
in
the
Applications
chapter.
Lood
__
o ,
_0---
-'
From
From
Oscillator
Oscillator
To
Compressor
To
Compressor
Input
Input
o)
Constant
Voltoge
b)
Constant
Current
1700%
FigA.
1.
Constant vo/tage and constant current compressor
/oops
To use
the
compressor loop proceed as follows:
1.
Set up
and
calibrate
the
Oscillator as described above in
A.
2.
Set
the
MATCHING IMPEDANCE switch
to
the
desired position.
3. Connect
the
load
to
LOAD terminals
or
to
the
ATTENUATOR OUTPUT
at
the
top
of
the
instrument, see B
or
C.
4. Feed
the
controi voltage
to
the
COMPRESSOR INPUT terminal.
If
neces-
sarv use an amplifier which has a linear frequency characteristic for
the
amplification
of
the
controi
signal, approximately 0.5 volt being required
for
full utilization
of
the
compressor. (See Fig.3.21.
5.
Set
COMPRESSOR VOLTAGE and OUTPUT LEVEL
to
maximum (fully
clockwise).
36
17

6. Feed
the
voltage
to
be measured
to
the
recording
instrument,
e.g.
the
Level Recorder
2305.
7.
Set
COMPRESSOR SPEED
to
required value.
8. Regulate
the
desired
output
voltage by
turning
COMPRESSOR VOL-
TAGE
knob
counter-clockwise.
Note: When
the
Beat Frequency Oscillator
is
used
in
conjunction
with
the
Level Recorder
2305
the
writing speed
of
the
Level Recorder should be
kept
below
the
regulation speed
of
the
compressor.
It
is
also possible
to
obtain
different
regulation characteristics
dependent
on
the
position
of
the
potentiometer
marked OUTPUT LEVEL. This can be
seen
from
Fig.3.2.
F. AUTOMATIC RECORDING
By
combining
the
1022
with a Level Recorder
2305
or
using an Auto-
matic
Frequency
Response Recorder
3308,
it
is
possible
to
automatica"y
record
the
frequency
responses
of
four
terminal networks.
The
fo"owing
procedure
should
be
adopted:
1.
Set
up
and
calibrate
the
oscillator as above
in
A.
2.
Connect
the
instruments
as shown
in
Fig.4.2.
The
flexible driving
shaft
(UB
0041)
should be
connected
to
the
upper
driving
shaft
of
the
Recorder, DRIVE
SHAFT
I (Fig.4.3.).
The
other
end
should
be con-
nected
to
the
drive
socket
on
the
left hand side
of
the
1022
(Check
engagement
by
switching on
the
Level Recorder
and
the
magnetic
clutch
of
the
1022
and
note
if
the
scale
pointer
rotates).
3.
Set
PAPER DRIVE
to
"Stop,
Forward".
4. Select
and
insert required Range
Potentiometer.
(NB: Place POTENTIOMETER RANGE
knob
to
"Standby"
when
changing
potentiometers).
5.
Set
POTEf'JT!O
~
~ETER
RANGE knob
to
CO
ri
es
pond
to
the
Range
Potentiometer
being used.
Example:
50
dB Range
Potentiometer
.
Paper Speed
100
mm/sec.: Use
the
section
"50
dB 10
mm/sec."
and divide
the
measured result by 10,
see also Fig.5.13.
I
CDOCODOOc::-:-:l
"
. Ronge P
otenti
ometer
:
SOdb
·
Popotr
. Sp
eed
:
100
mm/
see
. Reoding:-
5.SSeC..-
O'
''0
.
555«
"
("'a~!J
Fig.5.13.
Use
of
Protraetor
se
2361, ten times higher paper
speed used than on the proetraetor (50 dB
10
mm/see.).
Reading then divided
by
10 i.e. 0.55 see.
Airborne
Sound
Insulation
A means
of
automatica"y
carrying
out
this
test
is
shown
in
Fig.5.14. The
wall
under
test
is
placed
between
two
rooms, which are
termed
"the
trans·
mitter
room"
and
"the
receiver
room"
respectively.
In each
of
the
two
rooms
separated
by
the
wall
is
placed a
Type
4145
Condenser Microphone individually
coupled
to
a Preamplifier
Type
2619.
Two
extension
cables
connect
the
microphone
units with
the
Two-Channel
Microphone Selector
4408.
The
Microphone Selector
is
remotely controlled
by
the
two-channel switching device, which
is
"built-in"
to
the
Level Recor-
der
portion
of
the
Automatic
Frequency
Response Recorder 3308. A
50
dB
Range
Potentiometer
can be used,
the
1022
should be frequency
modulated
and
the
loudspeaker (or loudspeakers) placed so
that
a
sound
field, as dif-
fuse and isotropic as possibie,
is
buiit up.
By
means
of
the
Microphone
Selector
which
is
connected
to
the
Measur-
18
35

DC CC
O~
CDD
ooooco
a
OO
O
O
D
ODO
COOCQCOa
o
DOOOOO
OOO
D
OO
DOOOO
O
"
;
~
"
'
+
ICI
.....
,
,...
-
,I(...,
......
''''"''
"
Imt
rtheo
~
T:01.5sec. $ ..
!W·
otJIe
~
l
-.
..
Of
tJe
MQd'E'[
eq
neJs
I
"'
Q
t-
l-J
11
-f
..
,..122-
,~
~
,
-
~
-
--
' ..
:~~
'
o .
- o
QP0123
lÖ;o
111
.,00
ZIC
D
1000
~
XCi<>
lO~
XCI
(
:zs
~
:
~
~
1.00
'dI
""
-
16
185
'
Fig.5.
11_
Recording
of
decay
curv.es,
compressor loop used
laa~COOO~D~~OOQ~COOOOOOO~D
'oo~o
a
aOO
_O ~O
ODooco
"
n
O
~Ol
_
.-
50
-=
3'5"'"
_
----==
~oooc
/
'
_
___
_
R.etifier
:
Potenti
ometer
Range:
RMS
~
~
-
~
'
-'--
-
-
<OOOG's
=
'OOOOc/,
==-
-:
Lower
limiting
Fr.q
.
50
~
Wrlting
Speed :
LOD
~
:
Poper Speed: .
'DO
_r- 0.
L5,.c
. \
Orive
Shaft
Spud
:
'2
Loap
len51th: L90mm .
Measuring room:
Information
Oepartment
::::=:\::y
Dot.
: 20,.1·61
8E8.
Fig.5.12. Decay curves
at
10
mm
intervals recorded
on
a
490
mm
loop
divided into
four
sections marked
"75
dB 10
mm/see.",
"75
dB
30
mm/
see.",
"50
dB 10
mm/see.",
and
"50
dB
30
mm/see.".
When
one
of
these
four
combinations
of
RANGE POTENTIOMETER
and
PAPER SPEED has
been
employed
during
the
measurements,
the
reverberation
time
can be read
directly in seconds.
1.
The
Protractor
is
held
so
that
the
printing
is
readable.
The
proper
section
is
chosen
and
its left limiting line (thick diagonal)
is
placed
on
top
of
the
portion
of
the
recorded decay curve
to
be measured,
and
in
such a man-
ner
that
the
centre
of
the
Protractor
coincides
with
one
of
the
horizontal
lines
on
the
recording paper. See Fig.5.13.
2. Reverberation
time
in
seconds
is
then
read
on
the
scale
at
the
point
through
which
the
horizontal line passes.
The
decay curves should preferably be
approximated
into
a straight line
making it easier
to
determine
the
average slope.
If
paper speeds
other
than
10
and
30
mm/see. have been used,
the
deter-
mined reverberation
times
should be multiplied
or
divided
by
factors
of
10.
•
I
~
I
..
:
j:
·
e
··
------~'
Ii.
i
~~~j~:
..·c
.-,--·
..
~
:j:!.,,"!-.}-
iii •
Object
under
test
-1'700'37
FigA.2. Basic set-up
for
automatic recording
6. Select RECTIFIER RESPONSE
LOWER LlMITING
FREQUENCY
WRITING SPEED
PAPER SPEED
eg
10
mm/see.
7. Pull gear-Iever
marked
X
to
the
outer
position. (See Fig.4.3.).
The
paper drive speed
now
corresponds
to
the
small numbers
marked
around
the
PAPER SPEED knob.
8.
Two
types
of
recording can
be
made:
(a) Single
chart
recording
(automatic
recording over a length
of
250
mm paper
only),
(b)
Continuous
recording over
any
length
of
paper.
(a) Single Chart Recording;
Set
the
PAPER DRIVE switch
to
"start"
commencing
the
paper
to
run, which will
continue
until
the
built-in
automatic
stop
switch
declutches
the
drive mechanism (less
than
one
chart
length).
Reset recording
paper
by
finger wheel Z (Fig.4.3.) until
the
stylus rests
on
the
10
Hz line.
A
chart
of
250
mm length will
now
run
off
when
the
SINGLE
CHART
-CONTo RECORD
pushbutton
is
depressed
for
a
short
time
and
then
released.
(It
is
possible
to
stop
the
recording
at
any
time
by
setting
the
PAPER DRIVE switch
to
"stop").
34 19

Writi
ng
SpUd
\
Lo
wer
LirTItlng
FreqU
,
nC
y\ \
R.
cti
fl
" R
es
pons. \ . \ \
Potent
iom
eter RO
nqt
___
i -
Po
per Sp
ee
d
dB
Ra
ng
e Potenliometer
___
--
Drive Snoft
Speed
Loc
ki
ng
Knob
II
I • iii
fP
. Jt
:--
--
R
em
ote
Co
ntral
---
T\NO-C
honnel Seleetor
"""'
---
Dr
iv
e
Sho
ft n
... -
--
Drive
Snott r
",,-,--
~
..
-... -Geer l
eV
er X
l
--
Fin
ge
r Wheel l
Inp
ut
po
tentiometer
.J'j
"
16
f M '
Ref.
Vo
lto
ge
P
us-
hbutton
Fig.4.3. Leve! Recorder
2305
(b) Continuous Recording:
The
operator
should
follow
the
instructions
outlined
under
(a),
Single
Chart
Recording
except
that
to
start
the
recording it
is
necessary
to
press
the
SINGLE
CHART
-
CONTo
RECORD
push-button
and
turn
it clockwise. Recording will
now
auto-
matically
take
place until
the
push-
button
is
released again
and
the
PAPER
DRIVE
switch
is
set
to
"stop".
Note: Whenever
the
PAPER
DRIVE
switch
is
in
the
"
stop"
position
the
paper
drive
is
completely
controlled
by
the
SINGLE
CHART
-
CONTo
RECORD
push-button.
9.
In
order
to
synchron
ise
the
units,
stop
the
paper
so
that
the
stylus
rests
on
the
10Hz
Ii
neo
10. Depress
100
mV
reference
button
on
Leve1
Recorder
and
use INPUT
POTENTIOMETER
to
adjust
stylus
to
a
suitable
levelon
the
record-
ing Raper.
11. Set poin
ter
of
1022
to
1000 HL REF.
SIG
N..AL
and
engage magn
et
ic
clutch
by
use
of
clutch
switch.
The
un its will
then
be
synchronised
so
that
the
distance
between
the
10
and
20
Hz
marks
on
the
paper
Frequency Calibrated Paper
When
50
mm
wide paper
is
made
into
apaper
loop
495
mm long as in
Fig.5.10. (i.e.
two
chart
lengths
minus
5
mm
where
5 mm
is
the
distance
between
two
holes) it
is
possible
to
obtain
curves spaced
1/3
octave
apart
and
synchronised
with
the
frequency
calibrated paper as shown in Fig.5.11.
The
centre
frequency
of
a
particular
filter
is
represented by
the
small black
squares
at
the
top
of
the
paper
(OP
0424).
It
is
possible
to
keep
the
sound
pressure level fairly
constant
by
means
of
a
compressor
circuit
as shown in
Fig.4.1. so ensuring
that
the
decay
curves
commence
at
the
same revel.
Overlopping junction.
Fig.5.10. Making up
of
paper!oop
Non-frequency Calibrated Paper
When
more
spacing
than
5 mm
is
required
between
decay
curves
the
paper loop can be
made
490
mm long
to
give
10
mm
spacing as in Fig.5.12.
In
such
circumstances, however,
only
the
lined
paper
OP
0402
can be used
and
it
is
necessary
to
keep
check
of
the
frequency
at
which
each particular
curve
is
taken.
Waxed
paper
and
a
stylus
is
preferable for reverberation measure
ments
due
to
the
high
paper
speeds needed.
If
only
a few reverberation curves
are
needed
automatic
recording may
not
be necessary.
The
Oscillator
Stop
push-button
can
then
be used
and
the
filter switching
done
by
hand.
Use
of
the Protractor SC 2361
The
Protractor
has been designed
to
facilitate
the
determi
nation
of
reverbe-
ration
time
from
recorded
decay
curves
on
the
50
mm
width
paper. It
is
20
33

2113
2619+4145
f-
.!'~
'io
1
Remote
Controi
"'
..
':,.
~
'"
..
..
'.
..
'~-
.
iS
/Jock
'
:
-
e-
~
2113
JJ
0004
Fig.
5.
8. Set-up
for
the automatic recording
of
re
verberation time
2113
D2
Filter
Switch
01
Fig.5.9.
Frontal Connec!ions
1022
Ground o
(a)
o Ground
B'
2305
A2
Cam disc
OD
0059
1022
++
,
Drive
Sh f
SKfi
"n;",
f
~
TI
"'
""~,
At
I;c"
C3
Reguloting
Amplifier
Bli
B6
-:- +
:
2'V
Ground
~
11"o1~
(bl
Electrical connection
of
instrumentation
for
automatic
recording
of
re
verb
era
tion time
a) Connections between remote
control
plugs
b)
Electrical
circuit
for
remote
controI
corresponds
to
the
distance between
the
1000
Hz
REF. SIGNAL and
20
Hz
marks on
the
1022.
12. Depress
1000
Hz
REF.
SI
G
NA
L
button
and
adjust
the
output
level
fram
the
1022
and/or
the
INPUT
ATTENUATOR
of
the
Level Re-
corder
so
that
the
stylus deflects
to
somewhere in
the
middle
of
the
paper
.
.' Continuous Recording
with
ten Times Enlarged Paper Speed
The
following
method
is
adopted:
Set
the
"1
:10 Synchronizing Gear
Lever" in its inner position (released).
The
paper drive speed
then
corres-
ponds
to
the
large numbers marked
around
the
PAPER SPEED knob.
Re-
cording on
frequency
calibrated paper
is
not
possible
in
this
position.
The
start
and
stop
of
the
recording will
in
this
case be
completely
controlled
by
means
of
the
PAPER DRIVE switch.
G.
REMOTECONTROL
Several forms
of
remote
contra
I are possible with
the
1022.
A diagram
showing
the
connections
of
the
Remote
Contra
I plug
is
shown in Fig.4.4.
Oscillator
stop
InternaI
contactOd
oc
e o b External Modulation
O O
f a
Ground Mognetic Clutch
17
0 0
"38
Fig.4.4. Remote
ControI
Plug viewed external/y
32
21
Other manuals for 1022
1
Other BRUEL & KJAER Power Tools manuals
Popular Power Tools manuals by other brands

Scheppach
Scheppach Arbo Translation from the original instruction manual

Precision matthews
Precision matthews PM-727M manual

Grizzly
Grizzly G4017 instructions

EINHELL
EINHELL RT-MG 200E Original operating instructions

CAMPAGNOLA
CAMPAGNOLA STAR 30 F quick guide

EINHELL
EINHELL TP-CD 18/50 Li operating instructions