DeNovix CellDrop FL User manual

December 2019

2
1.!Introduction 3!
Product Technology 3!
Key Features 3!
Optics 3!
2.!Set-up and Safety 4!
3.!Quick Guide 6!
Cell Count Procedure 6!
Best Practices 7!
4.!General Operation and Software Information 8!
Top Action Bar 8!
Software Icons and Buttons 9!
Chamber Height Options 9!
Data Storage 9!
5.!Count Apps 10!
Channels 10!
Count Apps 10!
Brightfield 10!
Trypan Blue 10!
AO 10!
PI 11!
AO/PI 11!
GFP 11!
Yeast 11!
Custom Methods 12!
6.!Count Tab View 13!
Sample Name and Sample Information 13!
Image Controls 13!
Dilution Calculator 14!
Count Button 15!
7.!Count Settings 16!
8.!Results Tab View 18!
Optimize Settings 18!
Next Count 18!
Cell Size Gating 19!
Intensity Gating (GFP app only) 19!
Action Bar Controls 19!
Results View 20!
9.!Export and Print Options 22!
Screen Capture 22!
Export 22!
10.!Utility Apps 23!
User Accounts 23!
Data 24!
Count Codes 25!
Calculator 25!
Timer 25!
Settings 25!
Updater 27!
Screenlocker 27!
Diagnostics 27!
11.!Troubleshooting and Maintenance 27!
Quick Help 27!
Software Errors 28!
Cleaning 28!

3
12.!Customer Support 29!
Warranty 29!
1. Introduction
Product Technology
DeNovix CellDropTM Cell Counters are compact instruments with integrated processors and high-
resolution touch screens. The software utilizes application specific icons along with a custom
operating system to provide an intuitive, easy-to-use instrument for cell count measurements.
The pre-configured app settings are factory optimized for ease of use. The software allows the user to
customize settings when needed to meet lab specific workflow preferences.
The CellDrop uses three chamber heights to enable cell counts over a wide dynamic concentration
range according to specifications. This innovative, patented technology (US 10,302,568) along with
user-defined protocols allows users the flexibility required for today’s cell culture workflows.
This User Guide is designed for both CellDrop BF (Brightfield only) and CellDrop FL (Dual
Fluorescence plus Brightfield) owners. Several applications and software features are only applicable
for instruments with Fluorescence mode (CellDrop FL) and do not apply to the CellDrop BF.
Key Features
• No consumable slides required
• Stand-alone (no PC required) with integrated processor and Hi-Definition 7-inch touchscreen
• Live preview of sample and immediate, on-screen analysis of count result
• Custom software interface with intuitive EasyApps®
• Variable chamber height to enable an accurate count for a broad range of cell population
densities
Optics
Brightfield
• Illumination = LED 530 nm
Fluorescence
• Excitation: 470 nm +/- 20 nm
• Green Fluorescence Emission: 525 nm +/- 25 nm
• Red Fluorescence Emission 645 nm +/- 37 nm
Upgrade Options
CellDrop instruments may be upgraded at any time. Contact DeNovix or your distributor if you are
interested in converting from:
• Pay-As-You-Go to Unlimited
• CellDrop BF (Brightfield only) to CellDrop FL (Dual Fluorescence plus Brightfield)

4
2. Set-up and Safety
1. Remove all packing materials including materials protecting the arm, sample surfaces and the
protective cover on the screen.
2. Place the instrument on a flat bench and avoid vibrations to ensure optimal performance.
3. Plug the unit into a 100-240 VAC, 50-60/Hz receptacle using the grounded power supply
(GlobTek, Inc. part number TR9CE3000C95CP-NR6B, 12V / 3A / 36W) included with each unit.
4. Toggle the power switch to the On position to turn on the instrument. To complete initialization,
ensure that the arm is down and no materials are between the sample surfaces. The operating
system will boot up in less than a minute. Toggle the power switch to Off to initiate shutdown
the instrument.
Biological Hazard Safety
Trypan Blue, Acridine Orange, Propidium Iodide and other reagents are known hazardous materials.
Consult Safety Datasheets (SDS) for these assays prior to use.
Biological samples such as tissues and bodily fluids of humans and other animals have the potential
to transmit infectious diseases. Follow all applicable local regulations. Wear appropriate personal
protective equipment (PPE). Read and follow the guidelines in this User Guide, in the SDS for any
chemicals in use and additional biosafety publications applicable for the types of sample used and
institution/region of use.
Instrument Connectivity
The CellDrop comes equipped with Wi-Fi, Ethernet, HDMI and three USB ports. The USB ports are used
to facilitate data transfer to a FAT32 formatted USB storage device and support the use of an Opticon
OPI 3601 USB barcode reader. USB mouse and keyboard devices may also be used with CellDrop
Series instruments. The CellDrop does not support printers connected directly to the device via USB.

5
Cautions
DO NOT REMOVE COVER: No operator serviceable components inside. Refer servicing to qualified
personnel. CellDrop Cell Counters are designed for indoor use under the following conditions:
Temperature: 15˚ to 35˚ C Humidity: 35 to 65 %
Use only the power supply provided with the instrument. Use of the instrument in any manner not
specified by the manufacturer may impair the protection provided by the supplied power cord and
power supply.
NE PAS OUVRIR L’APPAREIL.
Aucun composant réparable par un utilisateur est inclus. Confiez l'entretien à du personnel qualifié.
Le CellDrop est conçu pour une utilisation en intérieur dans les conditions suivantes :
Température : 15° à 35˚C Humidité: ........35 à 65%
Utilisez uniquement le bloc d'alimentation inclus avec l'instrument. Utiliser l’appareil dans des
conditions non spécifiées par le fabricant peut compromettre la protection offerte par le cable
d’alimentation et le bloc d'alimentation fournis avec l’appareil.
VCCI (Class B) compliance statement for users in Japan:
This is a Class B product based on the standard of the Voluntary Control Council for Interference
(VCCI) from Information Technology Equipment. If this is used near a radio or television receiver in a
domestic environment, it may cause radio interference. Install and use the equipment according to the
instruction manual. This equipment has been tested for radio frequency emissions and has been
verified to meet CISPR 22.2 Class B.
A
B
C

6
3. Quick Guide
Cell Count Procedure
1. Launch a Count app.
2. Lower arm to start live preview. Check to ensure that the field of view is clear.
3. Select a protocol.
Optional: Enter sample name and additional sample info.
Optional: Edit the Protocol Count Settings for the sample being measured. Check that the
protocol includes the correct Dilution Factor.
4. Mix the sample well. Load the sample volume indicated on the Count button. Slide the pipette
tip along the alignment groove until it rests against the top surface. Dispense the sample into
the counting chamber formed between the upper and lower sample surfaces.
5. Allow the cells to settle.
6. Touch the focus icon and then adjust while viewing the Brightfield channel. Live cells should
have a bright center and a dark outline. The image below on the left is correctly focused. The
image on the right is out of focus.
7. Adjust Trypan Exposure: Touch the exposure icon and select Normal or Low exposure. Live
cells should have a white center with a dark ring like the image below on the left. The middle
image is overexposed and the right image is underexposed.
8. Fluorescence Exposure: Select the green or red fluorescence channel. Touch the exposure icon
and then adjust the setting. The fluorescence signal should not extend outside of the
boundaries of the cell when viewed in brightfield. The image on the left is correct. The middle
image is overexposed and the right image is underexposed. Adjust the exposure for each
channel independently.

7
9. Press Count.
10. Review the result.
Optional: Adjust gating to exclude debris or alternative cell populations from analysis.
Optional: Press Optimize Settings to adjust count settings and reanalyze the image(s).
11. Once a measurement is complete, lift arm and wipe away sample with a clean, dry laboratory
wipe and close the arm. When the arm is lifted, the result is immediately saved. Pressing Count
again prior to lifting the arm will overwrite the previous result for that sample.
12. Results from the active measurement session may be viewed while the app is open or viewed
later using the Data app. Saved results may be reanalyzed if desired.
13. Export results as desired.
Best Practices
Note: See Technical Note 186 – CellDrop Best Practices for additional details.
• Ensure that surfaces are clean prior to loading a sample into the sample chamber.
• If a previous sample has dried on the surfaces or if the sample is not loading easily, clean the
sample surfaces. Lower arm and pipette 15 uL of 70% ethanol into the alignment groove and
sample chamber. Wait 10 seconds then firmly wipe both upper and lower surfaces with a dry
laboratory wipe.
• Vortex samples before loading.
• Ensure that all sample concentrations fall within concentration limits of the instrument for
accurate results.
o Use the appropriate protocol settings for Chamber Height when measuring high or low
concentration samples or when using slides.
• Avoid introducing air bubbles into the sample solution when mixing or dispensing samples.
• Avoid drawing sample back into pipette tip after dispensing.
• Refer to DeNovix Assay protocols or other manufacturer guidelines for assay specific
instructions.

4. General Operation and Software Information
CellDrop Automated Cell Counters include pre-installed EasyApps software for rapid counting and
viability assessment. Each app is designed for a common cell counting technique such as
Brightfield, Trypan Blue, AO/PI, etc.
Apps include a common Top Action Bar that allows a user to easily navigate between the live
preview on the Count tab and the Result tab. Controls available from the action bar are described
below.
Top Action Bar
• Count Tab: Select to view a live preview on screen. View the loaded sample, select saved
protocols, edit protocol settings, define dilution guidance parameters and initiate a cell
count.
• Results Tab: This tab enables the user to review the data for all samples measured in the
current measurement session.
• Alert: The alert icon (bell) is displayed to notify the user of system alerts such as timer
expiration or low count alerts (Pay-As-You-Go models).
• Account: The current account in use is displayed on the top action bar. The General account
is the default account for CellDrop applications. Tap the account name to display a list of
available accounts. Changing an account will automatically use the protocol indicated as the
default option selected in the User Accounts app.
• Home Icon: Tapping the Home icon will navigate back to the Home screen and close the app
and current measurement session. All previous results are saved and accessible from the
Data app.
• Overflow: The Overflow icon is used to access a menu of screen specific options:
o Screen Capture: Screen shots may be taken of most but not all views. Refer to the Export
and Print Options chapter for more information.
o Count Code Log (PAYG models only): Displays a log of count code use.
o Tech Support: Sends an email with diagnostic information to DeNovix. Email must be
preconfigured from the Settings app for this function to work correctly.
o Set Focus: Allows the user to save a global focal position for DirectPipette mode or for
slide mode. This position is the initial position used when opening a count application
and essentially eliminates the need to adjust focus once set for CellDrop.
o About: The About feature brings up an information box displaying the current app version
number.
9
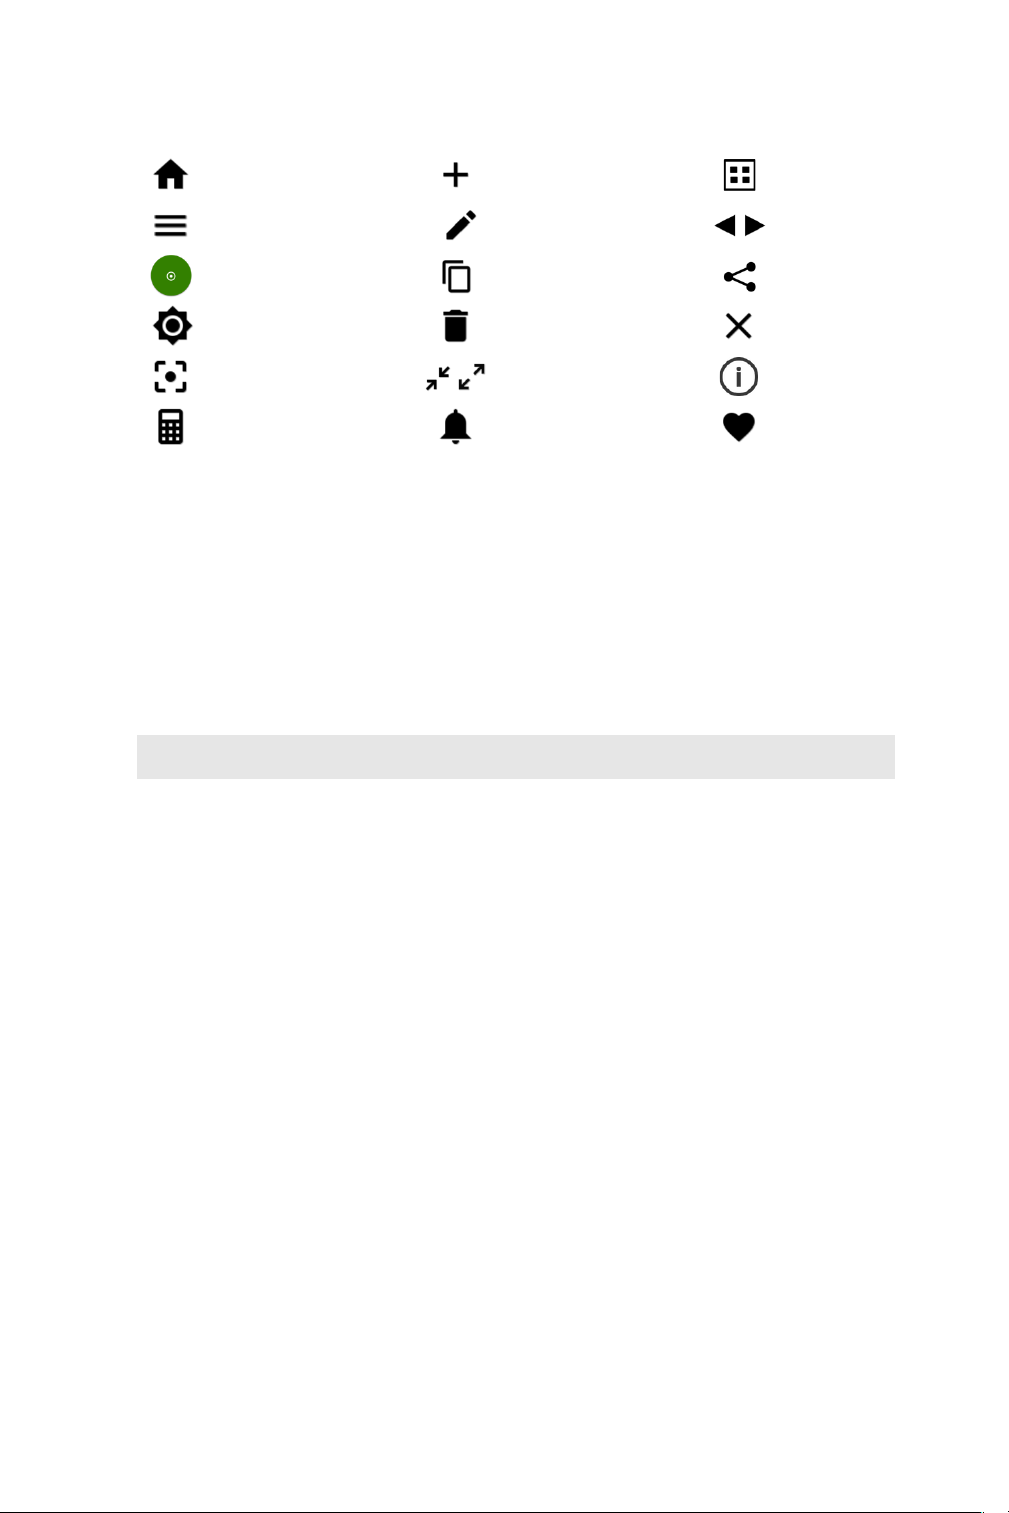
Software Icons and Buttons
CellDrop applications include a set of standard icons and buttons used throughout the software.
The following table defines each button.
Home
Add
Select All
Overflow
Menu
Edit
Increase /
Decrease
Count
Copy
Export
Exposure
Delete
Clear Selected
Focus
Expand /
Collapse
Information
Calculator
Notifications
Favorite
Chamber Height Options
CellDrop Cell Counters use three chamber heights to enable measurements over a wide cell density
range. The 100 um chamber height is equivalent to the 0.1 mm depth used on standard
hemocytometers.
The default chamber height is 100 um and is suitable for most counts. Users may choose a different
chamber height based on the anticipated density. The upper surface position is automatically moved
to the position defined in the protocol. The table below is a guideline of the best chamber height to
choose based on the density of the sample.
Gap Height
Required Volume
Minimum Density
(cells/mL)
Maximum Density
(cells/mL)
400 um
40 uL
7 x 10²
1 x 10⁵
100 um
10 uL
5 x 10⁴
1 x 10⁷
50 um
5 uL
1 x 10⁷
2.5 x 10⁷
Data Storage
CellDrop models include a solid-state drive with 120 GB or more of storage capacity, sufficient for
several thousand results. The user will be alerted if the memory approaches capacity. Data may be
deleted from the CellDrop at any time from the Data App. If the limits are exceeded, old data will be
automatically deleted on a first-in, first-out basis.
Display Sleep
The backlight for the screen will automatically turn off after a user-defined period of inactivity. Touch
the screen to turn it back on. Adjust the Sleep Time from Display section in the Settings App.
Preview Suspend
The CellDrop live preview on the Count screen is suspended if the arm is left in the down position for
longer than two minutes. The user may resume the preview when desired.

10
5. Count Apps
Count apps are designed for a common cell counting techniques such as Brightfield, Trypan Blue,
AO/PI, etc. To properly count a sample and optimize a result, the researcher must first capture the
best image(s) possible. Examples of proper and improper adjustments are included in this guide in
Section 6, Count Tab.
!
Protocols and Optimizing Settings
Each Count app includes the relevant group of count settings saved as a Protocol. Once a sample has
been counted, protocol parameters can be adjusted using the Optimize Settings button..
Channels
Count apps use an application specific set of optical channels. The CellDrop FL model includes
Brightfield, Green Fluorescence and Red Fluorescence channels. The CellDrop BF model includes
Brightfield only.
Channel
Brightfield
Trypan
Blue
AO/PI
AO
PI
GFP
Yeast
Custom
Methods
Brightfield
✔
✔
✔
✔
✔
✔
✔
✔
Green
Fluorescence
✔
✔
✔
✔
✔
Red
Fluorescence
✔
✔
✔
✔
Count Apps
Brightfield
The Brightfield app is used for quick, label-free total cell or particle counts. A brightfield count does
not determine cell viability. This app will count cells with a bright, white center and a defined border.
The application is not designed to count dark, solid objects.
Trypan Blue
Trypan blue is a cell membrane impermeable dye that only enters cells with compromised
membranes. Upon entry, the dye binds to intracellular proteins resulting in bluish colored cells. The
trypan blue exclusion assay enables a direct counting of live (unstained) and dead (stained) cells.
Published literature suggests that using trypan blue for samples with viabilities less than 70% may
result in higher reported cell viability values when compared to fluorescent-based detection methods.
% Viability =(Live Cell Count / (Live Cell Count + Dead Cell Count)) *100.
AO
The AO app uses green fluorescence images to count live nucleated cells.
Acridine orange is a nuclear staining cationic fluorescent dye that enters live and dead cells and
interacts with DNA and RNA by intercalation or electrostatic attractions. When bound to DNA, it is
spectrally very similar to fluorescein, with an excitation maximum at 502 nm and an emission
maximum at 525 nm.
Although AO enters dead cells, the intensity of the green fluorescence is very low for these cells
compared to the green fluoresce emitted from live cells. This app may be useful when counting
solutions containing either red blood cells and/or significant cellular debris.

11
The % cell viability is not provided when using this app.
PI
The PI app uses brightfield images to capture live cell counts and red fluorescence images for
counting dead cells.
Propidium iodide (PI) is a red-fluorescent nuclear and chromosome stain that only enters dead cells.
Upon entry, the PI stain binds to DNA by intercalating between the bases with little or no sequence
preference. In aqueous solution, the dye has excitation/emission maxima of 493/636 nm. When
bound, the excitation/emission maxima shift to 535/617 nm respectively.
Calculation:
% Viability =(Brightfield count / (Brightfield count + PI count)) *100.
AO/PI
The AO/PI App uses green fluorescent images to capture live nucleated cell counts and red
fluorescent images for counting dead cells. The application is suited for counting cell culture samples
or primary samples.
Acridine orange (AO) and propidium iodine (PI) are both cell permeable nuclear dyes that in
combination are used to count live and dead cells within a cell solution. The AO enters both live and
dead cells and results in green fluorescing cells. PI enters only dead, nucleated cells with
compromised membranes to generate red fluorescence. Cells stained with both AO and PI fluoresce
red due to fluorescence resonance energy transfer (FRET).
% Viability =(AO count / (AO count + PI count)) *100
GFP
The GFP App uses green fluorescent images to count GFP transfected cells and brightfield images to
count non-transfected cells
As GFP intensity can be highly variable it is recommended that the fluorescent threshold is set for
each sample after the count using the intensity slider in the results screen.
The green fluorescent protein (GFP) isolated from the Aequorea victoria jellyfish is a useful
reporter molecule for monitoring gene expression. GFP emits green light (lambda max = 509 nm)
when excited with UV or blue light resulting in cells that fluoresce green.
The GFP app is used to determine transfection efficiency of transient transfections.
% Efficiency =(GFP+ count / (GFP+ count+ Brightfield count)) *100
Yeast
The Yeast App uses green fluorescent images to capture live yeast cell counts and red fluorescent
images for counting dead yeast cells.
Yeast cell live/dead staining Is performed using fluorescein diacetate (FDA) and propidium iodide (PI).
FDA freely moves in and out of the plasma membrane of diverse organisms from bacteria to
mammalian cells. The non-fluorescent FDA taken up by cells is converted the into the green
fluorescent metabolite fluorescein. The green fluorescence is used as an indicator of live cells. PI
enters only nucleated cells with compromised membranes to generate red fluorescence indicating
dead cells.

12
Note: Yeast cells are smaller than typical mammalian cells and may take a little longer to settle into
position.
% Viability =(FDA count / (FDA count+ PI count)) *100
Custom Methods
The Custom Methods app allows users to count cells using brightfield, green fluorescence or red
fluorescence techniques. The application is intended to provide users with the tools to conduct
experiments using any of the available measurement channels.
13
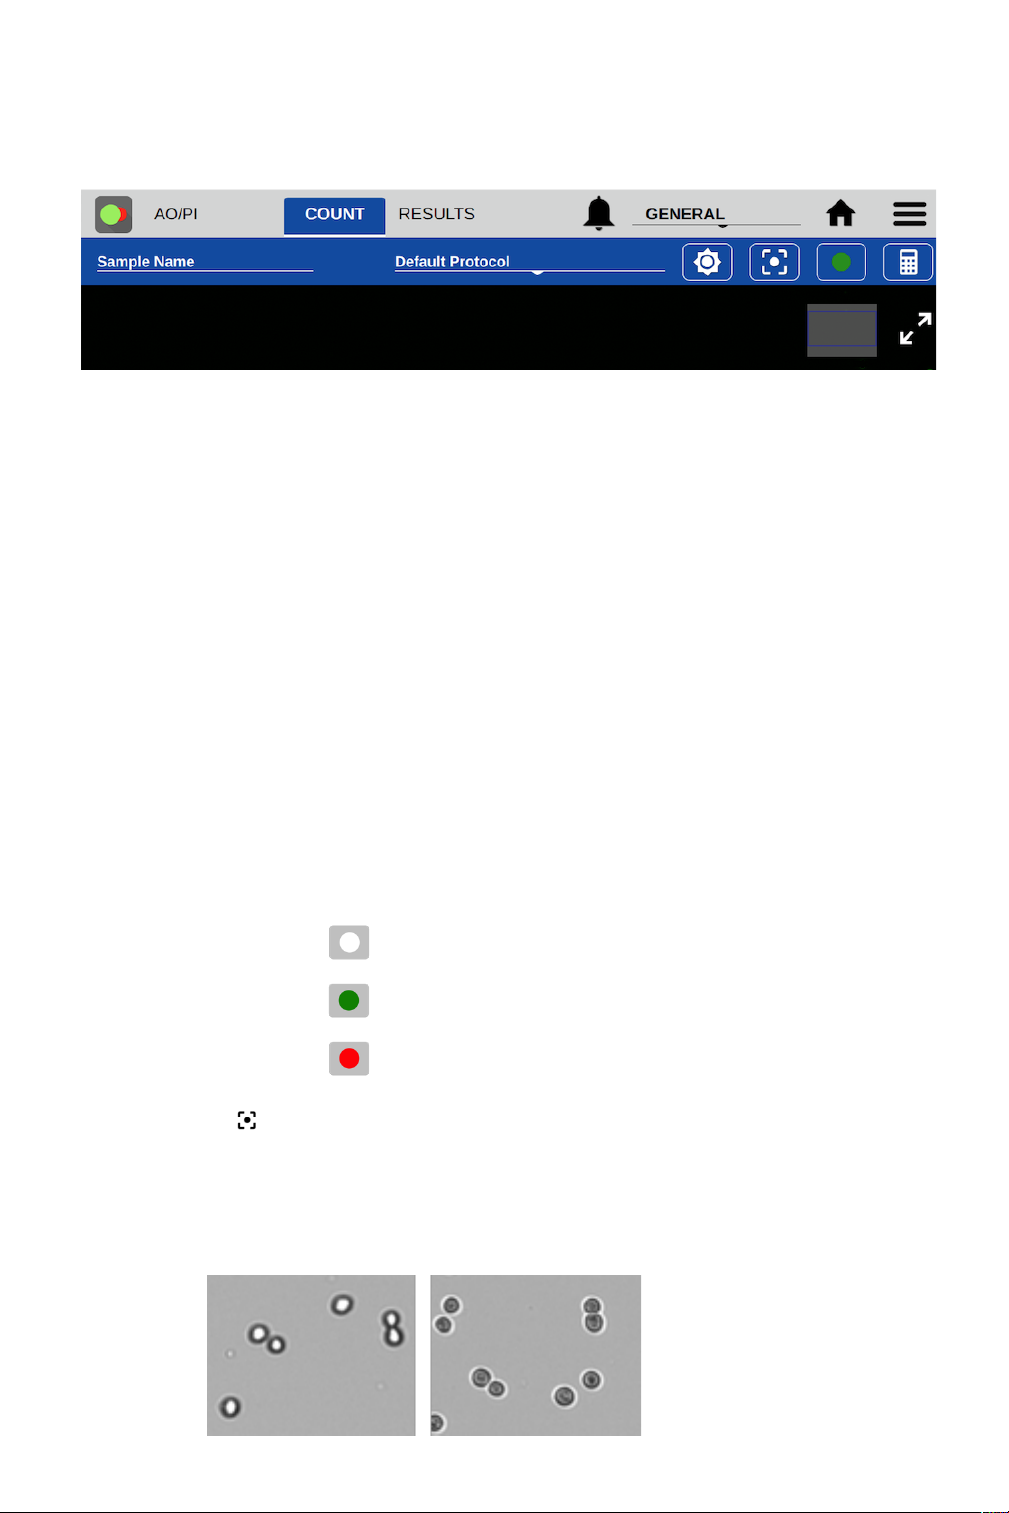
6. Count Tab View
From the Count tab, users can preview the live image, input sample information, select the protocol
for counting, adjust the image and initiate the cell count.
Sample Name and Sample Information
• Tapping the Sample Name field will bring up the Sample Information dialog. An optional
sample name, short description and a passage number may be entered. This information is
saved with the count result.
Protocol Selector
• Protocols allow the user to adjust and save count settings within each application. Count
settings are the screening criteria used by the counting algorithms such as diameter,
roundness and threshold. See Section 7 - Count Settings for details
• Each app opens to the Default Protocol, suitable for counting most mammalian cell lines
within this application. Users may set a custom protocol as their default in the User Accounts
app.
Image Controls
• Channel Selector: For the CellDrop FL model, use the Channel Selector to switch between
brightfield and fluorescence preview channels. Within fluorescence apps, the icon indicates
the active channel. Tap the icon to select a channel. CellDrop BF units and brightfield
applications (Brightfield, Trypan Blue) only include the brightfield channel.
Brightfield
Green Fluorescence
Red Fluorescence
• Focus : The focus controls may be used when previewing any Count screen channel
(brightfield, green or red fluorescence). Changing the focus when viewing one channel will
automatically changes the focus of the other channels. Use the arrows to change the focus.
o Adjust focus while viewing the brightfield channel. Live cells should have a bright center
and a dark outline. The image below on the left is correctly focused. The image on the right
is out of focus.

14
• Exposure : Touch the exposure icon to display the exposure control in the Trypan app or for
fluorescence channels. The control is not required for brightfield counts which use a preset
value.
o Trypan Blue app: Choose the correct exposure based on the concentration of trypan dye
used.
§ If the assay is 0.4% trypan dye mixed 1/1 with cell suspension, select Normal
§ If the assay is 0.2% trypan dye mixed 1/1 with cell suspension, select Low
§ Live cells should have a white center with a dark ring like the image below on the
left. The middle image is overexposed and the right image is underexposed.
o Fluorescence Apps: Select a fluorescence channel. Touch the exposure icon to open
the exposure settings. Tap the arrows to adjust. The fluorescence signal should not extend
outside of the boundaries of the cell when viewed in brightfield. The image on the left is
correct. The middle image is overexposed and the right image is underexposed. Adjust the
exposure for each channel independently.
• Zoom Controls: All preview and result images on the CellDrop support zoom and pan
capabilities. Pinch and zoom using two fingers to zoom in or out. Tap and drag within the with
the image to move the preview location.
• Image map: A small position map in the top right is an indicator of what portion of the full
image is currently displayed on the screen.
• Expand/Collapse : Tapping the expand or contract icon for a preview or result will toggle
between a full screen view and the standard view.
Dilution Calculator
The dilution calculator enables the user to define target cell number or density and culture volume.
The counted result will automatically provide instructions to correctly dilute cultures to reach the
desired target.
• Tap the calculator icon to set dilution guidance parameters for the next sample count.
• Setting targets is optional for any specific count. Inputs may be added or modified post
measurement from the Results tab Calculator screen.
• Once targets are set, they will stay in effect for all subsequent sample measurements within a
session until changed.

15
• When applied, the inputs are used to generate the dilution guidance presented under the
Single Sample view as well as the Results tab Results List view when the Show Dilution
Guidance box is checked.
Count Button
• The Count button initiates a measurement.
• The required volume of sample is displayed on the Count button.

16
7. Count Settings
Each Count app includes an applicable group of count settings saved within protocols. Count settings
may be adjusted prior to a count. A subset of the parameters can be also adjusted after a count to
optimize a result.
• Cell Outline
o Enhanced Outline - Draws an outline around the identified cell boundary (recommended).
o Circle Outline - Marks each counted cell with a circle. The outlined image will be rendered
more quickly.
• Sample Mode
o DirectPipette - This is the default mode and is used when samples are loaded directly into
the CellDrop sample chamber.
o Slide - Choose this option when applications require cells to be contained in a slide while
counting.
• Chamber Height:A unique feature CellDrop Cell Counters is an adjustable chamber height
that allows for a greater dynamic range than any slide-based counter on the market. The
default chamber height is 100 µm and is recommended for most counts. For very low density
samples, choose 400 µm. For very dense samples, select 50 µm. The table below includes
guidelines.
Gap Height
Required Volume
Minimum Density
(cells/mL)
Maximum Density
(cells/mL)
400 um
40 uL
7 x 10²
1 x 10⁵
100 um
10 uL
5 x 10⁴
1 x 10⁷
50 um
5 uL
1 x 10⁷
2.5 x 10⁷
• Small Cell Mode: Small Cell Mode can improve brightfield channel counts of small cells near
the 4 um limit of detection. The additional algorithm complexity increases the length of the
analysis.
• Dilution Factor: This value is applied to the cell count when calculating cells/mL to account
for any dilutions or reagents added to the sample. The Dilution Factor is the ratio of the total
assay volume to the volume of cell suspension in the assay. Enter the proper dilution factor to
calculate the correct cell density.
o Example Dilution Factor calculations:
§ For pure cell suspensions, the Protocol Dilution Factor = 1.
§ For a mixture of 5 uL of assay working solution to 5 uL of cell suspension, set
Dilution Factor = 2.
§ For a mixture of 8 uL of assay working solution to 2 uL of cell suspension, set
Dilution Factor = 5.
• Diameter (um):The Diameter settings specify the size range of objects to seek during a
count. The algorithm rejects and does not process objects below the minimum size or above
the maximum limits. The limits define the boundaries of the data set, graphs and histograms.
The total allowable range is 2-400 um.
o Minimum Diameter - This setting defines the diameter of the smallest objects to be
counted. The proper value ensures that cellular debris will not be counted. Increase this

17
setting when counting larger cells if they are being counted as multiple smaller cells.
Decrease if small cells are not being counted.
o Maximum Diameter - Objects above the maximum diameter will not be counted. Adjust the
maximum diameter to provide a realistic size band to analyze during counts. If clusters of
cells are being counted as a large individual cell, reducing the maximum diameter to reflect
the true cell size will improve the results.
• Roundness: CellDrop uses Roundness settings to identify cells based on morphology. The
higher the roundness, the more round and completely outlined a cell must be to be included in
the count. Reducing the roundness setting allows more elliptically shaped cells, irregularly
shaped cells or cells with incomplete structures to be counted. If single cells are counted as
multiple cells or artifacts are counted, increase the roundness setting. If cells are not counted,
decrease the roundness.
o Brightfield Roundness - Used for Brightfield counts.
o Live Roundness - Used in apps counting live cells.
o Dead Roundness - Used in apps counting dead cells.
o Green Roundness - Used in the Custom Methods app for the green fluorescence channel.
o Red Roundness - Used in the Custom Methods app for the red fluorescence channel.
o FL Roundness - Used in the GFP app to count fluorescing cells.!
• Threshold: The CellDrop Series uses Threshold settings to evaluate each counted cell to see if
it is above the intensity criteria set in the protocol. The higher the threshold is, the greater the
intensity must be to be included in the count.
o Stained Threshold - Used in the Trypan Blue app to determine if a cell is dead or alive. The
higher the setting, the darker a cell must be to be counted as dead. If dead cells are not
being counted, decrease the threshold. If live cells are being counted as dead, increase the
threshold value.
o Green Fluorescence Threshold - Used in apps that count cells using the green
fluorescence channel.
o Red Fluorescence Threshold - Used in apps that count cells using the red fluorescence
channel.
o Decrease the fluorescence threshold if cells that are positively stained are not being
counted in the analysis and vice versa.

18
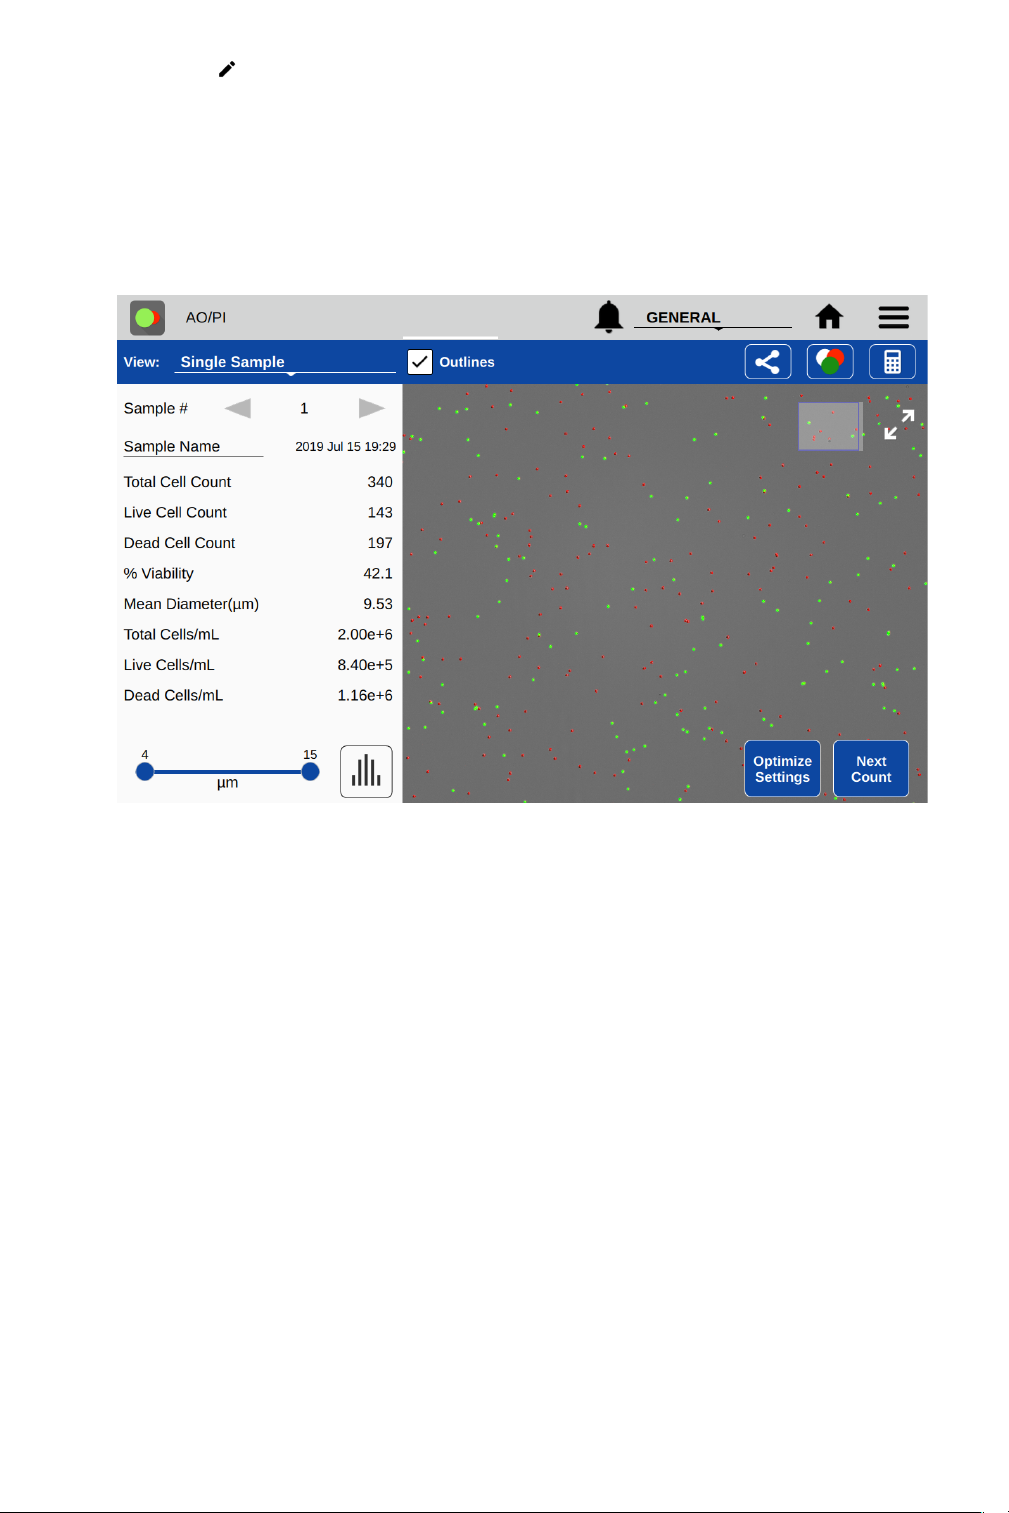
8. Results Tab View
Optimize Settings
• Once a sample has been counted, a subset of the protocol parameters can be further adjusted
to optimize the result. Press the Optimize Settings button, adjust settings and then press
Count with Current Settings to reanalyze the existing image(s) using the new settings. Users
have the option to save the adjusted settings to a protocol if desired.
Next Count
• This button changes the view back to the Count tab and starts a live preview. The previous
result is not saved until the user raises the arm. If the Count button is pressed without raising
the arm, the previous count will be overwritten. To capture a new result of a new sample, raise
the arm, clean the upper and lower sample surfaces, lower the arm then load the next sample.

19
Cell Size Gating
• Use the on-screen sliders to adjust the size range of interest for the current sample. Cell
outlines and count results are updated in real time. Gate to exclude debris or alternative cell
populations from analysis. Press the Histogram button to graphically view cell size
distribution and apply gating. Press Apply Gating to Result to update and save the result.
Intensity Gating (GFP app only)
• In the GFP app, users may gate cells by size as well as intensity. Use the on-screen slider to
adjust the intensity gating from 0-100. The higher the number, the higher the intensity must be
for a cell to be included in the counted result. The intensity gating icon will open a graph
showing the intensity profile of the cell population.
Result Overlay Selector
Brightfield
Brightfield/ Green
Overlay
Green Fluorescence
Brightfield/ Red
Overlay
Red Fluorescence
Green/ Red Overlay
Brightfield/
Green/Red Overlay
Action Bar Controls
• View Selector: Use this drop down to access the various Results tab views including viewing a
list of multiple results. The Default selection is Single Sample view.
• Outlines: The checkbox is used to toggle on/off the outlines for counted cells for views that
include cell images.
• Export : Export results in .csv, .pdf, or .png formats via USB, Email and Network Printer.
• Image Selector: This icon indicates the overlaid images included in the result being viewed.
Tap the icon to change the overlay combination for the current sample or after optimizing
settings for a previous result.
• Calculator: Access the Dilution Calculator.
Additional Action Bar Controls
• Select/Deselect All : These icons enable all items in a list to be selected or deselected with
one tap of the icon.
20
• Edit : Highlight a single sample and then tap the edit icon to add or modify sample
information. Changes will overwrite the information stored in the database and will be applied
in all lists referencing the sample.
• Delete: Tapping this icon will delete the highlighted samples from all results lists.
Results View
• Single Sample
o Sample Number: The arrows on either side of the sample number are used to switch
between samples measured in the current session.
o Sample Name: This is an editable field. Changes will overwrite the information stored in
the database and will be applied to all lists referencing the sample.
o Results Panel: A table of results will be displayed in the Results panel. If dilution
parameters were provided at the time the count was initiated, then dilution guidance will
also be presented in the panel.
• Results List
o The list shows all samples counted in the current measurement session.
o When the Show Dilution Guidance box is checked, the dilution guidance is displayed with
each result in the list for which dilution information was entered.
• Image List
o The list displays all samples counted in the current measurement session.
o Cell Count: The sample cell count is presented in the table. This value automatically
updates whenever the results are recalculated due to a change in cell size limits or other
counting parameters.
• Graph
o Includes a summary of results to allow the user to select different charts to add.
Table of contents
Other DeNovix Laboratory Equipment manuals


