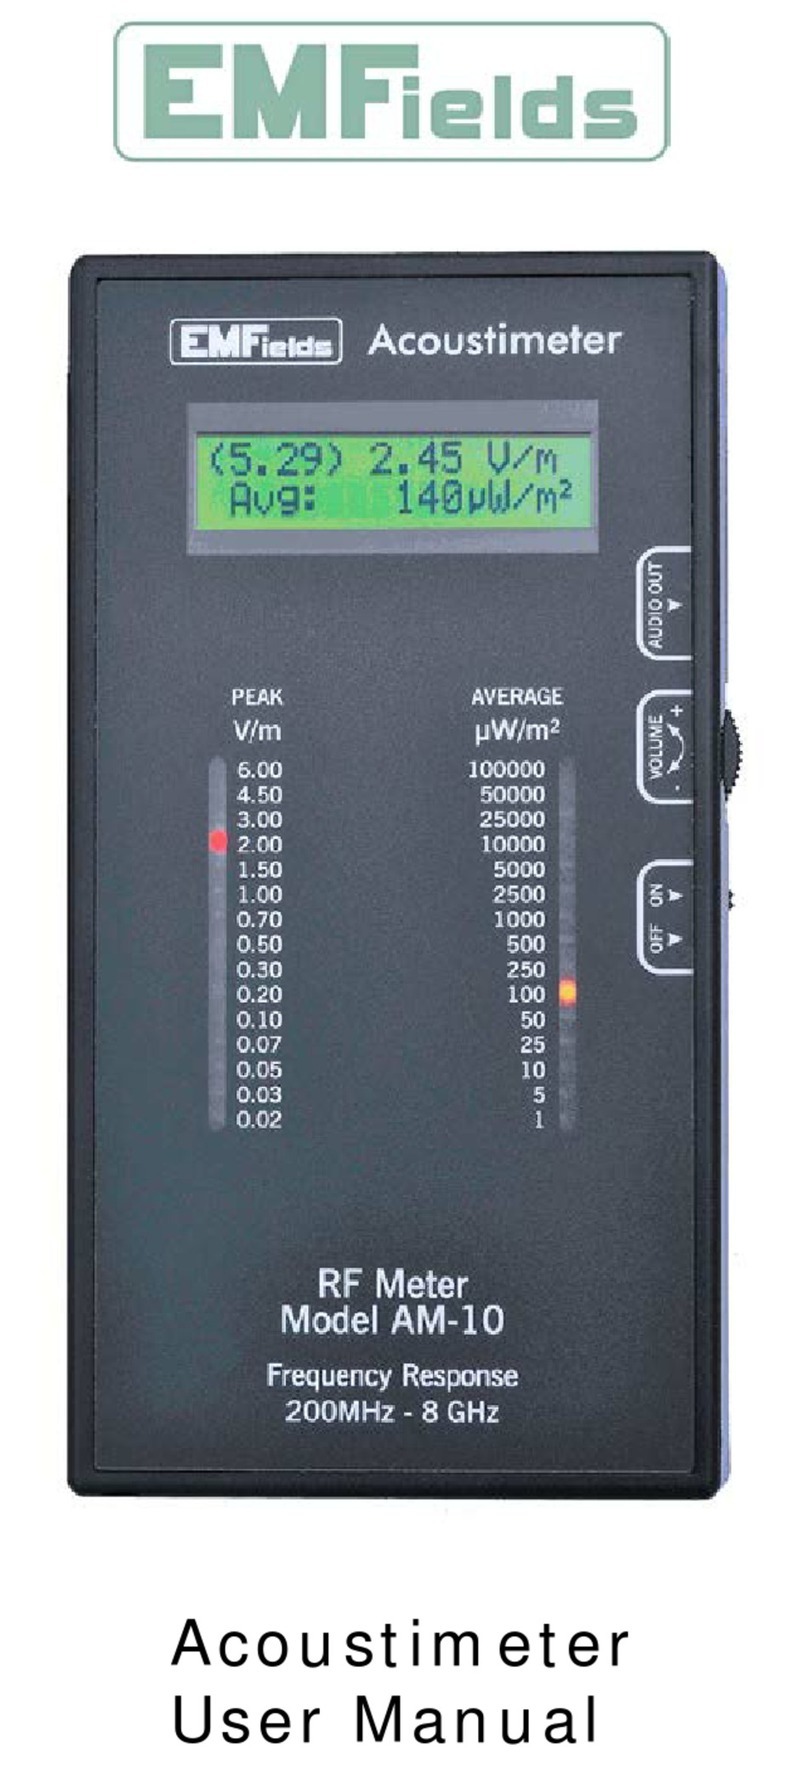
EMFields AM-11 User manual

add
front high-res photo
here
Acoustimeter User Manual

Safety Instructions
Please read through these instructions carefully
before operating the instrument. These contain
important information regarding usage, safety and
maintenance.
The instrument is not waterproof and should not be
used outdoors in the rain without extra protection.
If necessary, please cover the instrument with a
clear plastic bag that does not have holes in it.
Exposing the instrument to high temperatures or
dropping the meter on to a hard surface may cause
it to stop functioning properly.
The meter is sensitive and is intended to measure
typical modern environmental exposures.
Do not take it close to high power radiofrequency
transmitters or put it inside a microwave oven.
Clean the case using a damp cloth if necessary and
do not use chemicals.
This instrument is not intended to be serviced by the
user, nor does it need any special maintenance.
Unscrewing the case may void the guarantee.
While EMFields considers that the information and
opinions given here are accurate, you must rely
upon your own skill and judgement when making
use of the information contained in this manual.

3
Contents
Safety Instructions......................................................2
Technical Specifications .............................................4
Introduction ...............................................................5
Layout of the meter ...................................................6
Operation and use......................................................7
Setting up for first use........................................... 7
Taking measurements ........................................... 7
Audio ..................................................................... 9
EMFs – What to measure? ...................................... 10
What are EMFs? .................................................. 10
Electromagnetic spectrum guide ........................ 11
Guidance levels ....................................................... 12
Various exposures and effects ................................ 14
Why are there two different readings?............... 17
Digital and Analogue signals................................ 20
Typical real-life exposures....................................... 22
Troubleshooting ...................................................... 26
Warranty ................................................................. 28

4
Technical Specifications
Typical frequency response using the internal
antenna:
200 MHz – 8000 MHz ± 6dB ± 0.02 V/m
Measurement Range:
The LCD displays peak-hold, peak and average
values. Updated about 2.5 times per second.
Note: Peak Hold is reset/cleared using front button
Peak readings: 0.02 - 6.00 V/m
LED Scale: 15 levels, from 0.02 to 6 V/m
Updated 5 times per second.
Average readings: 1-100,000 µW/m2
LED Scale: 15 levels, from 1 to 100,000 µW/m2
Updated 3 times per second.
Note: 100,000 µW/m2equals 10 µW/cm2
The audio can be heard at levels below 0.02 V/m.
Power
Current: 100 to 150 mA at 3 volts
(2xAA 1.5V Alkaline or NiMH 1.2V rechargeable cells)
Battery Life is typically 15 hours (alkaline) and up to
25 hours (NiMH 2000+ mAh cells). ‘Low battery’ is
indicated.
Working temperature range -20 °C to +40 °C
Dimensions: 190mm x 102mm x 33mm.
Weight: 280g, 330g with batteries.

5
Introduction
The Acoustimeter will enable you to make quick and
informed judgements regarding radiofrequency (RF)
Electromagnetic Fields (EMFs) in your environment.
The Acoustimeter measures all RF EMF sources from
200 MHz to 8000 MHz (8 GHz) which, in practical
terms, covers most modern wireless communication
RF signals that you will be exposed to.
This includes mobile phone networks (2G, 3G, 4G,
5G*), local wireless networks such as WiFi (2.4 and 5
GHz), digital cordless phones (DECT), and many
other sources that will expose you to RF energy.
Readings are shown on both a 2-line OLED display
and two series of graduated LED lights. The LEDs
update rapidly, allowing you to quickly gauge the
levels in an area and find any hot-spots.
The Acoustimeter also feeds the detected incoming
signals to a loudspeaker which will help you to
determine what type of signal is being detected.

6
Layout of the meter
Key:
1. OLED Display
2. Peak signal LEDs
3. Average power LEDs
4. Volume controls (5 levels, - lower, + higher)
5. Clear (peak) hold button
6. Power button
7. Internal Antenna location
8. Loudspeaker
9. Battery compartment (for 2x AA cells)

7
Operation and use
Setting up for first use
Ensure that the 2 AA batteries are correctly installed.
Press the POWER button. The LEDs display a moving
pattern and the OLED displays a start-up screen:
“Acoustimeter
Initialising... ”
The audio is off at start-up. Change the volume in
pre-set stages by pressing the VOLUME + and
VOLUME - buttons.
Taking measurements
The instrument displays the peak signal strength
and the average power flux density (PFD) on both
the LEDs and LCD. We discuss what these mean in
the “Why are there two different readings?” part of
the next “EMFs – what to measure?” section.
It is important to remember that RF EMFs create
“hot-spots” due to reflections, so both the position
and orientation of the instrument is very important.
Moving the instrument small distances can result in
noticeable real differences in the detected levels.
To get the most accurate reading, slowly rotate the
instrument in each direction until you find the
highest reading, and then hold it still to take the
measurements.

8
Ideally hold the meter as shown in the picture. Try
to keep the Acoustimeter at least 30cm away from
your body when taking readings. Keep your hands
towards the bottom of the instrument.
If you wish, the Acoustimeter can also be placed
(preferably upright) on a surface.
We recommend taking the highest reading found
in any one spot, as this is when the antenna is
optimally aligned with the incoming signals.
The “Peak-hold” function will display the highest
peak reading measured until the instrument is
turned off and on again, or until the CLEAR (PEAK)
button is pressed.
When you have finished taking measurements, press
the POWER button again to turn the AM11 off.
The AM11 will turn itself off after 8 minutes of
inactivity to preserve battery.

9
Audio
The audio feature allows amplitude changes in the
incoming signals to be heard as audio, which can
help in determining the type and source of RF.
Many common EMF sources produce a distinct set of
sounds via the Acoustimeter, and so with a little
practice, you can soon learn to identify a source type
via audio. Some sound samples to help you identify
different signals are available on:
http://www.emfields-solutions.com/rf
Most modern digital EMF sources are “pulsed”,
meaning they have an amplitude-modulated signal.
However, some sources are not amplitude
modulated, including analogue sources, and these
will not produce much sound even with the volume
turned up. We explain more about this in the “Digital
and Analogue signals” section.
It is sometimes possible to hear voices and music
when close to powerful broadcast AM radio
transmitters. These are outside of the normal RF
frequency detection range of the meter, but they are
sufficiently powerful transmitters to be picked up.
When no LEDs are illuminated any regular very quiet
sounds should generally be ignored as they are due
to the internal functioning of the meter. However,
incoming pulsing RF signals can still
often be heard when the LCD is displaying readings
of <0.02 V/m and < 1 µW/m2.

10
EMFs – What to measure?
What are EMFs?
EMF is usually taken to mean “time-varying electro-
magnetic field” and cover an enormous spectrum of
different phenomenon. These include, but are not
limited to, “power frequency” fields (given off by any
AC electrical device), mobile communication signals,
TV and radio signals, military radars, infra-red, visible
light, ultra-violet, x-rays and gamma rays. We
provide a brief over-view guide on the next page.
Their interaction with the human body varies and
there are few clear correlations between frequency,
duration, exposure level and health effects, though
there is a great deal of peer-reviewed published
evidence of real effects at both high and low
exposure levels. Further research into each part of
the spectrum and different modulation types is still
required. It is almost certain that sensitivity to EMF
exposure varies from person to person.
Some electric and magnetic fields are part of the
natural environment that life on Earth evolved with.
High electric fields cause lightning and magnetic
fields from the Earth’s core allow compasses to
work. However, we have not evolved with the
enormous increase over the last 100 years in
radiofrequency exposure (see graphic on page 14),
and there is steadily mounting evidence that they
may cause unexpected adverse effects on health.

11
Electromagnetic spectrum guide

12
Guidance levels
The most widely used exposure guidance is written
by the International Commission on Non-Ionising
Radiation Protection (ICNIRP). Their guidance levels
are set to prevent tissue heating. This allows quite
high-level exposures and it states that it is not
intended to protect against cancer or any other low-
level reported adverse health effects as they do not
consider them to be adequately proven. The USA
FCC/IEEE guidance levels are similar in that they also
allow quite high levels of exposure.
Russia, China and various other countries have set
more restrictive guidance for environmental
exposures based on their interpretation of the
published scientific evidence.
The most comprehensive current overview of the
science came from an experienced group of 15
leading European health scientists and medics
(EUROPAEM 2016). They state these are for “the
prevention, diagnosis and treatment of EMF-related
health problems and illnesses”.
Other reviews and guidance are available including
the BioInitiative Reports; Bau-Biologie Guidelines;
International Guidelines on Non-Ionising Radiation
(IGNIR), which was produced by a UK group as a
practical guide to implementing the EUROPAEM
guidelines. The graphic on the next page puts all of
these in context with typical real-life exposures.

13

14
Various exposures and effects
The graphic on the next page shows the guidance
levels along with a selection of peer-reviewed
scientific reports that show adverse effects at
relatively low exposure levels.
The EUROPAEM Guidance also has an even lower
guideline for electrically sensitive people (ES, EHS)
which is below 1 µW/m2 (0.02 V/m) for modern
communication signals. This is difficult to achieve in
our modern world that is now extremely polluted
with pulsing UHF RF signals.
For each of the studies, the solid red part of the bar
indicates exposure levels were statistically significant
effects were found. The cross-hatched area is based
on the assumption that these higher levels will
continue to exhibit the effects, but were not directly
examined and tested as part of the research.
For further information about the interaction of EMF
and RF with life (people and animals) a good source
is the BioInitiative Report. This was produced by
some of the most highly experienced EMF/RF bio-
effects researchers in the world. It can be read and
downloaded here: www.bioinitiative.org
We will also be maintaining up-to-date links with
more information on our website:
www.emfields-solutions.com/info

15

16
The Acoustimeter is designed specifically to measure
the mostly used radio frequency (“RF”) part of the
spectrum where our exposure has increased by an
incredible amount over recent years and where
most of the reported health-related concerns exist.
Modern wireless communication frequencies (in the
range from about 100 MHz to over 10 GHz) virtually
did not exist on Earth just 100 years ago. Our typical
daily exposures are now 1,000,000,000,000,000,000
times greater than they were at these frequencies.

17
Why are there two different readings?
We display two different types of reading, as they
each represent different but important aspects of
your exposure: Peak Signal Strength and Power Flux
Density (PFD).
Peak Signal Strength is the electric field strength,
measured in volts per metre (V/m). These readings
are on the left column of LEDs and the top line of the
OLED display.
Power Flux Density (PFD) is the time-averaged
power in microwatts per square metre (µW/m2).
These readings are on the right column of LEDs, and
the bottom line of the OLED display.
The traditional scientific viewpoint is that the only
relevant measurement of high-frequency RF fields is
the total amount of absorbed energy from exposure,
which causes body tissue heating, measured as PFD.
This is the basis of most official international
guidelines, and so most legal guidelines and limits
are specified as a time-averaged PFD limit.
However, there is now a large body of high-quality
scientific and medical evidence demonstrating
biological effects from exposure levels far below
these standards, and the evidence is strongly
suggestive that most of the adverse effects are not
related to the total absorbed energy as they occur
far below levels of measurable tissue heating.

18
Published evidence has led us to believe that it is
more likely that the electric field component of the
field is interacting with the human body or nervous
system. If the human body is reacting to specific
electric field signals, it is more likely that the peak
electric field strength is the more relevant metric.
All RF meters that are adequately sensitive to be
able to measure fields at levels below those that
cause heating (a few V/m or below 10,000 µW/m2),
measure voltage and then calculate the approximate
power level. Some do that correctly, and some just
display the peak level directly converted and they
give incorrectly high readings. The direct conversion
only works correctly for continuous non-pulsing
(CW) signals.
The Acoustimeter displays both the peak signal
strength in V/m as well as the power in µW/m2,
correctly integrated over some 25,000 readings
every second.
The EMFields website has an RF unit converter for
continuous RF (CW) signals on this page:
http://www.emfields-solutions.com/rf
You may have noticed that different PFD units are
used in some regions. We have chosen to use
µW/m2 on the Acoustimeter, as this is the most
commonly used internationally, and these readings
can be easily converted into other PFD units.
1 µW/cm2= 10,000 µW/m2= 10 mW/m2= 0.01 W/m2
1 mW/cm2= 10 W/m2= 10,000,000 µW/m2

19

20
Digital and Analogue signals
Most modern wireless devices, such as mobile
phones, Wi-Fi devices and cordless phones, use a
digital system of communicating.
This means they turn the signal on and off at high
speeds to represent data, often with wide gaps
between data bursts. This produces a non-
continuous signal, which we describe as ‘pulsing’.
This means that when taking measurements in most
environments, you are likely to find that the left
peak (V/m) LEDs are higher up the scale than the
right PFD (µW/m2) LEDs.
A simple digital signal
The pulsing is almost always faster and more
complex than shown in the diagram, but the
principle is similar.
Table of contents
Other EMFields Measuring Instrument manuals
Popular Measuring Instrument manuals by other brands
Flybox
Flybox Omnia57 G-METER Installation and user manual
LaserLiner
LaserLiner LaserRange-Master i2 manual
Starrett
Starrett Electronic IP67 user guide
Greiner Vibrograf
Greiner Vibrograf Magnotest II operating manual
Primes
Primes PocketMonitor operating manual

Monitor
Monitor HumiCore Pro Installation & operation
