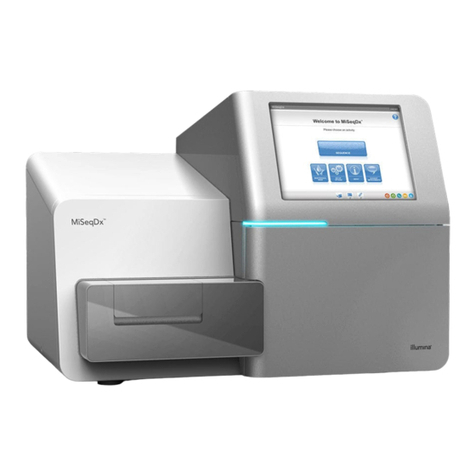
GE HEALTHCARE Biacore T100 User manual

GE Healthcare
Biacore T100
Software Handbook


Biacore T100 Software Handbook BR-1006-48 Edition AE 3
Contents
1Introduction
1.1 System overview ............................................................................ 9
1.2 Support for use in regulated environments ............................ 10
1.3 Associated documentation ........................................................ 10
1.4 Biacore terminology .................................................................... 10
2 Control Software – general features
2.1 Operational modes ...................................................................... 15
2.2 User interface ............................................................................... 16
2.2.1 On-line help................................................................................................. 17
2.3 Basic operation ............................................................................. 17
2.3.1 Selecting cycles and sensorgrams.................................................... 17
2.3.2 File menu...................................................................................................... 17
2.3.3 Edit menu ..................................................................................................... 19
2.3.4 View menu................................................................................................... 19
2.3.5 Run menu..................................................................................................... 21
2.3.6 Tools menu.................................................................................................. 21
2.3.7 Right-click menus ..................................................................................... 22
2.4 File storage .................................................................................... 23
2.4.1 Wizard templates and methods......................................................... 23
2.4.2 Result files.................................................................................................... 23
3Manualrun
3.1 Preparing for a manual run ........................................................ 25
3.1.1 Instrument preparations ....................................................................... 25
3.2 Starting a manual run ................................................................. 26
3.3 Controlling a manual run ........................................................... 27
3.4 Ending a manual run ................................................................... 29
4 Application wizards
4.1 Wizard templates ......................................................................... 31
4.1.1 Creating and editing wizard templates .......................................... 31
4.1.2 Running wizards ....................................................................................... 32
4.2 Common wizard components .................................................... 32
4.2.1 Injection sequence ................................................................................... 32
4.2.2 Assay setup ................................................................................................. 34
4.2.3 Injection parameters............................................................................... 35
4.2.4 Sample and control sample tables ................................................... 36
4.2.5 System preparations............................................................................... 37
4.2.6 Rack positions ............................................................................................ 39
4.2.7 Prepare Run protocol.............................................................................. 43

4Biacore T100 Software Handbook BR-1006-48 Edition AE
4.3 Surface preparation wizards ......................................................44
4.3.1 Immobilization pH scouting................................................................. 44
4.3.2 Immobilization ........................................................................................... 46
4.4 Assay development wizards .......................................................52
4.4.1 Regeneration scouting ........................................................................... 52
4.4.2 Buffer scouting........................................................................................... 55
4.4.3 Surface performance .............................................................................. 58
4.5 Assay wizards ................................................................................59
4.5.1 Binding analysis ........................................................................................ 59
4.5.2 Concentration analysis .......................................................................... 62
4.5.3 Kinetics/Affinity.......................................................................................... 66
4.5.4 Thermodynamics...................................................................................... 70
4.6 Control experiment wizards .......................................................72
4.6.1 Mass transfer control.............................................................................. 73
4.6.2 Linked reactions control........................................................................ 73
4.6.3 Evaluation of control experiments.................................................... 74
5Methods
5.1 Opening methods .........................................................................77
5.2 Method structure ..........................................................................78
5.3 Method overview ..........................................................................79
5.4 General settings ............................................................................80
5.5 Assay steps ....................................................................................81
5.5.1 Base settings .............................................................................................. 82
5.5.2 Number of replicates............................................................................... 84
5.5.3 Recurrence................................................................................................... 84
5.5.4 Assay step preparations........................................................................ 85
5.6 Cycle types .....................................................................................85
5.6.1 Commands.................................................................................................. 86
5.6.2 Variables....................................................................................................... 92
5.6.3 Report points .............................................................................................. 95
5.7 Variable settings ...........................................................................96
5.8 Verification ....................................................................................97
5.9 Setup Run .......................................................................................97
5.9.1 Detection ...................................................................................................... 97
5.9.2 Variables....................................................................................................... 98
5.9.3 Cycle run list................................................................................................ 99
5.9.4 System preparations............................................................................... 99
5.9.5 Rack positions..........................................................................................100
5.9.6 Prepare Run Protocol............................................................................100
5.9.7 Starting the run .......................................................................................100
5.10 Requirements for assay-specific evaluation .........................100
5.10.1 Concentration analysis ........................................................................100
5.10.2 Kinetics/Affinity........................................................................................101
5.10.3 Thermodynamics....................................................................................101
5.10.4 Affinity in solution...................................................................................101
Biacore T100 Software Handbook BR-1006-48 Edition AE 5
5.10.5 Other requirements................................................................................102
6 Evaluation software – general features
6.1 User interface .............................................................................105
6.1.1 Organization .............................................................................................105
6.1.2 The Evaluation Explorer.......................................................................106
6.2 Opening files ...............................................................................106
6.3 Common display functions .......................................................107
6.3.1 Zooming the display..............................................................................107
6.3.2 Right-click menus ...................................................................................107
6.4 Predefined evaluation items ....................................................109
6.4.1 Sensorgram...............................................................................................109
6.4.2 Plots..............................................................................................................109
6.5 Custom report points ................................................................110
6.5.1 Adding report points .............................................................................111
6.5.2 Editing and deleting report points...................................................112
6.6 Keywords .....................................................................................113
6.7 Solvent correction ...................................................................... 115
6.7.1 Background...............................................................................................115
6.7.2 When solvent correction should be used.....................................116
6.7.3 How solvent correction works ..........................................................116
6.7.4 Applying solvent correction................................................................117
6.8 Evaluation methods ...................................................................119
6.8.1 Creating evaluation methods............................................................119
6.8.2 Applying evaluation methods ...........................................................120
7 Data presentation tools
7.1 Sensorgram items ...................................................................... 121
7.1.1 Selecting sensorgrams for display..................................................122
7.1.2 Removing data ........................................................................................122
7.1.3 Sensorgram adjustment......................................................................123
7.1.4 Markers .......................................................................................................124
7.2 Plot items .....................................................................................125
7.2.1 Selector functions...................................................................................126
7.2.2 Table functions.........................................................................................127
7.2.3 Sorting the plot ........................................................................................128
7.2.4 Fitting curves to points.........................................................................128
7.2.5 Adjusting plots for controls ................................................................130
7.2.6 Ranking .......................................................................................................132
7.3 Bar chart items ...........................................................................133
7.3.1 Selector functions...................................................................................133
7.3.2 Display options ........................................................................................134
7.4 Report point table ......................................................................134
7.4.1 Displaying the report point table.....................................................134
8 Concentration analysis

6Biacore T100 Software Handbook BR-1006-48 Edition AE
8.1 Requirements for concentration evaluation .........................139
8.1.1 Calibrated measurements ..................................................................139
8.1.2 Calibration-free measurements .......................................................139
8.2 Evaluating calibrated concentration analyses .....................140
8.2.1 Calibration curves...................................................................................140
8.2.2 Control samples ......................................................................................142
8.2.3 Samples ......................................................................................................143
8.2.4 Custom models for calibration curves ..........................................144
8.2.5 Evaluating combined result sets.....................................................144
8.3 Evaluating calibration-free measurements ..........................145
8.3.1 Selecting samples...................................................................................146
8.3.2 Removing disturbed data....................................................................149
8.3.3 Performing the evaluation..................................................................149
8.3.4 Interpreting the results.........................................................................150
8.3.5 Fitting model.............................................................................................151
9 Kinetics and affinity analysis
9.1 Requirements for kinetics and affinity evaluation ...............154
9.2 Evaluating kinetics and affinity in single mode ....................155
9.2.1 Basic procedure ......................................................................................155
9.2.2 Multiple ligand densities......................................................................162
9.3 Batch mode evaluation .............................................................163
9.4 Quality assessment for kinetics evaluation ..........................164
9.4.1 The Quality Control tab........................................................................164
9.4.2 Statistical parameters ..........................................................................168
9.4.3 Components of the fit ...........................................................................170
9.4.4 Check kinetic data..................................................................................170
9.5 Quality assessment for affinity evaluation ...........................172
9.6 Summarizing kinetics and affinity results .............................173
9.6.1 Creating kinetic summaries ...............................................................173
9.6.2 Basic summary presentation ............................................................173
9.6.3 On-off rate maps.....................................................................................176
9.7 Curve fitting principles ..............................................................177
9.7.1 Fitting procedure ....................................................................................177
9.7.2 Local and global parameters ............................................................178
9.8 Predefined models ......................................................................179
9.8.1 Kinetics – 1:1 binding............................................................................180
9.8.2 Kinetics – Bivalent Analyte .................................................................181
9.8.3 Kinetics – Heterogeneous Analyte ..................................................182
9.8.4 Kinetics – Heterogeneous Ligand....................................................184
9.8.5 Kinetics – Two State Reaction...........................................................186
9.8.6 Affinity – Steady State 1:1 ...................................................................188
9.9 Creating and editing models ....................................................188
9.9.1 Interaction models for kinetics .........................................................189
9.9.2 Equation models for kinetics .............................................................194
9.9.3 Models for steady state affinity ........................................................195

Biacore T100 Software Handbook BR-1006-48 Edition AE 7
10 Thermodynamic analysis
10.1 Background .................................................................................197
10.1.1 Equilibrium thermodynamics ............................................................197
10.1.2 Transition state thermodynamics ...................................................198
10.2 Performing thermodynamic analysis .....................................199
11 Affinity in solution
11.1 Conventions and background ..................................................203
11.1.1 Experimental setup................................................................................203
11.1.2 Evaluation principles.............................................................................203
11.2 Requirements for affinity in solution ......................................204
11.3 Evaluation of affinity in solution .............................................205
Appendix A Data import and export
A.1 Exporting data ............................................................................ 209
A.1.1 Export functions ......................................................................................209
A.2 Importing data ............................................................................ 210
A.2.1 Control Software.....................................................................................210
A.2.2 Evaluation Software ..............................................................................213
Appendix B Method examples and recommendations
B.1 Affinity in solution ...................................................................... 215
B.2 Calibration-free concentration analysis ................................ 216
B.2.1 Assay steps and general settings....................................................216
B.2.2 Cycle types.................................................................................................216
B.2.3 Variable settings......................................................................................217
B.2.4 Setup Run...................................................................................................218
B.3 GST kinetics .................................................................................219
B.4 Inject and Recover .....................................................................221
B.5 Kinetics heterogeneous analyte .............................................. 223
B.6 L1 liposome capture ..................................................................223
B.7 LMW kinetics and LMW Screen ................................................224
B.8 NTA kinetics .................................................................................226
B.9 Single-cycle kinetics ..................................................................227
Index.............................................................................................. 229

8Biacore T100 Software Handbook BR-1006-48 Edition AE

Biacore T100 Software Handbook BR-1006-48 Edition AE 9
Introduction 1
1 Introduction
Biacore™ T100 is a high performance system for analysis of biomolecular
interactions, based on GE Healthcare’s surface plasmon resonance (SPR)
technology. The Control Software supplied with the system offers easy-to-use
wizards for assay development and common applications together with flexible
facilities for designing custom analysis methods using a graphical interface
called Method Builder. Results are evaluated in separate Evaluation Software
designed for efficient and flexible evaluation, with dedicated functions for
common applications.
This Handbook describes in detail how to use the Control and Evaluation
Software.
1.1 System overview
Instrumentation in the Biacore T100 system is described in full in the
Biacore T100 Instrument Handbook. Important features relevant to software
operation include:
• Biacore T100 supports simultaneous analysis in up to four flow cells
connected in series. The flow cells are arranged in pairs (Fc1-2 and Fc3-4)
with minimum dead volume between the flow cells in a pair to provide
accurate reference subtraction.
• The sample compartment accommodates one microplate (96- or 384-well,
regular or deep-well capacity) and one reagent rack for reagent vials. A
combined sample and reagent rack can be used in place of the separate
microplate and reagent rack.
• Material that binds to the sensor surface during sample injection can be
recovered in a small volume of liquid for further analysis by e.g. mass
spectrometry.
• The temperature in the sample compartment is controlled separately from
the analysis temperature, allowing samples to be kept at one temperature
while analysis is performed at another. Samples equilibrate to the analysis
temperature during injection into the flow cell. The analysis temperature
can be varied during a run, and the sample compartment temperature
can be set to follow the analysis temperature if desired.
• The system includes a buffer selector valve, allowing analysis to be
performed in up to four different buffers in the same unattended run.

1 Introduction
1.2 Support for use in regulated environments
10 Biacore T100 Software Handbook BR-1006-48 Edition AE
1.2 Support for use in regulated environments
Support for use in regulated (GxP1) environments is provided in an optional
package that adds appropriate functionality to the Biacore T100 software.
Functions for GxP support are described in a separate Biacore T100 GxP
Handbook. Descriptions of software in the current Handbook apply to
installations both with and without the GxP package unless otherwise stated.
1.3 Associated documentation
This Handbook describes Biacore T100 Control Software and Evaluation
Software, version 2.0. Any functionality that is added in optional add-on
modules is described in separate documentation.
Biacore T100 Instrument Handbook describes the instrumentation in the
Biacore T100 system, with instructions for operation, maintenance and
troubleshooting.
Biacore T100 GxP Handbook describes functionality added with the optional
GxP package, together with some recommendations for using the system in a
regulated environment.
Other general handbooks and documentation describing the technology are
available from GE Healthcare. Information may also be found on the Internet at
www.biacore.com.
1.4 Biacore terminology
Biacore monitors the interaction between two molecules, of which one is
attached to the sensor surface and the other is free in solution. The following
terms are used in the context of work with Biacore systems (see Figure 1-1):
• The partner attached to the surface is called the ligand. Attachment may
be covalent or through high affinity binding to another molecule which is
in turn covalently attached to the surface. In the latter case the molecule
attached to the surface is referred to as the capturing molecule.
Note: The term “ligand” is applied here in analogy with terminology used in
affinity chromatography contexts, and does not imply that the
surface-attached molecule is a ligand for a cellular receptor.
•Theanalyte is the interacting partner in solution for which the
concentration is to be measured. In direct binding assays, the analyte
binds directly to the ligand. In inhibition assays, the concentration of
analyte is measured indirectly through binding of an additional molecule.
1GxP is used as a generic abbreviation for GLP (Good Laboratory Practice), GMP (Good
Manufacturing Practice) and GCP (Good Clinical Practice).

Biacore T100 Software Handbook BR-1006-48 Edition AE 11
Introduction 1
Figure 1-1. Ligand, analyte and capturing molecule in relation to the sensor surface.
•Regeneration is the process of removing bound analyte from the surface
after an analysis cycle without damaging the ligand, in preparation for a
new cycle.
• Response is measured in resonance units (RU). The response is directly
proportional to the concentration of biomolecules on the surface.
•Asensorgram is a plot of response against time (see Figure 1-2), showing
the progress of the interaction. This curve is displayed directly on the
computer screen during the course of an analysis. Sensorgrams may be
analyzed to provide information on the rates of the interaction.
• In many assay situations, sample passes over two or more flow cells in
series, where one flow cell (usually the first) serves as a reference while
ligand is attached in the other flow cell(s). Surfaces with ligand are referred
to as active: blank surfaces used for reference purposes are reference.
• A particular sensorgram is referred to as a curve in several contexts in the
software. This terminology is used to distinguish between different classes
of sensorgram that recur within a run: for example, measurements on one
active and one reference surface can generate separate curves for each
of the two flow cells and a third reference-subtracted curve (active minus
reference)
•Areport point records the response on a sensorgram at a specific time
averaged over a short time window, as well as the slope of the sensorgram
over the window. The response may be absolute (above a fixed zero level
determined by the detector) or relative to the response at another
specified report point.

1 Introduction
1.4 Biacore terminology
12 Biacore T100 Software Handbook BR-1006-48 Edition AE
Figure 1-2. Schematic illustration of a sensorgram. The bars below the sensorgram
curve indicate the solutions that pass over the sensor surface.

Biacore T100 Software Handbook BR-1006-48 Edition AE 13
Control Software

14 Biacore T100 Software Handbook BR-1006-48 Edition AE

Biacore T100 Software Handbook BR-1006-48 Edition AE 15
Control Software – general features 2
2 Control Software – general features
2.1 Operational modes
Biacore T100 Control Software offers three modes of operation:
•Manual run provides interactive control of the instrument operation,
executing commands singly as they are issued. This mode is most useful
for ad hoc experiments involving one or a few injections, such as testing
the response obtained from injection of a single sample.
•Application wizards provide guidance in setting up experiments for assay
development and execution. Separate wizards are offered for different
purposes such as ligand immobilization, concentration determination or
measurement of kinetic constants. Each wizard consists of an ordered
series of dialog boxes, ensuring that the essential features of the
application setup are correctly defined.
•Methods provide greater flexibility (and conversely less guidance) in setting
up applications, allowing customized applications that are not covered by
wizards. Methods are defined in a graphical interface called Method
Builder, which is designed to provide full flexibility in method definition
while retaining a simple interface for running assays based on established
methods. Application wizard templates may be opened in Method Builder
to provide a starting point for further refinement of application setup.
Predefined methods are also provided as help in defining methods for
selected purposes (see Appendix B).
Each of these modes of operation is described in more detail in the following
chapters.

2 Control Software – general features
2.2 User interface
16 Biacore T100 Software Handbook BR-1006-48 Edition AE
2.2 User interface
The main screen in the control software is divided into the following areas
•Themenu and toolbar provide access to control commands.
•Theevent log records settings at the start of the run and instrument
control events during the run. The event log is displayed in a separate
window, opened by clicking on the Event Log button at the right of the
toolbar.
•Thesensorgram window displays the sensorgrams for the current run or
the currently open file.
•Thereport point table lists report points for the currently displayed cycle.
Report points record the response at a set time and are defined
automatically: custom report points can also be added in methods, or
after the run in either the Control Software or the Evaluation Software.
•Thekeyword table lists keywords for the currently displayed cycle.
Keywords are defined automatically in wizard runs, or in the method for
method runs.
•Thestatus bar displays the instrument status, including the temperature of
the detector and the sample compartment. The content of the status bar
varies between different situations: for wizard- and method-based runs,
the elapsed run time and the estimated total run time are included.
Menu and toolbar
Event log
Sensorgram window
Report point table
Keyword table
Status bar

Biacore T100 Software Handbook BR-1006-48 Edition AE 17
Control Software – general features 2
2.2.1 On-line help
On-line help is available at any time from the Help menu. Context-specific help
for dialog boxes is provided through Help buttons in the boxes.
2.3 Basic operation
2.3.1 Selecting cycles and sensorgrams
During a run, the current cycle is displayed by default. You can choose which
cycle to display in the Cycle selector, but the display will revert to the current
cycle when a new cycle is started. For a completed run, choose which cycle to
display with the Cycle selector in the toolbar:
The Curve selector determines which curve in the cycle is current in the display.
Options in the View menu (Section 2.3.4) control which curves are displayed in
the sensorgram window.
2.3.2 File menu
The Open/New options for wizard templates and methods create new wizard
templates and methods, and open existing templates and methods for editing
or for starting a run.
Open opens result files. Most result files just display the sensorgrams and tables.
Files from immobilization and regeneration scouting wizards also display a
summary window showing the results of the run (see Sections 4.3.2 and 4.4.1).
Save and Save As save the results as a Biacore results file (extension .blr).
Export exports the current results to a file in Microsoft Excel or XML format, or
exports the contents of the report point table to a tab-separated file. See
Appendix A for details of the export format.

2 Control Software – general features
2.3 Basic operation
18 Biacore T100 Software Handbook BR-1006-48 Edition AE
Print prints a hard-copy of the results. Select the printer to use and check the
items you wish to print.
Sensorgrams may be printed as follows:
Note: In order to maintain report layout, the print orientation is fixed regardless
of the printer settings in Windows.
Properties shows detailed properties of the currently opened run, including the
properties of the sensor chip used in the run.
When you close the software with Exit while the instrument is still switched on,
you may choose to shut down the instrument for a shorter or longer period if
required. See the Biacore T100 Instrument Handbook or the on-line help for
more details.
None No sensorgrams will be printed.
Current cycle The current cycle will be printed with the View:Show… setting
and scale as shown on the screen.
Range and
All cycles
Multiple cycles will be printed. For Range, enter a range or
cycle numbers separated by commas (e.g. 4-16,19,22).
All curves will be included in each cycle regardless of the
View:Show… setting. Sensorgrams will be printed at full scale
unless the Lock Scale box is checked in the sensorgram
window, in which case the current scaling will be applied to
all cycles (with this setting, some sensorgrams may appear to
be empty).

Biacore T100 Software Handbook BR-1006-48 Edition AE 19
Control Software – general features 2
2.3.3 Edit menu
Options in the Edit menu allow you to add, edit and delete report points. Report
points are created automatically and are used in various evaluation contexts.
You should in general avoid editing or deleting report points that are created
automatically.
Editing operations for report points in the Control Software may be applied to
single report point instances or to all instances of the report point in the current
cycle. Note that editing operations are not applied to multiple cycles.
Report points created in the Control Software cannot be edited in the Evaluation
Software. The Evaluation Software offers functions for creating and editing
custom report points that can be applied to all cycles in the run in a single
operation. This is usually preferable to adding report points in the Control
Software.
2.3.4 View menu
Chip Properties opens a dialog box that displays the properties of the currently
docked sensor chip. The Ligand column is empty for flow cells that have not
been used, and shows [Blank] for flow cells that have been prepared as a blank
reference surface by activation and deactivation. The text [Incomplete results]
indicates that the immobilization run was interrupted (by for instance user
intervention or power failure) before it could be completed.

2 Control Software – general features
2.3 Basic operation
20 Biacore T100 Software Handbook BR-1006-48 Edition AE
Properties for the sensor chip used in a currently open run may be found under
File:Properties (Section 2.3.2).
Title sets a title in the sensorgram window. The default title is the assay step
name.
Scale sets the scale of the sensorgram window:
If you set Auto scale, the scale will be adjusted if necessary to accommodate
the full data range of the currently displayed cycle. During a run, the scale is
adjusted at intervals as more data is collected. Check the Lock scale box in the
top right corner of the sensorgram window to lock the scale to the current
settings.
Adjust Scale sets the scale to the full data range. This will not affect the Auto
scale setting in the Scale dialog. Adjust Scale overrides but does not turn off the
Lock scale setting.
To scale the sensorgram display interactively, drag with the cursor over the area
to be scaled. Double-clicking in the display or choosing View:Unzoom restores
the previous zoom setting.
Reference line toggles display of a movable vertical line in the sensorgram
window, together with a separate small window that shows the response and
time coordinates at the reference line for the current curve. Use the Curve
selector in the toolbar (see Section 2.3.1) to set the current curve. Drag the
reference line to move it. When the reference line is displayed, choosing
Baseline sets a baseline at the current reference line position, and the
coordinates window shows the response relative to that baseline.
Table of contents
Other GE HEALTHCARE Laboratory Equipment manuals
Popular Laboratory Equipment manuals by other brands

REPLIGEN
REPLIGEN CTech FlowVPE Maintenance Guide

Hologic
Hologic ThinPrep 5000 instruction manual

TestEquity
TestEquity 1016H Operation and service manual

GE
GE Amersham Imager 680 operating instructions

MMM Group
MMM Group CO2Cell 190 Standard Instructions for use

NanoEnTek
NanoEnTek ADAM-SCC2 instruction manual