JORGENSEN J1010 User manual

SINGLE CHANNEL
ECG and MONITOR
J1010


J1010 SINGLE CHANNEL ECG MONITOR
TABLE OF CONTENTS
ECG Instrument Views ..............................................................
Getting the Most From Your ECG .............................................
Introduction ...............................................................................
Features ....................................................................................
Grounding .................................................................................
Battery Operation ......................................................................
Loading the ECG Paper ............................................................
Keypad Features .......................................................................
Descriptions of Functions On The Screen.................................
Attaching the Limb Electrodes ..................................................
Problem Solving with Cats ........................................................
Troubleshooting ........................................................................
Reference Articles .....................................................................
Warranty and Maintenance .......................................................
1
2
4
4
4
5
5
6
9
11
12
13
16
27

JORVET SINGLE CHANNEL ECG
J-1010
FRONT PANEL
Carry Handle
Fuses BACK PANEL
Ground
A/C Cord Plug in
BOTTOM PANEL ON//OFF Switch
RIGHT SIDE
Patient Lead Analog port Computer port—not supported on this model
1

GETTING THE MOST FROM YOUR ECG
The ECG tracing is a valuable diagnostic tool, and their interpretation can be a
challenging task for the clinician and staff. However, with some simple study, the ECG
will be an indispensable clinical parameter.
Some recommended indications for the use of the ECG include:
¾Any animal with a heart murmur or arrhythmia detected with a stethoscope.
¾Any animal with episodes of weakness or fainting, exercise intolerance, or
sudden changes in activity level..
¾A hypothyroid dog or hyperthyroid cat.
¾Any animal with hypotension or hypertension.
¾Any patient being treated for congestive heart disease should have follow-up
tracings as part of maintenance and control of the disease.
¾Electrolyte imbalances such as Addison’s disease.
¾Breeds with predispositions to heart disease, such as Persian cats and
Doberman Pinschers.
¾Geriatric exams can be greatly enhanced by the addition of a LEAD II rhythm
strip screening.
Should suspicious tracings exist, then a full 6-lead cardiograph analysis is
recommended.
An ECG recording should always be evaluated in conjunction with complete
patient history, clinical findings, radiographs, blood chemistries including
electrolytes and blood gases, and urinalysis. The recording is not by itself a
complete diagnosis but rather a look at the electrical activity of the myocardium,
that can be affected by many disorders along with artifactual interference.
2

HELPFUL HINTS FOR GETTING
QUALITY ECG TRACINGS
Use a rubber mat to insulate the patient from a stainless steel table.
Select a quiet or remote area of the clinic for the procedure.
Leave the instrument turned off until the leads are attached and the animal
is calm.
Right lateral recumbency is the standard body position for ECG recording in
dogs and cats.
If respiratory distress is evident, consider recording with the animal standing or
in sternal recumbency.
To obtain the most accurate tracings, care should be taken to avoid undo stress
and minimize the “white coat” effect. Allow the animal to become familiar with its
surroundings.
Establishing contact with the patient is important, especially for the person
administering the ECG.
Consider owner participation in cases of small dogs or cats, or animals that are
especially frightened. Small patients may be placed on the lap of the owner, or
of another technician if it will alleviate stress.
Some dogs will tolerate the procedure much better if standing on the floor rather
than being placed on a table.
Use of sedatives or tranquilizers is not advisable for diagnostic recordings. If
used possible effects on those tracings should be taken into consideration.
Attach electrodes to the skin and moisten with ECG gel or 70% alcohol. When
using alcohol avoid excessive amounts, as alcohol may travel between leads.
Essentially this has the same effect as having electrodes touch each other.
3

INTRODUCTION
The Jorvet™ Single Channel ECG is a one-channel digital electrocardiograph that
records the 6 most common leads: Lead I, II, III through AVR, AVL and AVF. 4 patient-
comfortable limb leads and a ground are provided. It is equipped with an advanced wide
range thermal-array printing system, single chip 32 bit microprocessor.
FEATURES
¾High resolution built in thermal array printer (8 dot/mm)
¾Installed rechargeable NiMH 12 volt battery will support approximately 50 patient
examinations, depending on length of examinations.
¾Keypad one-touch buttons allow for easy set-up and operation.
¾LED screen is well-lit and easy to read.
¾Lead strips print patient information form (AUTO mode) as well as sensitivity,
paper speed, and filter settings.
¾AUTO and MANUAL modes provide optimal customization for diagnostic
Interpretation.
GROUNDING
The J1010 is grounded during AC operation through the three-prong AC plug.
During battery operation, a grounding wire (included) should be connected to the
ground site on the back of the unit.
4

BATTERY OPERATION
The J1010 has an installed maintenance-free 12 volt NiMH rechargeable battery.
Please allow 10 hours to completely recharge the battery if drained fully. Recharge in
the AC operation mode: flip on the power switch at the back panel of the unit. Do not
press the ON/OFF button. DO NOT charge the battery for more than 24 continuous
hours. The unit may be left plugged in, but the power switch must be off to prevent
damage to the battery.
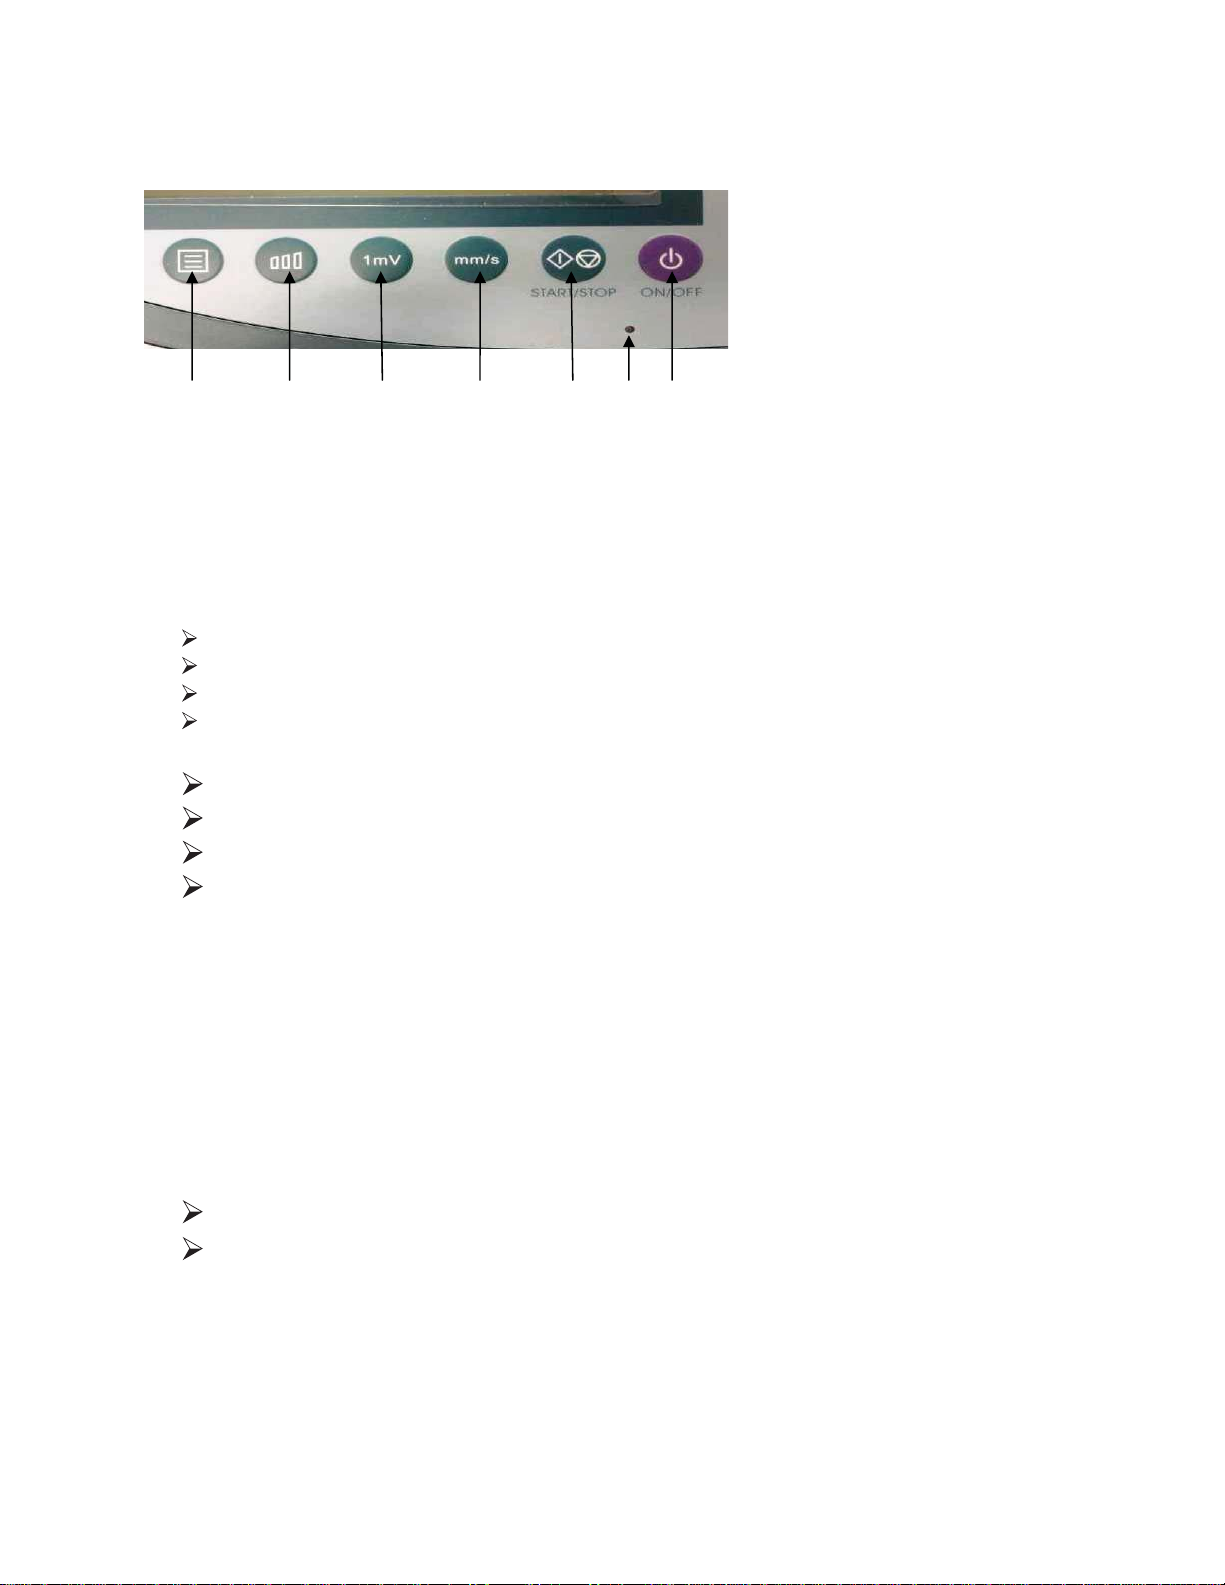
Battery charge status is indicated on the LED tracing screen (battery mode only).
Indicator light flashes green on keypad when charging and turns to a solid green when
fully charged. Turn the power switch off at this time (Power switch on back panel of
unit solely operates battery charging).
To operate solely on battery turn power switch on back panel to OFF (battery icon
should be illuminated in upper right corner of screen). If battery icon is white battery is
fully charged and ready to use, battery icon will empty as battery is depleted.
The cardiograph will turn itself off after 5 minutes of non-use. Press ON/OFF to
resume. During long term storage or extended periods of non-use, recharge the battery
every 6 months.
Always check battery level on the screen before running on battery power.
LOADING THE ECG PAPER
Depress the button on the left side of the machine to open the door of the paper
cabinet, and lift door off. Load paper printed side down and replace the door with the
rubber roller sitting on top of the paper.
Avoid slack in the paper tension and align the paper straight with the door edge.
Adjust paper position as necessary if printing is off center. PAPER? alarm will appear
on screen until paper is replaced or the situation is remedied.
PlacepaperinECGslotgridfacing
down.
Placecoverovertopofpaper
andclose.
ECGreadytoprint
5

KEYPAD FEATURES
DO NOT use sharp or metal objects on the keypads
1
2
3
4
1. LEAD(/)- Lead Switch
In the recording status, used to switch the leads - I, II, III, AVR, AVL, AVF
In the menu setting status, used to select the parameters of
setting.
2. MODE - Mode switching button
Used to switch among various recording modes.
Manual 1 / Manual 2 & Auto 1 / Auto 2
In the menu setting status, used to select options / maneuver in the menu.
3. Reset- Closing button
In standby status, used to close the lead signal.
In menu setting used to select options / maneuver in the menu.
4. OK – Confirm Button
Confirm the selection of the options in the menu or enter into the next level of the
menu.
6
6

A B C D E F G
A. ) Menu Button- allows you to change internal settings
use arrows on left side of keypad to
maneuver through.
I._FILTER SETTINGS
0.05 - 150 Hz No filter is selected
H50 D – Only the A/C filter and baseline drift filter are turned on
H50 D 75 Hz - All filters are turned on and the frequency of muscle electricity filter is 0.5 -75Hz
H50 D 35 Hz – All filters are turned on and the frequency of muscle electricity filter is 0.5 -35Hz
II. BASE LINE WIDTH = LINE SIZE OF BASE LINE on ECG printout.
1X- Thinnest
2X - Default
3X
4X- Thickest
III. EXTERNAL RECORD- Turn on / off record of external input
Signal, this should be set to off.
IV. LCD Contrast- Adjusts contrast on LCD screen from 1-16, default =7 .
V. LAUNGAGE SET- Chinese, English, Russian
Default is English.
VI. AC FREQUENCY – Setting the A/C frequency
Default should be set to 50 Hz.
VI. PRINTER TEST- Tests printer function.
press OK to test – prints triangular form
press Ok again to stop.
VII. RESTORE SET- Resets factory default settings press OK to
ACTIVATE
VIII. RHYTHM LEAD- Selects the rhythm lead
IX. RECORD LENGTH- Length of time each lead will print in the auto
mode, ranges from 3-12 seconds.
7

X. POWER OFF- Sets time at which unit will shut itself off if
not in use, choose from 0 to 60 minute intervals.
XI. AUTO ID-Serial # of unit
XII. DATA MANAGE- Storing internal date for external factory default= none.
XIII. LEAD (V)- Turns ON / OFF leads V1 thru V5 not
applicable with a 4 lead system unit
should be set to OFF.
XIV. DISPLAY MODE- Chooses either single lead shown on
screen or three leads shown at one
time on display screen.
Highlight display mode option with arrows on left side of keypad and press
Ok to choose option 1 or 3 leads.
A B C D E F G
B.) Sensitivity Selection- works ONLY in Manual 1 & 2 Mode
Choose manual 1 or manual 2 mode by pressing up arrow on
left side of screen. Sensitivity or waveform Height can then be
adjusted from 2.5 mm/mV, 5mm/mV,10mm/mV,20mm/mV
. AUTO mode selects this automatically.
This feature increases or decreases sensitivity of the tracing, depending on the
size of the QRS complex, e.g., if the tracing is off the paper decrease the
sensitivity.
This cardiograph is calibrated at 1 cm/mV
Standard signal and ECG paper at 1 cm/mV, each tiny square equals 0.1mV
amplitude (height) and 0.02 sec duration (width) at 50 mm per second paper
speed.
** Changing sensitivity affects amplitude only.
8

C.) 1 mV – Press this button under recording status to print out the
calibration waveform of 1mV to check the current sensitivity
status .
D.) mm/ s – Allows you to adjust paper /screen speed of your
ECG the options are 12mm/s, 25mm/s and 50mm/s.
E.) Start / Stop – Starts / stops printing of ECG waveform chosen- will be
highlighted black box shown on left side of screen.
F.) Charge light- flashing green = charging
solid green = battery fully charged
G) On / OFF – Controls the on / off of display screen only.
Descriptions of Functions on the Screen
Filter settings Heart Rate
ECG lines to be Battery / AC Icon
printed (highlighted
by the black box) Printer status
Paused / Printing
Sound Tag- not
applicable in this
model
Record Mode - Record Speed Sensitivity
Auto 1 / Auto 2
Manual 1 / Manual 2
Auto 1- Prints one line of ECG ( highlighted by black box on left) and
automatically switches between leads I,II,III, AVR, AVL and AVF.
Auto 2- Prints two lines of ECG ( highlighted by black box on left) and
automatically switches between leads I,II,III, AVR, AVL and AVF ( if only
one line of ECG is seen on the screen Auto 2 is not applicable).
9

Manual 1 - Prints one line of ECG ( highlighted by black box on left) and DOES
NOT automatically switch between leads I,II,III, AVR, AVL, AVF, you
must manually switch leads to be printed.
Manual 2 – Prints two lines of ECG ( highlighted by black box on left) and DOES
NOT automatically switches between leads I,II,III, AVR, AVL and
AVF ( if only one line of ECG is seen on the screen Manual 2 is not
applicable).
10

20
ATTACHING THE LIMB ELECTRODES
Attach four limb electrodes to soft muscular,not bony,areas at the limb joints using the following
steps.
1. Clean the skin with a cotton moistened with alcohol to remove oil.
2. Connect the patient cable to the electrodes.
3. Apply a small amount of 70% alocohol or electrode gel on the
secafrustcatnoc of the electrodes.
4. Clip the cleaned electrode site with the electrode.
PATIENT CABLE TIP COLOR COATING
Firmly insert the lead tip of the patient cable to the electrode, matching the tip color and electrode
site.Refer to the table below.
LEAD CONNECTION
AHA STANDARD
SITE
RIGHT FORE LIMB
LEFT FORE LIMB
RIGHT REAR LIMB
LEFT REAR LIMB
CODE
RA
LA
RL
LL
COLOR
WHITE
BLACK
GREEN
RED
11

21
PROBLEM SOLVING WITH CATS
Unlike humans and most dogs,the cardiac axis is not aligned top right to bottom left in cats.The
heart has a tendency to lie more centrally with its apex more ventral than the atria, i.e.,the heart
points downward towards the ground when the animal stands.
This gives rise to one of the common problems with monitoring cats,finding the strongest signal to
present to the RA and LL electrodes.
The best signal is derived top/bottom axis i.e.Lead II in humans, with RA looking at the top of the
heart and LL at the bottom. In cats,as stated,the axis may not lie across the body.(see figure 1)
As lead II may not align with the cat’s axis,the signal is small and sometimes cancels.Therefore,by
moving RA more centrally onto the cat’s body above the top, and LL onto the cat’s body below the
bottom of the heart, a much larger signal will be obtained.
The plane in which the cat’s heart lies within its body may also vary.
The“top”of the heart may be more dorsal and the“bottom”more ventral.In this case, we would refer
to the base/apex axis (see figure 2) when the following instructions should be followed.
1.Move LL to the left apex of the heart.
2.Move RA to the V10 position (over the dorsal spinous process of the seventh thoracic
vertebra) and LL to the V4 position (sixth left intercostal space at the costochondrail
junction).It will be necessary to annotate the printouts,if any,with actual configurations used
to avoid later confusion.
Figure 1
Figure 2
12

TROUBLESHOOTING
PAPER ALARM PAPER? CAUSES / SOLUTIONS
Alarm appears on tracing screen Paper out?
Paper mis-feed, mis-align?
Correct as needed
LOSS OFPOWER CAUSES / SOLUTIONS
Loose AC cord, plug, connection?
Battery has discharged
Electrical power loss
AC interference from other equipment
TURN POWER OFF BEFORE
TROUBLESHOOTING
Check AC cord and connections
Recharge battery
During battery operation power is automatically
cut off after 5 minutes of non-use. If the battery is
fully charged, restart operation using the ON/OFF
button.
.
13

22
TROUBLESHOOTING
AC Interference Appears on the ECG as even-peaked, regular voltages
superimposed throughout the tracing. It may appear in conjunction
with muscle tremor.
Causes:
• Dirty or corroded lead wire tips or electrodes
• Loose electrode connection
• Patient or technician touching an electrode during recording
• Patient touching any metal part of a bed or examination table
• Broken lead wire, patient cable or power cord
• Electrical devices in the immediate area,lighting, concealed
wiring in walls or floors
• Improperly grounded electrical outlet
Muscle Tremor Appears on the ECG as random, irregular voltages superimposed
Interference (EMG) on the tracing. It may resemble or occur in conjunction with AC
interference.
Causes:
• Patient is uncomfortable,tense,nervous or apprehensive
• Patient is cold and shivering
• Patient has neuro or muscular disorder
• Examination table is too narrow or short to support limbs
comfortably
• Patient may have“white coat”effect
See“Getting a Quality ECG”for suggestions
14

23
Wandering Baseline Appears on the ECG as a fluctuation of the tracing up and
downward on the grid.
Causes:
• Dirty or corroded electrodes
• Loose electrodes or electrodes positioned on a bony area
• Insufficient or dried out Alcohol or Electrode Gel
• Rising and falling of chest during normal or apprehensive
respiration
When wandering baseline occurs:
• Clean skin with alcohol or acetone if necessary
• Reposition electrodes
• Check the electrode connections
• Assist the patient in relaxation
Other When an electrosurgical unit is used with the cardiograph,noise
generated by an ESU is superimposed on the ECG waveforms.
Equipment in the same room as the cardiograph may generate
noise which is superimposed on the ECG waveforms.
• Noise generated by an electrosurgical unit
• Noise from AC power line
• Spike noise caused by electrostatic energy as shown below
.
15

24
So you are a veterinary technician and you would like to
learn how to interpret electrocardiograms (ECGs). Great idea!
What is reasonable to expect of yourself? Even veterinarians
can be somewhat daunted by all those squiggly lines.
After 20 years as a technician in the cardiology section of the
Veterinary College at the University of Minnesota, I can testify
that learning to read ECGs is fun, well within your grasp, and
can be a tremendously satisfying skill to have tucked under
your belt.
You can master the technique of recording an ECG as well as
learning the fundamentals of arrhythmia interpretation.
Although, measuring the ECG to assess heart chamber enlarge-
ment is certainly not beyond your skill level, it can be a tedious
phase of the learning process. The good news is that your vet-
erinarian can use other tools, such as radiographs and ultra-
sound to determine heart chamber size. This allows us to focus
on arrythmias which are more fun and require almost no meas-
uring.
Recording the ECG
The ECG can be recorded with the patient right side down or
in a standing position with any standard ECG strip chart
recorder.
1. Attach the electrode clips directly to the skin (taking care to
attach the correct electrodes to the appropriate limbs) and mois-
ten with alcohol or gel to assure good contact.
2. Enter a 1 cm = 1 m V calibration signal.
3. Record lead II for about a minute at 25 mm/sec to assess
arrythmias. Increase the length of the tracing if an arrhythmia is
seen. If you are determined to measure waveforms as well,
record a brief tracing at 50 mm/second.
It’s helpful to center the tracing on the paper so that both the
top and bottom of the waveforms can be seen. Also, decrease
the sensitivity to 1/2 cm = 1 mV if the QRS complexes go off
the paper.
The Normal ECG
Next on the agenda is learning what a normal ECG looks like
- and why.
You probably already know all the anatomy you need. The
heart has four chambers: two atria and two ventricles. They are
connected by a conduction system that spreads an electrical
current that enables the heart to contract. The ECG is simply a
graphic recording of this electrical activity during the different
phases of the cardiac cycle.
Read Between the Lines
Learning to interpret electrocardiograms will prove invaluable to your patients and practice
By: Naomi L. Burtnick, MT (ASCP)
The normal sequence of electrical activation in the heart is as
follows:
1. Sinoatrial (SA) node - located in the right atrium.
2. Atrioventricular (AV) node - conduction link between the
atria and ventricles.
3. Left and right bundle branches - located in the left and right
ventricles.
The following waveforms are part of a single heart beat”
P wave - corresponds to atrial contraction
PR interval - corresponds to the time it takes for the impulse to
pass through the AV node
QRS waves - correspond to ventricular contraction
Q is the first negative deflection.
R is the first positive deflection.
S is the negative deflection that follows the S wave.
Note: Not all QRS complexes have a Q and an R and an S.
That’s OK.
T wave - represents ventricular relaxation. T waves can be posi-
tive or negative, but every QRS complex has to have one. If it
contracts it has to relax before it can contract again.
Calculating the Heart Rate
The heart rate (beats/min) can be calculated easily by count-
ing the number of beats (R-R intervals) between two sets of
marks in the margin of the ECG paper (3 seconds at 25
mm/sec) and multiplying by 20. ECG rulers are also available.
this is all the measuring that’s necessary.
16

25
Recognizing Arrythmias
This is where you will be of most help to you patient and the
staff at your clinic. Think how much more interesting your job
will be if you watch a monitor during a surgery; you can be
responsible for alerting the doctor if abnormal beats occur.
To recognize arrythmias you need to know two things:
1. The site of origin of the abnormal beat.
2. Recognize deviations from the normal rate of automaticity
for that site.
Site of Origin
Three different sites can be identified on lead II by the
following features:
Atrial origin - These beats originate from
nowhere in the atria other than the SA mode.
They look just like a normally conducted
beat except that their timing is very early.
A big hint is that the P wave of the atrial
beat touches the T wave of the beat before it.
Junctional origin - These beats
originate near the AV node and
have a negative deflection P wave,
or no P wave, with a normally
conducted, short duration QRS
complex.
Ventricular origin - These beats
originate somewhere in the
ventricles. No P waves are
evident. QRS complexes are
wide and bizarre appearing
and may be positive or
negative polarity.
Intrinsic Rates of Automaticity
Atrial, junctional and ventricular sites each have a normal rate
of automaticity (the ability to initiate impulses), buy may
respond in the following abnormal ways:
Too fast (tachycardia) Too irritable (premature)
Too slow (bradycardia) Absent (block)
Normal pacemaker rates in the dog:
A great rule of thumb: Whichever site is fastest will drive the
heart.
A Case Example
Here’s an example to get you thinking along these lines. a 7-
year-old male boxer lethargically walks into the exam room
with a history of exercise intolerance. You run a lead II rhythm
strip that looks like the following:
How are we going to analyze it? Scanning from left to right
you see a P wave, PR interval, R wave (it’s OK for a QRS com-
plex not to have a Q an R and an S) and a negative T wave. In
other words, a normally conducted heat, which is followed by
two more normally conducted heats. The fourth beat has a
large, wide QRS complex with a big negative T wave. What
site do you think it originates from? It can’t be atrial because
there is no P wave. It can’t be junctional (near the AV node)
because it’s too wide and sloppy looking and junctional beats
should be of normal duration. But it definitely fits the criteria
for a ventricular origin beat! To further describe it we also use
the term “premature” because it comes before the next expected
normal beat. Next, are four more normally conducted beats fol-
lowed by another VPC (ventricular premature contraction).
Wouldn’t it be nice if they all came labeled! Can you spot the
next VPC on the strip?
This strip is recorded from the same dog one hour later. As
you can see, there are five normally conducted beats followed
by a long run of ventricular origin beats.
We have already decided the site of origin. the next step is to
decide if this an appropriate rate for that site. Here’s a chance to
practice the technique for calculating heart rate. Counting
between the markers (3 seconds at 25mm/second) we have 15
beats. If we multiply by 20 we will have the number of beats in
60 seconds. therefore, 20 x 15 = 300 beats per minute. That’s
way above the normal healthy ventricular conduction tissue rate
of 20-40 beats per minute indicated on the illustration of nor-
mal pacemaker rates in the dog. Now we want to apply the term
“tachycardia” to imply that the rate is too fast for that particu-
lar site. Ventricular premature contractions and ventricular
tachycardia are a significant finding in boxers. This breed is
predisposed to a form of dilated cardiomyopathy which has
life-threatening arrythmias.
A Second Case Example
A middle aged female miniature schnauzer faints while walk-
ing into the exam room, then gets up as if nothing happened.
The ECG you run looks like this:
Clearly, that long flat line is not normal. But how do we decide
what site in the heart is creating the problem? As was men-
tioned earlier, in the normal sequence of electrical activation in
17
Table of contents