LineEye LE-8500XR-RT User manual

MULTI PROTOCOL ANALYZER
Thank you for your purchase of LE-series.
This booklet tells you only the basic operation. For more detailed information, please refer
to the instruction manual (PDF) in the utility CD attached to the product.
2022 by LINEEYE CO., LTD. All rights reserved.
When you unpack the product, make sure you have all following items
□Protocol Analyzer 1
□Interface Sub-board [SB-R2TS1] (attached to the analyzer) 1
□DSUB 25pin monitor cable [LE-25M1] 1
□DSUB 9pin monitor cable [LE-009M2] 1
□DSUB25pin-9pin conversion adapter 1
□5 wires TTL prove cable [LE-5LS] 1
□Hand strap (Already mounted) 1
□Wide input AC adapter (Input :AC100-240V / Output :DC9V) 1
□USB cable (Type Standard A - Type C) 1
□Utility CD 1
□Quick Start Guide (this booklet) 1
□Carrying bag [LEB-01] 1
□Registration card, Warranty 1
Please let us know if you nd any damage to the product or accessories lacking.
Quick Start Guide

Outline
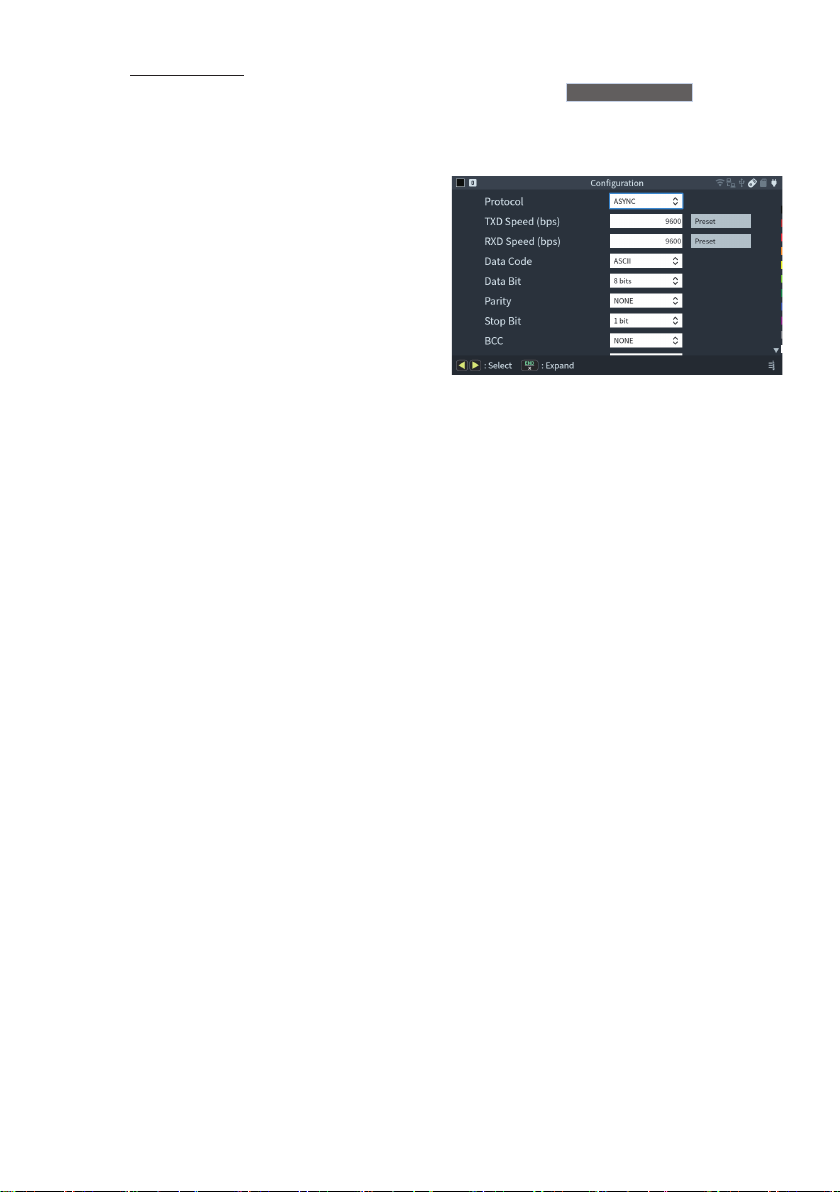
The LE-8500X-RT series is a handy-type communication protocol analyzer that has a
measurement board that supports RS-232C/RS-530, RS-422/485, and TTL signals as
its standard board. The online monitor function, simulation function, BERT (bit error
rate test) function, etc. can be used according to the test situation, so it can be widely
used for development, inspection, and failure diagnosis of communication systems and
communication equipment.
USER LIMITATION
This product has not been developed for the use that needs exclusively high reliability and
safety: aerospace apparatus, trunk communication apparatus, nuclear control apparatus,
medical apparatus related with life maintenance etc. Therefore, do no use for those
purposes.
LE-series models with Wi-Fi function (IEEE 802.11b/g/n) emit radio wave. Please do not
use it near a medical device, microwave, high-level electronics, TV, radio, wireless station
for mobile communication, or specied low power radio station. To use LE-series in the
place where an administrator limits the use of radio devices, follow the instruction of the
administrator.
The Wi-Fi module used for the LE-series conforms to SRRC(China), FCC (USA), CE (EU),
TELEC (Japan), KCC (Korea), ISED (Canada), NCC (Republic of China), however, as its
product (LE-series) the Wi-Fi function is available only in Japan, USA, Canada, and EU
nations in compliance with RE directive (2014/53/EU).
To use the product other than above countries, order LE-series without Wi-Fi function.
Please contact the sales department for more details.
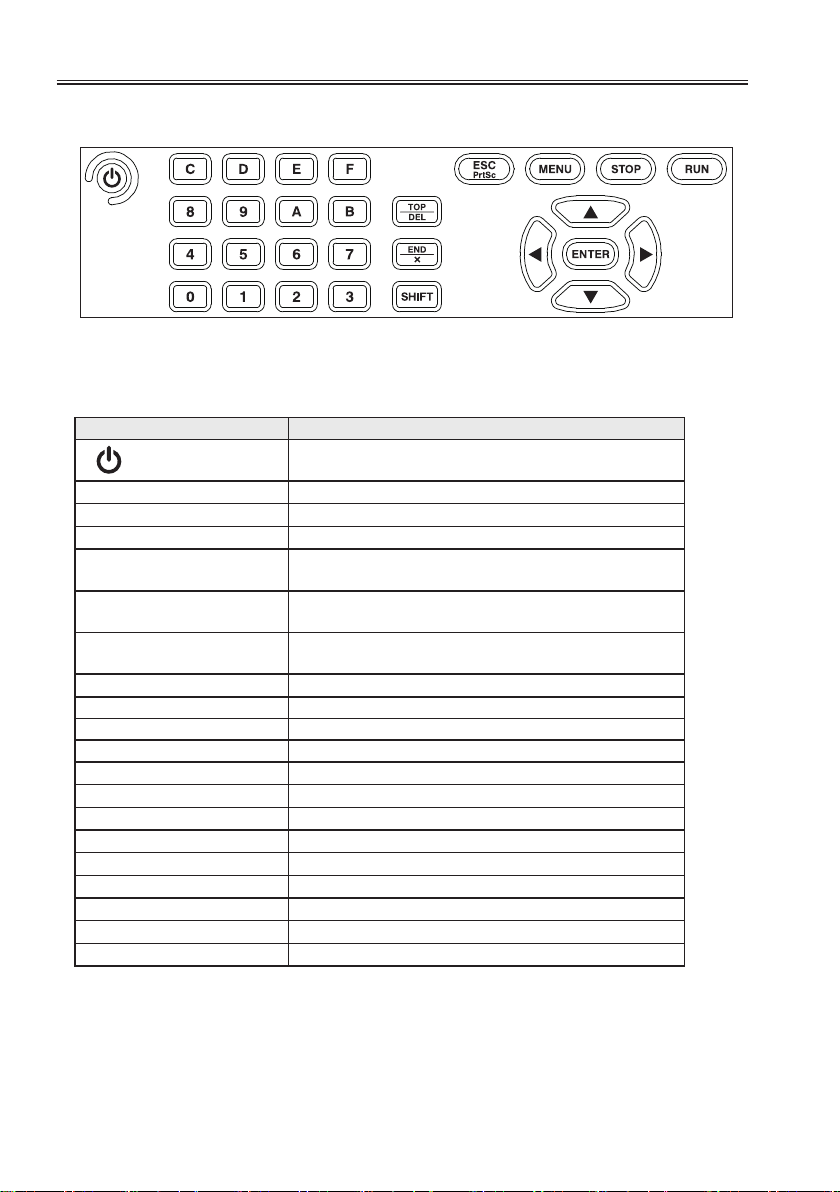
Representation of the Operating Procedure
・Key operation is described in [ ].
・Continuous key operation is described as follows.
ex) Press [MENU] and then [0] → [MENU],[0].
・Screen display is described in “ ”.
・(P-No.)indicates the referring page.
It is prohibited to reprint or duplicate any part of this manual without prior permission of LINEEYE.
The content of this manual and specication of the product is subject to change without any notice.

1
Safety Information
Please do not use the line monitor in the following conditions.
〔Description of the symbol and mark〕
Warning: There is a possibility of getting hurt, such as a death or a serious injury.
Caution: There is a possibility of getting injured or damaging the product.
● Do not disassemble, modify or repair the line monitor
This may result in an injury, electric shock, and ignition.
● Turn off the power of analyzer and unplug the cables immediately when emanating
smoke, odor or sound.
Continuous use may result in an electric shock, injure or ignition.
● Do not use the line monitor if there is inammable gas.
This may result in ignition and explosion.
● Turn off the power and unplug the line monitor immediately when liquid or foreign
substance gets into the line monitor.
Continuous use may result in ignition, electric shock and malfunction.
● Do not touch the line monitor with wet hand.
This may result in an electric shock and malfunction.
● Do not use the battery other than attached Lithium ion battery.
Do not short the electrode of the battery. Do not modify, decompose or heat the
battery.
It may cause the ignition and explosion.
● Do not give a strong impact to the line monitor.
● Do not place the line monitor in following conditions.
・ Not at or vibrated place.
・ Temperature or humidity is above the specication.
・Change the temperature rapidly. ・ Have a direct sun or near the re.
・ Magnetic eld. Have static electricity.
● Do not use the line monitor near the following devices.
・ Medical device, such as a heat pacemaker.
・ Automatic control devices easily aected by radio waves.
・Devices controlled by the radio waves.
War ning
Caution

2
Nomenclature
1)
2)
3)
4)
7)
8)9)10)11)
5)
6)
12)
16)
17)
13)
14)
15)
Name Function
1) AC adapter plug Connects the AC adapter, which serves as a battery charger.
2) Power Switch Press it for more than 1 sec to turn on/o the analyzer.
3) SD Card Slot The inlet for a SD/SDHC card.
4) USB Host Port Connection port for a USB ash drive.
5) USB Device Port USB Type-C connector connected to a PC or battery charger.
6) LAN port
RJ-45 connector. Link: LED (right), 1000BASE-T connection: LED
(left)
Used when connecting to a PC via wired LAN.
7) Interface Sub-Board The SB-R2TS1 sub-board is installed.
It can be exchanged with other optional measurement sub-boards.
8) RS-232C/RS-530 port RS-232C (V.24) and RS-422/485 (RS-530) measurement ports (*1)
Dsub25 pin (female)
9) TTL,trigger I/O port TTL measurement port and external signal I/O port. Pin header, 10
poles
10) RS-422/485 port
RS-422/485 port
RS-422/485 measurement port (*1). Detachable terminal block, 5
poles.
11) Connector for GPS antenna
SMA (female) connector
When synchronizing the time with GPS, connect the optional GPS
antenna.
12) 7 Inch Color Display Touch panel of electrostatic capacity.
13) Line State LED Display the status of measuring interface.
14) Power LED Lighting in green when using. Blinking in red when charging
battery.
15) Keypad Entering commands and other operation
16) Battery Cover Open/close when replacing the battery.
17) Hand strap Use to hold the product.
*1 : The RS-422/485 signal lines of the RS-422/485 port and the RS-232C/RS-530 port are connected
inside the unit, so do not connect them at the same time.

3
Power Supply and Battery
This analyzer runs by attached AC adapter, or built-in rechargeable battery.
ڦPower Source
This analyzer runs by attached AC adapter, or built-in Lithium Ion battery.
The battery running time is approx. 4 hours. (The running time is different by the usage of
analyzer.)
It does not run by the bus power from the USB device port.
AC adapter
ڦCharge the Battery
Built-in Lithium Ion battery is charged while the power is supplied by the AC adapter. It
is also chargeable by the bus power from the USB device port.
Power supply Analyzer Status Charge Time Power LED blinking
AC adapter OFF -About 3.5 hours Approx.1sec cycle
ON Stop measuring Max. 6 hours *1 Approx.4sec cycle
Measuring No charge No blinking
USB bus power OFF Use attached USB cable Max. 6 hours *1 Approx. 4 sec cycle
Use Type-C battery charger
etc. *2
About 4.5 hours Approx.1.5 sec
cycle
ON -No charge No blinking
*1 : This will not be full charging because of the small amount of current (approx. 160mA).
*2 : It will be the same when it connects to the PC with a USB port in Type-C connector.
This analyzer is not charged in full before shipping. To use the analyzer at the rst time, charge
it full.
Charge the analyzer under the temperature of 5 to 40 ℃. It will not start charging below 5 ℃.
If you are not going to use it for a long term, charge the battery in full. After that, try to charge
the battery every 6 months.
ڦReplacement of battery
If the analyzer can no longer drive by the battery, or the service time after charging
becomes extremely short, replace the battery.
Refer to the instruction manual for more details of replacement of battery.
Old battery has to be handled in an appropriate manner.
<Notice for battery >
● Do not short the terminal of the battery.
● Use the battery and battery charger specied by LINEEYE.
● Do not disassemble or modify the battery.
● Do not leave the product in a hot place such as in a car or near a heat source.
They may cause the battery to overheat, ignite, explode, electric shock, leak, or malfunction.
Warning

4
ڦKeys
Operations Function
[ ] Turn ON/OFF the power.
Press it for more than 1sec.
[RUN] Start monitoring, measuring or testing operation.
[STOP] Stop monitoring, measuring or testing operation.
[MENU] Return to the top menu.
[ESC] Return to the previous display.
Return to the data display from conguration.
[ ▲ ] , [ ▼ ] Scroll one data line.
Move the cursor on the condition setting.
[
▲
] , [
▲
] Scroll one character of data.
Change the setting on the condition setting.
[ENTER] Apply selected settings.
[0] ~[F] Enter numerical values.
[TOP/DEL] Delete the entry indicated by the cursor.
[END/X] Enter the data of “Don't Care”.
[SHIFT] Press to use the expanded alternate function of each key.
[SHIFT]+[TOP/DEL] Jump to the top of data.
[SHIFT]+[END/X] Jump to the end of the screen.
[SHIFT]+[ESC] Save the screen image to the storage device.
[SHIFT]+[MENU] Display/hide the description of LEDs.
[SHIFT]+[RUN] Brighter the LCD back light.
[SHIFT]+[STOP] Darker the LCD back light.
On the top menu [SHIFT]+[0] Switch to the normal mode
On the top menu [SHIFT]+[3] Switch to the hig-speed mode
* [X]+[Y] indicates the operation of pressing [X] and [Y] together at the same time.
Shortcut keys are available from [MENU] and [0] ~[F].
To go back the factory setting, press “ System Settings” -> “ Version”-> “ Factory reset”
→ [ Version ] (P9)
Key operation
There is a keyboard to input data and operate commands.

5
Initial Settings
To turn on the power, press [ ] for a
second. After displaying the opening
screen for about 15 seconds, it will start
running.
Select the language at the first time
using the analyzer. If it is selected
already, it displays the top menu.
Both LE-8500XR-RT and LE-8500X-RT
display the model number as “LE-8500X”
on the opening screen.
To set each configuration, touch the
conguration menu or select by [▲],
[▼],[
▲
],[
▲
] keys and then press
[ ENTER ].
To set each items, touch the item or
select by arrow keys or [0] ~[F] keys.
To set the current time, touch the
current time on the right bottom of the
screen.
Shortcut key [MENU], [D]
The current time is displayed in the
order of Year/Month/Day, Hour:
Minute: Second (24hour).
If using the GPS antenna, received time
from GPS is displayed.
Information of time and date is used for time stamp and Auto start/stop. Make sure to input the
current time and date precisely.

6
Basic Measurement Settings
ڦInterface : Select a measurement port of analyzer.
Shortcut key [MENU],[1]
For Simulation, select DTE or DCE
mode and polarity.
For Monitoring, polarity has to be set as
well.
Operation mode : Tap “Mode” to select
the operation mode for testing.
→ [ Monitor Function ] (P14)
→ [ Simulation Function ] (P17)
→ [ BERT (Bit Error Rate Test) Function ] (P20)
The normal monitor function is “Online”.
Depending on the function, the operating
conditions are set from “- Opt.”.
Tap “Send Table” to register the
transmission data used in the simulation
function.
ڦSwitching between the normal mode and the high-speed mode
The LE-8500X-RT can be used by switching between a normal measurement mode
and a high-speed mode that supports up to 20Mbps communication measurement. In
the high-speed mode, only Online, Manual, and PULSGEN can be used, and some
functions such as triggers and items that can be set are also dierent than the ones of
the normal mode. Press [SHIFT]+[0] on the top menu screen to enter normal mode, and
press [SHIFT]+[3] to enter the high-speed mode.

7
ڦConguration Select basic communication conditions.
Shortcut key [MENU], [0]
The items that can be set dier between the normal mode and the high-speed mode.
Protocol :
Select Asynchronous (ASYNC),
Character synchronous (SYNC/BSC),
Bit synchronous (HDLC/SDLC), I2C
or SPI
Speed :
Select from “Preset” or set any speed
in 4 significant digits with the keys
[0] to [9], [C] (decimal point), [D] (K
kilo), [E] (M mega).
Other settings such as data code, data bit, parity, stop bit need to be set for some
protocols.
BCC :
Select BCC type, begin code and end Code etc. If selecting transparent mode,select
DLE (Data Link Escape) code.
Bit sequence :
Select “LSB rst” for normal use.
Frame end time :
Set the time of non-communication state which is recognized as a frame end.
Frame end code :
Frame end code can be set up to 2 characters.
Frame end code is necessary to record time stamp.
Necessary settings are dierent in each protocol.
Auto conguration is available.
→ [ Communication Condition Auto Setting Function ] (P26)

8
ڦRecord control Set recording conditions of measured data.
Shortcut key [M ENU]、 [B]
ڧAdditional info.
Idle time :
Select ON/OFF of idle time
(noncommunication time) and time
resolution.
Cannot be set in high speed mode.
Time stamp :
Select ON/OFF of time stamp and
time resolution.
Synchronization :
Set this to synchronize the timestamp
with the GPS/PPS signal.
Line state :
Mark on the check box, then status of RTS, CTS, DCD, DTR, DSR, RI and
TRG(trigger input) are recorded along with data.
ڧCapture Buer :
Recording Area :
“BUF0” means full buffer. “BUF1/
BUF2” means capture buffer is
divided into two and use half of them
for recording.
Protected :
Prevent data stored in the buffer
memory from being inadvertently
overwritten.
Write Control :
Select Ring buer (endless recording) or Full stop when the capture buer is full.
ڧAuto Save
Set the conditions for automatic saving of the measured data to a storage device such
as a USB memory.
→ [ Auto Save ] (P24)
→ [ Auto back-up function ] (P25)
ڧAuto Run
Start measuring automatically at the specic period of time.
→ [ Auto Run Function ] (P25)
ڦTrigger Set the trigger conditions.
→ [ Trigger setting ] (P21)
ڦWave monitor Set the conditions of logic analyzer function.
→ [ Timing Waveform Measurement Function ] (P23)

9
System Setting and Version
Touch “System Settings” from top menu.
Touch each tab or press [SHIFT]+[ ] , [SHIFT]+[ ]
ڧDisplay / Power
Set each setting of backlight
brightness, backlight setting for power
saving mode, auto power off, and
saving location for screen shot.
Press [SHIFT]+[ESC] to save the
screen images
Auto Power Off function does not
work during measurement.
ڧNetwork
Set each setting for wired LAN and
wireless LAN. As a factory setting,
wireless LAN is turned o. To change
the setting of wireless LAN, touch
“Setting change” and select “station
mode” or “access point mode”.
LE-8500X-RT does not have the
wireless function
ڧLanguage
Select language from Japanese or
English.
ڧVersion
Serial number and firmware version
are displayed.
It is able to update the firmware and
reset the rmware.
▲
▲
Shortcut key [MENU],[C]

10
Connect to the Target Devices
Set the measurement port of this analyzer on the interface setting screen.
ڦConnect to RS-232C
Connect RS-232C connectors of the target devices to the RS-232C port of analyzer
using monitor cable.
ڧFor monitoring
ڧFor Simulation
Connect analyzer and target device one by one.
Connect as following, concerning the specication of target device (DTE/DCE) and
RS-232C cable.
RS-232C Cable
RS-232C Port
Dsub25
Dsub25-9
(conversion
adapta)
Both Dsub 9 pin
connector
Dsub9
MONITOR Cable
(Dsub 9pin)
RS-232C Port
Dsub25
Either is Dsub 25
pin connector
MONITOR Cable
RS-232C Port
DTE device -----Straight cable ---- Analyzer (DCE setting)
DCE device -----Straight cable ---- Analyzer (DTE setting)
DTE device ----- Cross cable ---- Analyzer (DTE setting)
DCE device ----- Cross cable ---- Analyzer (DCE setting)
If the connectors of both target devices
are Dsub 9 pin, use attached Dsub 9 pin
monitor cable (LE-009M2) and Dsub
25-9 conversion adapter to connect to the
analyzer
If the connector of either target device
is Dsub 25 pin, use attached Dsub 25
pin monitor cable (LE25M1) to connect
to the analyzer.
Shortcut key [MEN U],[1]

11
ڦConnection to RS-530, X.20/21, RS-449, V.35
By connecting an optional measurement cable to the RS-232C/RS-530 port of this unit,
you can execute a data monitoring and fault diagnosis not only for devices with RS-530
interfaces, but also for devices with X.20/21, RS-449, and V.35 interfaces.
This port can also be used to measure RS-422 lines with control lines such as RTS and
CTS.
For details on the signal arrangement, see the instruction manual.
Option Name Model Description
X.21 monitor cable LE-25Y15 DSUB 15pin, Y branch, for X.20/21
RS-449 monitor cable LE-25Y37 DSUB 37pin, Y branch, for RS-449
V.35 monitor cable LE-25M34 M type 34pin, Y branch, for V.35
RS-530 cable LE-25S530 DSUB 25pin, for RS-530
Terminal block for DSUB
25 pins LE-25TB LE-25TB All the signals of DSUB 25pins can be taken from the
25pin terminal block
ڦConnect to RS-422/485
Connect appropriate signals of target device to the
RS-422/485 port.
Connect TXD+ and TXD-, and RXD+ and RXD- using
twisted pair cable.
ڧRS-422 Full-duplex
Monitoring between A and B Simulating
< RS-422/485 port >
*This is the removable terminal. Remove
it from analyzer first, connect cables
and return it to the analyzer.
R : Terminal resistance

12
ڦConnect to TTL interface
Connect appropriate signals of UART, I2C and SPI to the TTL port of analyzer using
attached probe cable.
ڧRS-485 Half-duplex
Monitoring/Simulating
When this unit is the end of the line, remove the interface sub-board from the main unit,
turn on the DIP switch, and connect the 120 Ω terminating resistor.
TTL port
1
2
9
10
*1: 2.54mm pitch. Equivalent to “HIF3FC-10PA-2.54DS(71)” of
HIROSE Electric.CO.,LTD.
*2: It is used for output of simulation, except SPI slave simulation (SS
and SCK are inputs).
*3: TTL voltage (max. 30mA) is outputted when simulating.
MIL box type 10pin header *1 Cable color
Signal Name Pin Input/
Output
LE-5LS
TXD,I2C
of
SDA,SPI
of
SDO 1I/O *2 Brown
RXD,SPI of SDI 3 I Red
RTS,SPI of SS(CS) 5I/O *2 Orange
CTS,I2C of SCL,SPI
of
SCK 7I/O *2 Yellow
Signal ground 9 - Green
Signal ground 2 -
IN: Trigger input 4 I
OT1: Trigger output 1 6 O
OT2: Trigger output 2 8 O
PWR: Power for external*3 10 -
DIP switch
Switch
Number
Signal
Name
Switch
Number
Signal Name
1 TXD 6RTS
2TXC1 7DTR
3RXD 8CTS
4 RXC 9DSR
5 TXC2 0DCD

13
ڧExternal Trigger Terminal
External trigger input level is LVTTL (3.3V). External trigger output is open collector
output type and pulled up in 5V by 10KΩ in the analyzer.
Attached 5-wire TTL prove can be used for connection of external trigger. To use the
TTL proves for both TTL and external trigger, prepare additional one.
→ [ Trigger Function ] (P21)
5wire TTL probe (LE-5LS)
If the target devices are easily affected by radiation noise from the
analyzer, try to use the shielded cable and add the ferrite core on the
cable.
ڦGPS, external PPS connection device
The time stamps can be synchronized by the PPS signals obtained from GPS or external
PPS devices (such as LE-8500X or LE-8600X with a GPS antenna connected).
length : 360mm
〔Option〕
GPS
GPS antenna
Trigger I/O port
PPS device
Coaxial Cable for PPS Synchronization
LE-SMA-LS-2
To use one GPS active antenna and synchronize 2 sets of LE-8500X-RT, connect
devices as following.
PPS signal I/O cable LE-PPS-2
GPS
GPS antenna
Trigger I/O port Trigger I/O port

14
Monitor Function
ڦStart and Stop measurement
Press [RUN] to start monitoring. Measured data is displayed at real time and recorded
in the capture memory. Send (TXD) data and receive (RXD) data are displayed in two
lines as a pair. The latest data is displayed on the left side of “ ” marker. Press [STOP]
to nish measuring
When TXD and RXD are generated at the same time, they are displayed on the same column.
Tap [Pause Display] to pause only the screen display.
It is able to stop measuring automatically by setting the trigger function and record control (full
stop setting on capture memory).
Errors and breaks are displayed in unique characters.
Character Description
Parity Error (parity bit error).
Framing Error (stop bit is “0”).
Parity & Framing Error .
Break (start bit, character bit, (parity bit), stop bit are all “0”.).
Abort (7bits or more of “1” is continuously detected).
Short Frame (frame length is short).
Block check code normal (BCC or FCS is abnormal)..
Block check code abnormal (BCC or FCS is abnormal).
HDLC starting ag pattern (7Eh) is detected.
HDLC ending ag pattern (7Eh) is detected.
Multi processor bit or acknowledge bit of I2C is “1”. (displayed in
blue back).
I2C (re)start sequence is detected.
I2C stop sequence is detected.
Overrun Error
Overload (Cannot save all data by auto save function ).

15
1) Measuring 〔 〕 , Pause 〔 〕
2) Current available capture buer.
3) Measurement data position displayed at the top of the screen.
4) Description of the current window.
5) Wi-Fi status (bright display when IP address is acquired or access point is ready)
Not displayed on the model that do not support Wi-Fi.
6) Wired LAN status (bright display when IP address is obtained)
7) USB device port status (bright color when connected. `` '' display when in super speed)
8) USB host port status (bright color when recognizing, red when writing)
9) SD card slot status (bright color when recognized, red when writing)
10) Displays the remaining battery level. Displays “ ” when power is supplied from an
external source.
11) Switches the measurement data display mode each time you tap *1
12) Display of control line
13) Current data code. Tap to select
14) Tap to switch between hexadecimal display and data code display
15) Jump to specied location
16) Start search operation
*1: Switches to the display enabled in the recording settings and communication protocol settings.
Scroll data by swiping on the screen.
Swipe in upward to look older data.
Swipe in downward to look newer data.
Press [SHIFT]+[▲]or [SHIFT]+[▼]to go to next/ previous page.
Do not remove the USB ash drive and SD card while measuring and
displaying “under cleanup”.
1) 5) 6) 7) 8) 9) 10)
16)15)14)13)12)
11)
2) 3) 4)

16
Signal Delay and Signal Voltage Measurement(Delay) /
Statistical Analysis (TREND)
ڦSignal delay & voltage measurement(Delay)
Tap “Mode” on the top menu screen,
select “Delay”, and tap “Delay Opt.”
Not available in the high-speed mode.
Set the start/ stop conditions of delay
time for target signals.
Press [RUN] to display the delay time
and voltage (max./ min.).
Use “Wave monitor” for delay time less
than 0.1ms.
ڦStatistic Function (Trend)
Tap “Mode” on the top menu screen, select “Trend”, and tap “Trend Opt.”
Not available in the high-speed mode.
EVENT :
Select “Data”, “Frame” or “Trigger” to
calculate.
Trigger: The number of the events which
satisfies the trigger conditions set in
factor of “TRIGGER 0” and “TRIGGER
1” are counted.
Press [RUN] to start the statistic.
As unit time of statistical processing
passes, the results of calculated value
will be updated on a bar graph.

17
Simulation Function
You can execute a communication test for a device in development by sending/receiving
data by the analyzer depending on the selected mode.
In the high-speed mode, only Manual mode and PULSGEN mode are available.
ڦRegistration of Transmission Data
Select a function that uses test data transmission, such as Manual, from the top menu
screen “Menu”, and tap “Send Table” to display the transmission data table screen.
Up to 160 types of data can be registered
in the 160 tables of 0 to 9 groups (each
group has 16 tables). Touch the table and
group to register the data in it.
Input the data to be transmitted in HEX
by [0] to [F].
Copy and paste of the data are available
by [ENTER], [ ], and [ ] .
Tap “ Set/Cancel Parity/MP” to turn
the data at the cursor position into a
parity error or multiprocessor bit ON,
and tap again to return to normal.
You can input text by touching “Text
input”
Input it switching capital letters and
symbols and then tap [ENTER] or, the
character string you entered will be
entered at the original cursor position.
By tapping “Edit Option”, you can
execute a copy between tables, import
from monitor data, etc. Select a
command to execute it.
▲
▲

18
ڦStart and Stop measurement
Touch [RUN] to start the specied test function and touch [STOP] to stop it.
When the analyzer is set to DTE, The TXD line means the data is transmitted from the analyzer.
When the analyzer is set to DCE, the RXD line means the data is transmitted from the analyzer.
ڧManual Mode
Checking the data from the connected device on the display, you can transmit the
preset data which you registered in advance by touching [0] to [F] or [SHIFT]+[0] to
[SHIFT]+[D].
While putting [SHIFT], the control guide for preset data is displayed.
It can output break signal by [END/X].
You can specify the interval of each data, on/o of repeated transmission, and the interval of
data frame.
ڧBuer mode
From the transmission/reception
data captured in the memory by the
monitor function, the data of the
transmission side or the reception
side set in advance is transmitted as it
is.This mode is useful for reproduction
tests using the same data as the
communication status monitored on-
site.
ڧFlow Mode
This unit becomes the transmission
side or reception side, and stats the
simulation of flow control using
X-ON/OFF and control lines.
When “Send test” is set, it can display
the data of transmission between
the start of transmission and the
interruption request for 16 times.
In “Receive test”, you can specify the number of reception data until the transmission
interruption request is issued and the time until the restart request of transmission is
sent.
Other manuals for LE-8500XR-RT
1
This manual suits for next models
1
Table of contents
Other LineEye Test Equipment manuals
Popular Test Equipment manuals by other brands

Keysight Technologies
Keysight Technologies InfiniiVision 1000 X Series user guide

YOKOGAWA
YOKOGAWA PBL100 user manual

BEHA
BEHA UNITEST M-Indicator 9062 instruction manual

RHEINTACHO
RHEINTACHO RT STROBE pocketLED LASER operating instructions

Tietzsch
Tietzsch MultiSafe TT 3 User instructions

Agilent Technologies
Agilent Technologies 85050C User's and service guide