Metrix HX0074 User manual

EN - User’s manual
SIGNAL GENERATOR CIRCUIT
HX0074 DEMO KIT FOR
SCOPIX IV

2
CONTENTS
GENERAL DESCRIPTION ...................................................................................................................................................................................3
PRESENTATION ...................................................................................................................................................................................................3
1. MISCELLANEOUS............................................................................................................................................................................................4
2. HYSTERESIS ....................................................................................................................................................................................................5
3. PULSE TRAIN ...................................................................................................................................................................................................6
4. DATA TRAIN + CS.............................................................................................................................................................................................7
5. DATA FRAME - FAULT .....................................................................................................................................................................................8
6. AMPLITUDE-MODULATED SINE WAVE........................................................................................................................................................9
7. SQUARE WAVE-RISE TIME ..........................................................................................................................................................................10
8. SQUARE WAVE - LOW LEVEL - NOISY ......................................................................................................................................................11
9. COMB OF RAPID PULSES............................................................................................................................................................................12
10. DIGITAL FRAME + FAULT ...........................................................................................................................................................................13
11. FRAME + RARE PULSE...............................................................................................................................................................................14
12. FRAME ...........................................................................................................................................................................................................15
13. HEART RECORDER.....................................................................................................................................................................................17
14. HARMONICS .................................................................................................................................................................................................18
15. DISTORTION .................................................................................................................................................................................................19

3
GENERAL DESCRIPTION
The oscilloscope kit features a circuit which generates 15 varied and representative signals, along with a guide that describes the nature of each
signal. The METRIX oscilloscope model used to perform the test and the correct calibrations for the equipment to obtain optimal visualisation.
The guide demonstrates the majority of the standard or advanced functions of these Digital Oscilloscopes, there by enabling users to familiarise
themselves rapidity, but also promotes further understanding of how digital oscilloscopes function in general so that best use can be made of them.
It features direct support for the following METRIX SCOPIX IV digital oscilloscopes, but can be used with other models, insofar as they oer the
same functions.
Range Models
SCOPIX IV OX 9062 OX9102 OX9104 OX9304
PRESENTATION
The signal generator circuit is built around a microprocessor. An LCD display 2 «UP/DOWN» buttons let you select the desired signal. It has two
channels available via BNC connection: «MAIN» and «AUX». It can be powered by a standard 9 V battery or a mains adapter used to power
METRIX Handscope oscilloscope (selection of power supply by switch), for example.
The HX0074 can be powered:
- either by a standard 9 V battery
- or via an external mains adapter (12 VDC, 1.25 mA), with negative-polarity body, as used with the METRIX oscilloscopes such as the
Handscope, for example.
The power supply mode is selected by using the switch.
The instructional manual contains a table of contents, which lists all the signals available and the models concerned, a description page for each
signal.
Familles SCOPIX IV Pages
n°1 : Miscellaneous 4
n°2 : Hysteresis 5
n°3 : Pulse train 6
n°4 : Data + CS Train 7
n°5 : Data Frame - Fault 8
n°6 : Amplitude-modulated sine wave 9
n°7 : Square wave-Rise time 10
n°8 : Square wave, low level, noisy 11
n°9 : Comb of rapid pulses 12
n°10 : Digital frame + Fault 13
n°11 : Frame + Rare pulse 14
n°12 : Frame 15
n°13 : Heart recorder 17
n°14 : Harmonics 18
n°15 : Distortion 19

4
1. MISCELLANEOUS
Demo: with: SCOPIX IV
Test signal n°1 : Miscellaneous
Nature 4 pairs of successive signals approx. every 2 seconds
Specs 2.6 V < Vpp < 3.2 V - 10 Hz < F < 60 Hz
Oscilloscope Settings 20 ms/div. - MAIN = 500 mV/div. - AUX = 500 mV/div.
Trigger standard on MAIN
Modes XY (Display menu) - neither «Min/Max», or «Repetitive Signal» (Horizontal menu)
Objectives Start in a playful manner by describing the dierent display modes:
Normal, Full Trace, Full Screen, XY
a) Adjust the oscilloscope so as to display the signals correctly (possible using the «Autoset» key).
Normal mode
b) Perform the «Full Trace» «Full Screen» commands in sequence in order to avoid superposition of traces, then assign the full screen to the
display of traces.
Full Trace Full Screen
c) Return to the initial Normal display and select the “XY” mode with CH1 on X and CH4 on Y. A sequence of geometric forms will be displayed
(heart, clover, rose, spiral).
To realize copies screen by the touch and review by the viewer.
Clover Heart Spiral Rose

5
2. HYSTERESIS
Demo: with: SCOPIX IV
Test signal n°2 : Hysteresis
Nature 2 phase-shied signals, triangle and pseudo-square
Specs Vpp ≈ 3.2 V - F ≈ 1.7 kHz - square rise time ≈ 24 µs - Signal delay ≈ 40 µs
Oscilloscope Settings 200 µs/div. - MAIN = 500 mV/div. - AUX = 500 mV/div.
Trigger standard on MAIN
Modes XY (Display menu) - neither «Min/Max», or «Repetitive Signal» (Horizontal menu)
Objectives
«X(t)» and «XY» modes from phase-shied signals
Present automatic measurements with markers (F, Square rise time)
Mathematical function
a) Adjust the oscilloscope so as to display the signals correctly (possible using the «Autoset» key).
in full screen
b) Select the XY mode with CH1 on X and CH4 on Y ; add 20 automatics measurements.
Time rise with cursor and per channel
This casebook example involving a hysteresis loop is often used for educational purposes. It demonstrates the relative interests in displaying the
channels on a time basis and an XY display mode. It is used to demonstrate the simplicity of conguring the XY mode and of access to automatic
phase measurement, which is one of its uses.
c) Mathematical function created on channel 2 math 2 = (ch1 x ch2) / divv. (5).
and math 3
Divh (1) is equivalent to 10 000 samples (points) = 1 div. horizontal
The result of the multiplication is translated into division in the screen. If Vmax (ch1) = 4 div. and Vmax (ch2) = 4 div., it would have been necessary
to divide the result to 16+ div. then by divv. (4) to obtain Vmax (math3) = 4 div. During the use of mathematical functions (oces) associated with
tracks, it is necessary to verify the dynamics of the obtained result. A correction of the result (prot) of the operations by the mathematical functions
(oces) (divv(), divh() / ...) is advised to optimize the display into division in the screen.

6
3. PULSE TRAIN
Demo: with: SCOPIX IV
Test Signal n°3 : Pulse train
Nature 1 signal presenting trains of 10 pulses with a variable interval
Specs Vpp ≈ 3.4 V - F ≈ 32 kHz - Train interval ≈ 100 to 180 µs
Oscilloscope Settings 100 µs/div. - MAIN = 500 mV/div
Trigger on MAIN - Hold-O ≈ 350 µs
Modes Triggered mode preferable - Deselect «Repetitive signal» (Horizontal menu)
Objectives
Triggering with «Hold-O» on pulse trains
Automatic measurement with zone selection using manual cursor
Compare to reference
a) Adjust the oscilloscope so as to view the CH1 signal correctly (time base, sensitivity, and triggering source).
Attention, with this type of signal, «Autoset» operation may be aleatory.
Firstly, without «Hold-O», the trigger operates on any one of the pulses as soon as the oscilloscope is ready to acquire. This is accompanied by
a sensation of “horizontal instability” which renders the display unusable. The correct selection of the “Hold-O” parameter in the “Principal” tab of
the trigger menu will enable you to systematically trigger on the rst pulse in the train.
To do this, double-click in the corresponding digital zone and enter the value of 350 µs, for example. This value must be greater than the pulse train
duration in order to inhibit the trigger during this period, while remaining lower than the interval between two pulse trains (this varies between 400
and 480 µs).
To do this, double-click in the corresponding digital zone and enter the value of 350 µs, for example 350e-6.
2 measurement markers
b) Measure the variable time between 2 trains of impulses then Zoom then fast Comparison to a reference.
Press the key to create a reference.
Move the active track to be able to compare it with the reference.
We highlight clearly that the number of impulses in the train remains identical (10), but that the interval between trains varies.
Press the key again to delete the reference.

7
4. DATA TRAIN + CS
Demo: with: SCOPIX IV
Test Signal n°4 : Data train + CS
Nature 2 signals representing a digital frame (data) and a CS (chip select)
Specs Vpp ≈ 3.4 V - F ≈ 40 kHz (data) - F ≈ 1.5 kHz (CS)
Oscilloscope Settings 200 µs/div. - MAIN = 1 V/div. - AUX ≈ 1 V/div.
Trigger Principal on MAIN and Auxiliary on AUX
Modes Triggered mode preferable - Deselect «Repetitive Signal» (Horizontal menu)
Objectives Complex triggering with pulse count
«WinZoom»on pulse train
a) Adjust the oscilloscope to display simply the 2 signals (time base, sensitivities and triggering source on AUX).
Attention, with this type of signal, «Autoset» operation may be aleatory.
Ch1 Data (MAIN) and Ch2 CS (AUX)
b) We will now demonstrate the interest of complex triggers (2 sources) with the «count» or «delay» options.
The example provided will enable the synchronisation of an auxiliary signal, the Chip Select, with triggering on the desired pulse in the data frame.
Additionally, this mode will enable us to always trigger on the same pulse even if it does not arrive at an identical interval after the chip select
(pulses 4 to 9).
Trigger parameters: - Principal tab: MAIN front ; Hold--O minimum.
- Count tab or Count tab Qualier: AUX front ; DC coupling ;
Trigger delay < 9 (3 in the example)
c) Zoom graphic is a unique functionality and very impressive during demonstrations.
Using a time base of 200 µs/div., graphically select the rst group of 3 pulses and release to obtain the result Zoom simultaneously with waveform..
8
5. DATA FRAME - FAULT
Demo: with: SCOPIX IV
Test Signal n°5 : Data frame - fault
Nature 2 signals representing a communication bus with «clock» and «data»
Specs Vpp ≈ 3.4 V - F ≈ 31 kHz (clock) - 30 µs < L+ < 200 µs (data)
Oscilloscope Settings 20 or 25 µs/div. - MAIN = 1 V/div. - AUX = 1 V/div.
Trigger on MAIN, pre-trigger ≈ 1 division
Modes Triggered mode preferable
Objective Triggering on pulse width of the AUX signal
a) Adjust the oscilloscope so as to display the 2 signals in Normal mode (time base, sensibility, Triggering source on MAIN).
Attention, with this type of signal, «Autoset» operation may be aleatory.
selected dierent kind of display mode: vector, envelope and all acquisition.
b) Trigger on pulse on AUX on socket.
In normal «Oscilloscope» display mode, select to trigger on the AUX signal pulse width («Trigger» menu «Pulse» tab).
Successively change the value so as to trigger on the dierent periods (32, 64, 96, 128, 160, 192 µs ...) by using the operators «<», «=» or «>».
Add cursors to calculation and time measurement to compare.

9
6. AMPLITUDE-MODULATED SINE WAVE
Demo: with: SCOPIX IV
Test Signal n°6 : Amplitude-modulated sine wave
Nature 1 amplitude-modulated sinusoidal signal
Specs 1.3 V < Vpp < 3.3 V - F ≈ 1.3 kHz
Oscilloscope Settings 100 µs/div. - MAIN = 500 mV/div.
Trigger on MAIN, 50 % of Vpp
Modes Triggered mode preferable
Objectives
Display a fast-changing signal (e.g.: modulation)
Using «Envelope» mode
FFT + windows
a) Adjust the oscilloscope so as to display the signals correctly (possible using «Autoset» function).
«Oscilloscope» and «enveloppe» modes rough visualisation of the signal (Vpp max, modulation rate, frequency, ...).
b) FFT + waveform simultaneously
The Fast FOURIER Transform (FFT) is used to calculate the discrete representation of a signal in the frequency domain from its discrete
representation in the time domain.
It is calculated on 2500 points.
c) Before calculating the FFT, the oscilloscope weights the signal to be analyzed by a window that acts as a bandpass lter. The choice of type of
window is essential to distinguish the dierent spikes of a signal and make accurate measurements.
The total duration of the study interval results in a convolution in the frequency domain of the signal with a function sinx/x.
This convolution modies the graphic representation of the FFT because of the characteristic lateral lobes of the sinx/x function (unless the study
interval contains an integral number of periods).
Five weighting windows are proposed.
Eects of under sampling on the frequency representation: If the sampling frequency is too low (less than the twice the cut o frequency
of the signal to be measured), the high-frequency components are under sampled and are aliased (frequency-shifted)
in the graphic representation of the FFT.

10
7. SQUARE WAVE-RISE TIME
Demo: with: SCOPIX IV
Test Signal n°7 : Square wave-Rise time
Nature 1 square wave, duty cycle 50 %
Specs Vpp ≈ 3.4 V - F ≈ 10 kHz - Rise time ≈ 800 ns
Oscilloscope Settings 500 ns to 200 µs/div. - MAIN = 500 mV/div.
Trigger on MAIN, 50 % of Vpp
Modes Triggered mode preferable - Select «Repetitive signal» (Horizontal menu)
Objectives Using «zoom» for rise time
ROLL if base time > 100 ms
a) Adjust the oscilloscope so as to display the signal correctly (possible using the «Autoset» function) and add T1 and T2.
20 automatic measurements
b) Use «zoom» to characterise a rising edge
All acquisition, measure Trise
c) Select single mode, automatic release of the mode ROLL if base time > 100 ms. The new samples are shown as soon as they were acquired
and the mode ROLL is activated as soon as the memory is full (scrolling of the track of the right towards the left of the Screen).
11
8. SQUARE WAVE - LOW LEVEL - NOISY
Demo: with: SCOPIX IV
Test Signal n°8 : Square wave, low level, noisy
Nature 1 square wave of very low amplitude and very noisy
Specs 5 mV < Vpp < 30 mV (depending on ltering) - F ≈ 1 kHz
Oscilloscope Settings 200 or 500 µs/div. - MAIN = 2.5 or 5 mV/div.
Trigger on MAIN, 50 % of Vpp
Modes nothing at rst, then 1.5 MHz and 5 kHz low-pass ltering on the input
Objectives
Triggering and display for a noisy signal
Use of 15 MHz and 1.5 MHz lters with 5 kHz on the input
Use of the «averaging» function
a) Adjust the oscilloscope so as to display the signal approximately.
Attention, with this type of signal, «Autoset» operation may be aleatory.
At rst, after using the Autoset function or basic manual calibration, the signal form can be seen, but the trigger does not function correctly. As the
signal is weak and noisy, use of the noise rejection function in the Trigger menu does not systematically provide a solution, no more than HF rejection.
b) The use of the 1.5 MHz and 5 kHz analogue lters on the input will enable correct synchronisation and analysis of the signal free of any noise.
1.5 MHz lter
c) Use of averaging or curve smoothing (Horizontal menu) enables elimination of random noise on the visualisation (signal step serving as a trigger)
and measurement of very weak levels after a vertical zoom.

12
9. COMB OF RAPID PULSES
Demo: with: SCOPIX IV
Test Signal n°9 : Comb of rapid pulses
Nature Comb of 6 very brief pulses, with a low repetition frequency
Specs Vpp ≈ 2 V (depending on whether 50 Ω load or not) - F ≈ 8 kHz
Oscilloscope Settings 50 µs/div., then 50 ns/div. - MAIN = 500 mV/div.
Trigger on MAIN, 50 % of Vpp
Modes First deselect «Repetitive signal» (Horizontal menu)
Objectives Use of the «Min-Max» acquisition mode
Interest of ETS in faithful and precise representation of signals
a) Adjust the oscilloscope so as to display the signal approximately.
Attention, with this type of signal, «Autoset» operation is in principle impossible.
Result of initial calibration Selection of «Min-Max» acquisition mode
The initial calibration enables an occasional sighting of a brief pulse with a variable amplitude, here or there. Selecting the “Min-Max” Acquisition
Mode from the “Horizontal” menu without changing the time base speed will enable the acquisition and visualisation of the signal as demonstrated
in the second screen.
Due to very brief duration of the pulses in relation to their frequency of repetition (≈ 500 µs / time relationship ≈ 1000), the time base chosen
imposes a sampling frequency that is inadequate for correct visualisation on the screen. The “Min-Max” mode enables detection of the presence
of “Min” and “Max” peaks between normal sampling points, the acquisition of the amplitude of these signals and their representation on screen.
b) Secondly deactivate the “Min-Max” Acquisition mode and calibrate the time base to 25 or 50 ns/div. in order to examine the signal in further
detail and discover a group of 6 pulses. Select “Repetitive signal” in the same Menu in order to authorise ETS sampling and show the dierence
between displays with and without ETS. For to exceed the maximum “single-shot” sampling rate, so as to obtain faithful representation and precise
measurements until 400 Gs/s..
The example below presents pulses with zoom of sampling and 400 Gs/s with ETS mode.

13
10. DIGITAL FRAME + FAULT
Demo: with: SCOPIX IV
Test Signal n°10 : Digital frame + fault
Nature Digital frame with a recurrent fault
Specs F square ≈ 5 MHz, Vpp ≈ 1.8 V - L+ fault ≈ 7 ns
Oscilloscope Settings 25 or 50 ns/div., then 5 µs/div. - MAIN = 500 mV/div. DC coupling
Trigger DC coupling on MAIN, level ≈ 250 mV
Modes Select «Repetitive Signal» (Horiz menu)
Objectives Using triggering on pulse width
Use of «Min-Max» mode on digital frame
a) Adjust the oscilloscope so as to display the signal approximately (possible using the «Autoset» function), then set the parameters as indicated below.
You will notice that the display is not stable.
Then set up a pulse-width trigger as indicated below, and increase the time base speed in order to allow detailed analysis of the fault on the digital
frame.
Trigger «Pulse < 20 or 40 ns»
b) Next you can use a slower time base, for example 5 µs/div. in order to observe the general composition of the digital frame.
Depending on the sampling speed used by the instrument, use of the “Min-Max” mode may be indispensable to obtain a correct representation
of the signal.
with «Min-Max»

14
11. FRAME + RARE PULSE
Demo: with: SCOPIX IV
Test Signal n°11 : Frame + rare pulse
Nature Digital clock signal with a fault
Specs F clock ≈ 5 MHz, Vpp ≈ 3.3 V
Oscilloscope Settings 100 or 125 ns/div., then 25 ns/div. - MAIN = 500 mV/div. DC coupling
Trigger DC coupling on MAIN, level ≈ 1.8 V
Modes Triggered mode preferable
Objectives Acquisition and display of a rare fault
FFT + HARMONIC analyser
a) Adjust the oscilloscope so as to display the signal approximately (possible using the «Autoset» mode), then set the parameters as indicated
opposite.
b) The signal displayed represents a digital clock at 100 ns.
By paying attention, it may be possible to spot a certain instability of some edges of the signal.
FFT analyser with linear scale and you can add cursor to have frequency fault measurement.
c) Select Harmonic analyser mode to catch rare fault with fundamental frequency between 50/60 or 400 Hz.
Save the Harmonic les. Open the “harm.txt” les in memory to analyse on spreadsheet program on PC.

15
12. FRAME
Demo: with: SCOPIX IV
Test Signal n°12 : Frame
Nature Digital clock signal presenting a fault
Specs F clock ≈ 5 MHz, Vpp ≈ 3.3 V
Oscilloscope Settings 100 or 125 ns/div. then 25 ns/div. - MAIN = 500 mV/div. DC coupling
Trigger DC coupling on MAIN, level ≈ 1.8 V
Modes Triggered mode preferable
Objectives Logger + multimeter modes
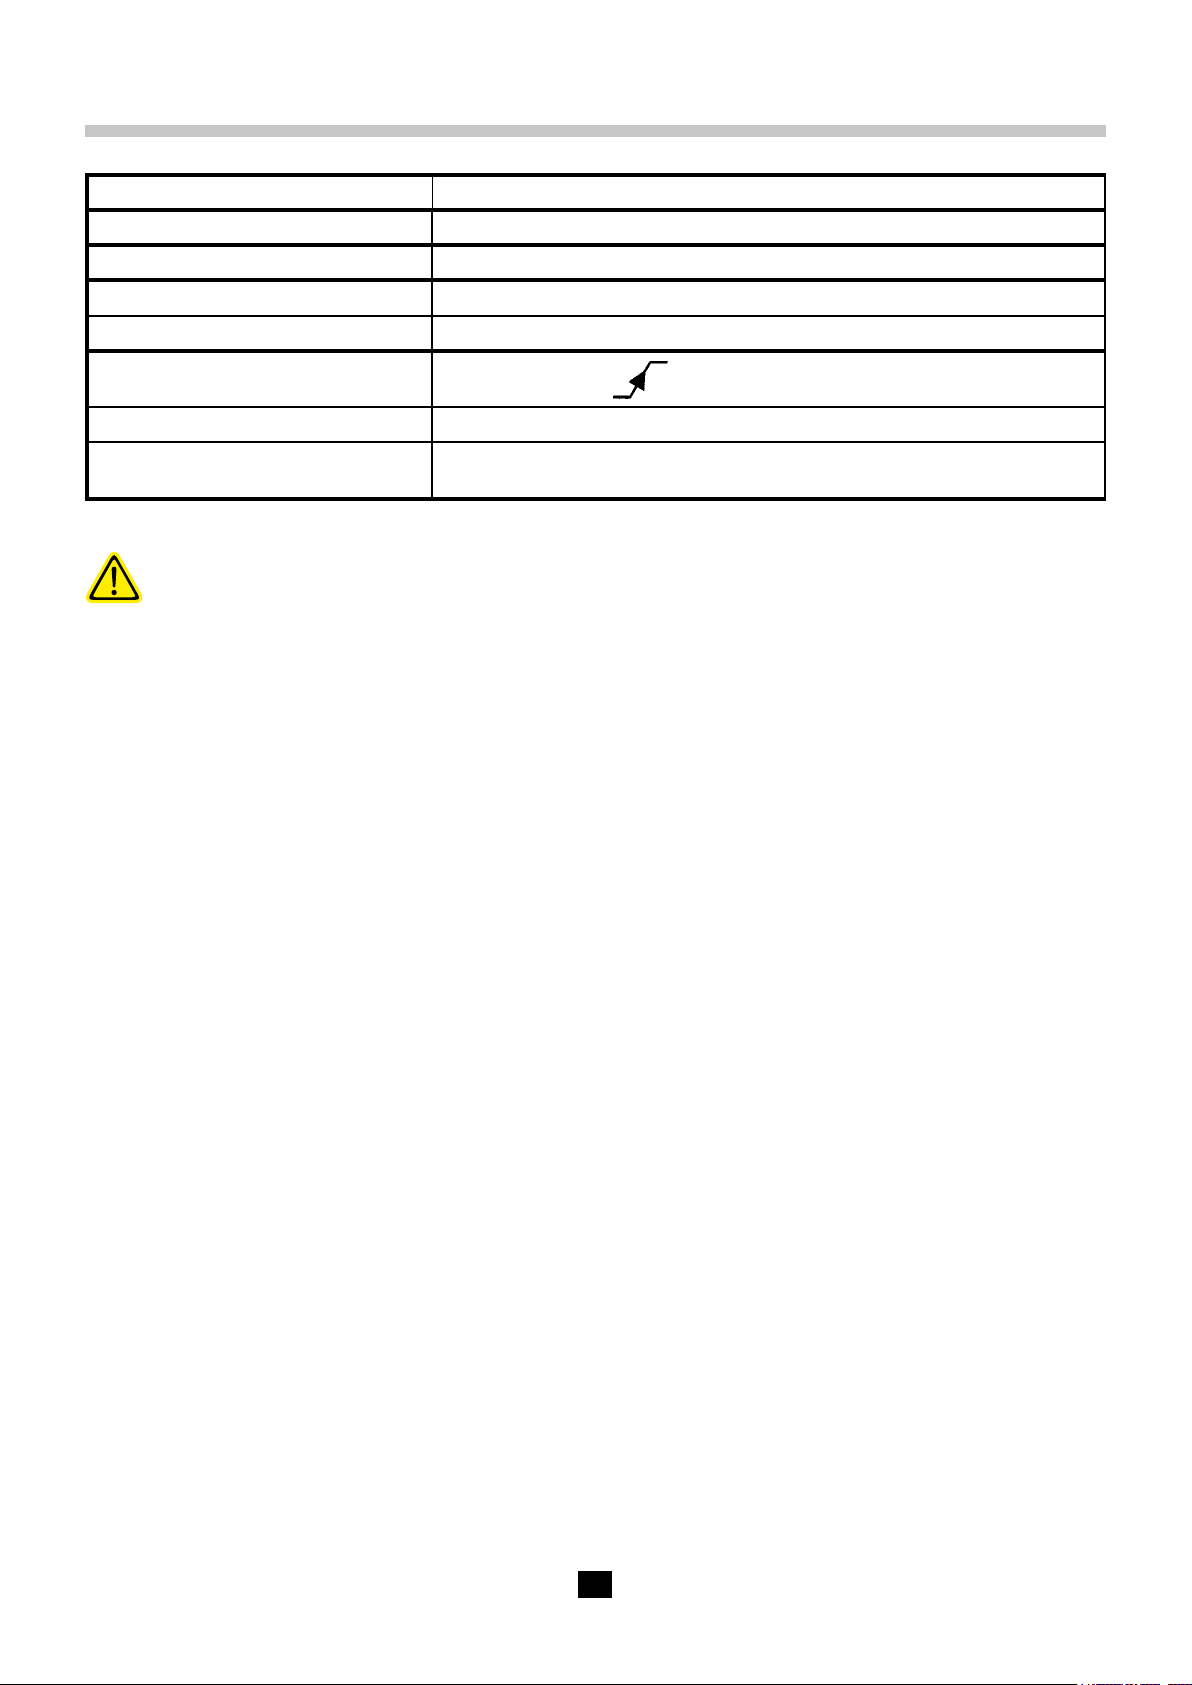
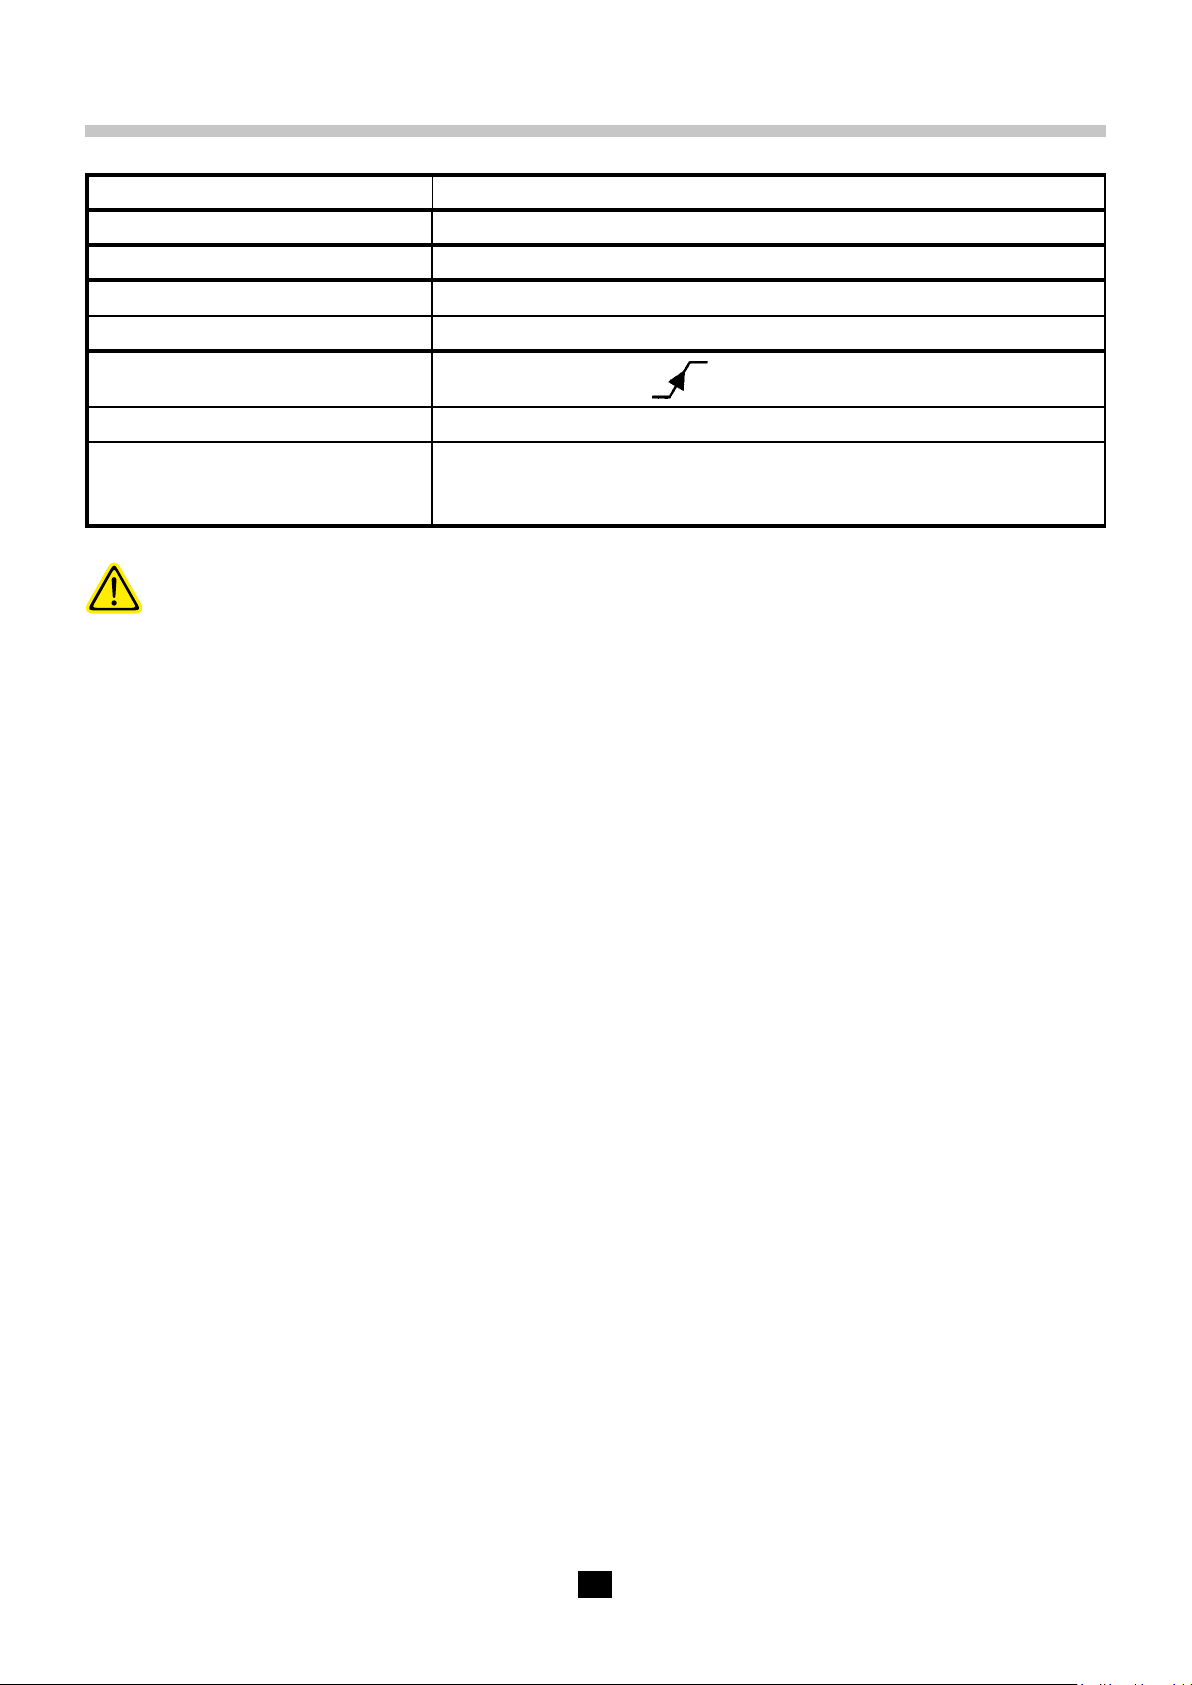
a) Display of the waveform in Oscilloscope mode then select “multimeter” mode to adjust the manual amplitude, the regulation of the range by
clicking the zone and logger mode.
If the channel run, press to change coupling. Coupling will change from: AC AC < 5 kHz AC < 625 AC+DC AC+DC < 5 kHz
AC+DC < 625 Hz DC. Manual range change with .
b) Run acquisition in logger mode.
Automatic le of 100 000 measurement created on each active channel: time 10 000 s = 333 min or 5.55 h, x resolution 0.2 s.
Recording progress, and waiting about 5h to analyse les created if you don’t change mode.
sort the even
Analysis of the events found. Pressing this icon opens a window containing
the events satisfying the search criteria.
When an event is selected, the V1, V2 and T1 cursors appear. The associated
measurements are displayed below the event window.
The events name formats is: YYYY-MM-DD,HH : MM : SS .s where YYYY-
MM-DD : is the date of the record and, HH : MM :SS .s : is the value of the
T1 cursor.
c) Viewer logger mode .rec le event selected and .txt editor in SCOPIX IV le system and after you can open txt software.

16

17
13. HEART RECORDER
Demo: with: SCOPIX IV
Test Signal n°13 : Heart recorder
Nature Slow «heartbeat» type signal and increasing/decreasing VDC
Specs Frequency of the signal ≈ 0.5 s, amplitude ≈ 3.2 V (heartbeat)
Oscilloscope Settings Duration 10 s then 2 s - MAIN = 500 mV/div. DC coupling
Trigger None at rst, then EXT thresholds on MAIN, levels 1 V and 2.6 V
Modes «Source/Level» triggering, then «File Capture»
Objectives Multiple threshold observation using «Logger» mode
a) Select “Oscilloscope” mode, the signal then calibrate vertical sensitivity to 500 mV/div. and add auto meas to have cursor.
b) Select «logger» mode (Recorder) and calibrate 500 mV/div. x duration of 10 000 s with resolution of 0.2 s on the on home screen: automatic
recorder on les .rec.
c) Viewer remotely of les on internal directory or on µSD.
or ScopeNET IV
d) Run ScopeNET IV via ethernet or WIFI connection and remote mode of each function.
When you have obtained the IP address of the Scopix IV (DHCP or manual) using a browser, type14.3.250.51/scopenet.html (for example) on your
computer this opens the screen shown opposite.
JAVA application PC is used to display the ScopeNet IV.
Carefully check the installation of ScopeNet to forestall any diculties.
To check the instruments connected, follow the procedure:
- Press the network icon, in the centre of the screen: the search for the instruments in the network
(Ethernet and WIFI) is eected by a specic function. A series of compatible instruments connected is
displayed: see opposite.
- The PC environment uses icons in an IHM identical to the Scopix IV product, with the same access to
the functions and adjustments.

18
14. HARMONICS
Demo: with: SCOPIX IV
Test Signal n°14 : Harmonics
Nature 2 signals, one square, the other triangular
Specs Frequency of the signal ≈ 50 Hz, Vpp ≈ 3.2 V (triangular), Vpp ≈ 3,4 V (square)
Oscilloscope Settings 5 ms/div. - MAIN and AUX = 500 mV/div. or 1 V/div. DC coupling
Trigger DC coupling on MAIN, 50 % of Vpp for example
Modes «Oscilloscope» mode, then «Harmonics», then «FFT»
Objectives Use of the «Harmonics» mode to analyse «Power» signals
Use the FFT mode
a) Adjust the oscilloscope so as to display the signal approximately in accordance with the rst gure (possible using the «Autoset» mode), then
set the parameters as indicated above.
Then select the «Analyser» mode.
This instructive example uses two highly characteristic signals, a square and a triangle, and through analysis of harmonics enables verication
of the theory of decomposition of fundamental signals. The Harmonics analysis function does not require calibration of the time base or sampling
speed, but the vertical sensitivity must be correctly adjusted; the best solution therefore consists in making the calibrations in Oscilloscope mode
beforehand. This will also provide an approximate verication that the frequency of the fundamental is indeed within the instrument’s admissible
limits (40-450 Hz for SCOPIX).
The harmonics can be viewed on 4 channels measurements are made on Vrms and THD (Total Harmonic Distortion) of the signal for each active
channel, and for each active channel, and for the harmonic rank selected, the % of the fundamental, phase in relation to the fundamental, frequency
of the harmonic rank and its RMS value.
b) Return to «Oscilloscope» mode, check the FFT box, perform an “Autoset” and validate the manual cursors.
In the Horizontal menu, we can select the type of scale, linear or logarithmic FFT, as well as the desired analysis window.
In linear mode, the amplitude scale is expressed in volts, in logarithmic mode
in dB, oering a greater analysis dynamic (79 dB for SCOPIX IV and its 12
bits conversion).
Contrary to Harmonics Analysis, FFT is not limited to harmonic ranks of the
fundamental, but presents the whole spectral content of the signal, over the
complete breadth of the oscilloscope bandwidth.

19
15. DISTORTION
Demo: with: SCOPIX IV
Test Signal n°15 : Distortion
Nature 1 pseudo-sinusoidal signal containing harmonic distortion
Specs Frequency of the signal ≈ 50 Hz, Vpp ≈ 3.2 V
Oscilloscope Settings 5 ms/div. - MAIN = 500 mV/div. DC coupling imperative
Trigger DC coupling on MAIN, level 50 % of Vpp for example
Modes «Oscilloscope» mode then «Harmonics»
Objective Use of the «Harmonics» mode to analyse a «Power» signal
a) Adjust the oscilloscope so as to display the signal approximately in accordance with the rst gure (possible using the «Autoset» mode), then
set the parameters as indicated above.
On electrical power distribution networks we regularly seek to observe possible harmonic distortion phenomena, which often cause problems for
the global operation of the installation and the instruments connected.
b) This example realistically simulates a sinusoidal 50 Hz signal (network frequency of many countries), on which harmonic ranks have been
superimposed in the following manner:
- Amplitude sinus 0.3 V (10 %) ; frequency 150 Hz (rank 3) ; dephasing: PI (180°)
- Amplitude sinus 0.6 V (18 %) ; frequency 250 Hz (rank 5) ; dephasing: PI/2 (90°)
Important ! In order that the dephasing measurements indicated may be correct, the channel coupling must imperatively be set to «DC».
c) Save and recall after transfer on Excel to make graphic with limit of eld of character.
replace «.» with «,»

X05044A02 - Ed. 1 - 03/2021 © Chauvin Arnoux - All rights reserved and reproduction prohibited
Table of contents
Other Metrix Test Equipment manuals

Metrix
Metrix HI-903 User manual

Metrix
Metrix OX 5042 User manual

Metrix
Metrix HandScope OX5022B User manual

Metrix
Metrix TCX01 User manual

Metrix
Metrix OX 6062-II User manual

Metrix
Metrix MX 59HD User manual

Metrix
Metrix MTX 3252e-C User manual

Metrix
Metrix DOX3104 User manual

Metrix
Metrix CX 1651 User manual

Metrix
Metrix HI 803 Specification sheet

Metrix
Metrix ScopiX IV Series User manual

Metrix
Metrix MX 67 User manual

Metrix
Metrix MX 604 User manual

Metrix
Metrix CX 1651 User manual

Metrix
Metrix GX-1030 User manual

Metrix
Metrix MX 407 User manual

Metrix
Metrix HI-903 User manual

Metrix
Metrix MX 407 User manual

Metrix
Metrix MX 535 User manual

Metrix
Metrix MTX 3352 User manual


