Nidec-Shimpo DT-2100 User manual

99295A

1
Contents
1. Introduction
2
2. Software Operation Requirements
2
3. Installation
3
4. Starting Application
5
5. Main Screen
6
5.1 USB Connection Status
6
6. Continuous Data Import Screen
7
6.1. Measurement Display
8
6.2 Measurement Results
9
6.3 CSV File Operation
12
7. Graph Screen
13
7.1. Graph Drawing
14
8. Continuous Data Import Screen
16
8.1 Continuous Memory
16
8.2 Each Memory
17
8.3 Statistics Memory
17
8.4 CSV File Operation
17
9. SET_USER Screen
18
10. SET_SYSTEM Screen
19
11. SEL_USER Screen
20
12. Error Message List
21
13. Terms of Use
24
14. Communication Commands
25
2
1. Introduction
Thank you for purchasing the Handheld Digital Tachometer "DT-2100" (hereinafter referred to as the DT-2100).
This instruction manual summarizes the operation procedure of the DT-2100 specialized software.
2. Software Operation Requirements
The software operation requirements for the DT-2100 specialized software is as follows:
Software Operation requirements
•DOS/V compatible machines
•Microsoft Windows®7* (Japanese/English environment) (32 bit/64 bit)
•Microsoft Windows®8* (Japanese/English environment) (32 bit/64 bit)
•Required Memory 2GB RAM
*Microsoft and Windows are either registered trademarks or trademarks of Microsoft Corporation in the United States
and/or other countries.
Communication method: RS-232C (Virtual COM port)
Communication protocol
Baud rate
38400bps
Data
8bit
Parity
None
Stop bit
1bit
Flow control None
3
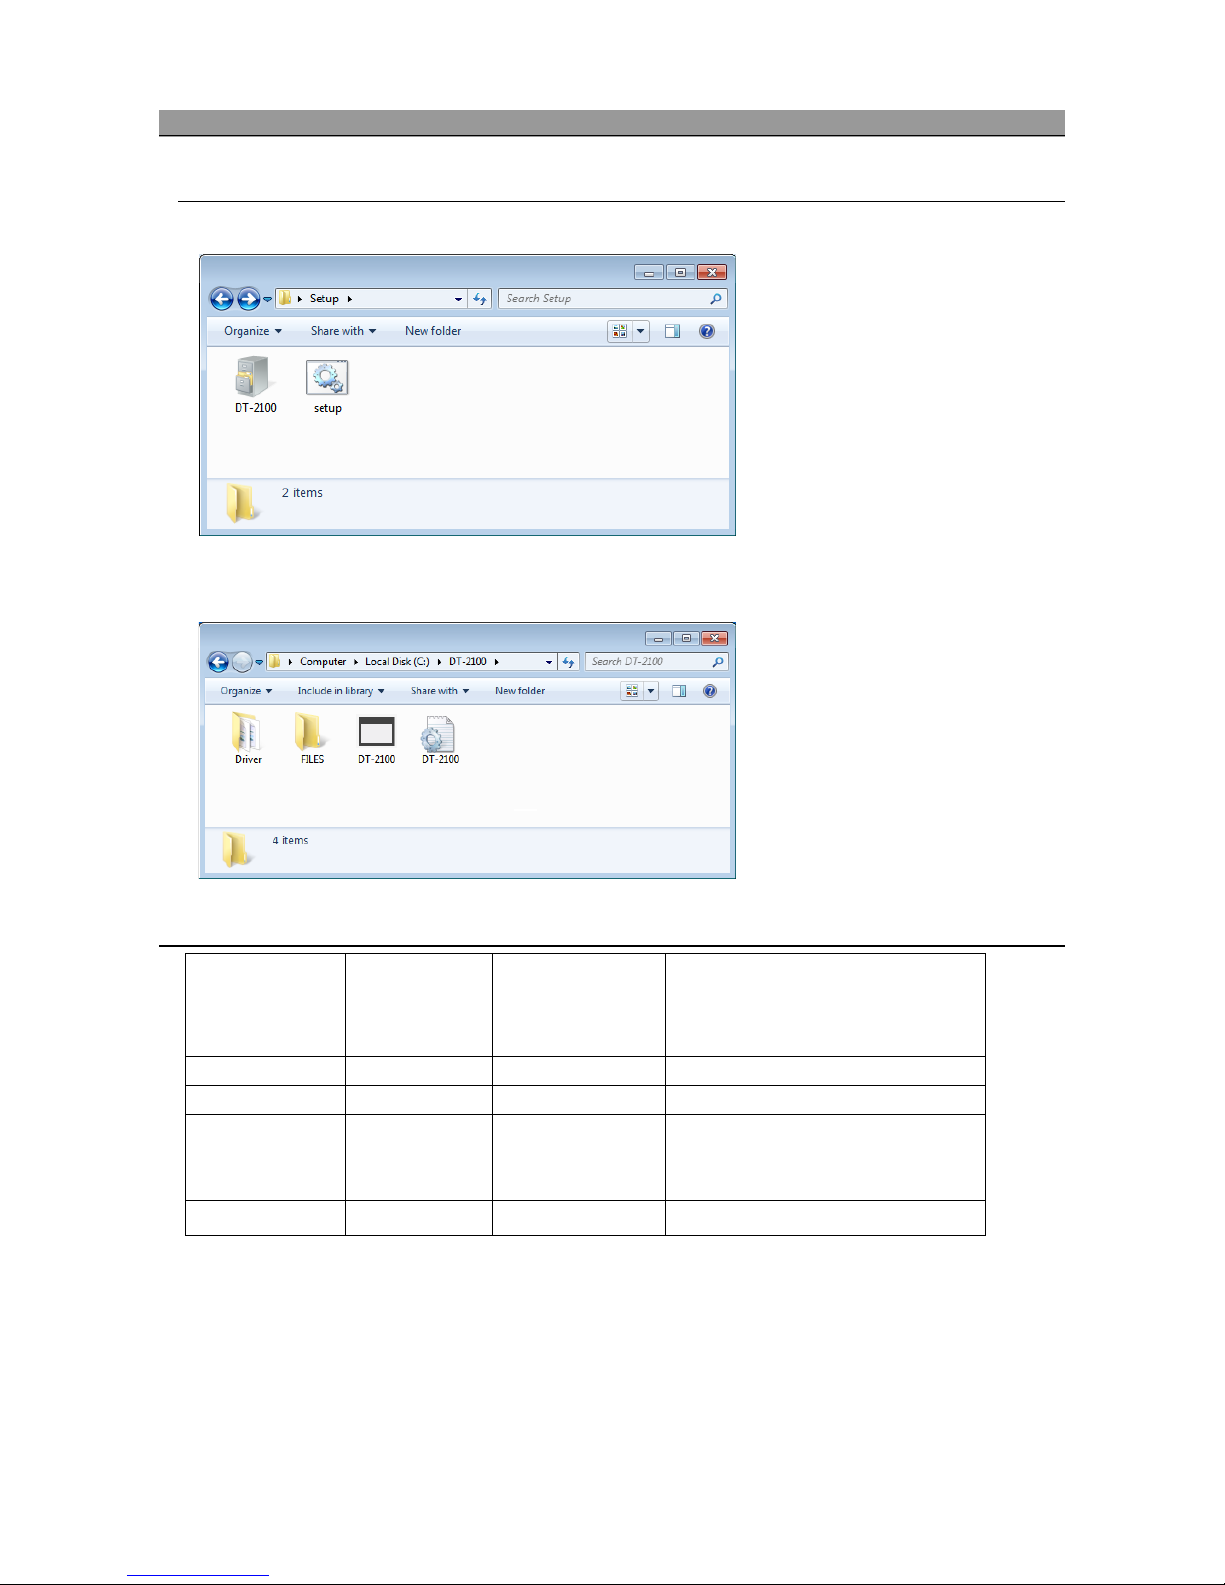
3. Installation
(1)Application installation
Double click setup.bat in the installation media "setup" folder to execute installation.
When installation is completed, the following files and folders are created under "C:\DT-2100".
(2)File configuration
Installation
destination
Folder Remark
C drive
C:\DT-2100
DT-2100.exe
Execution file
DT-2100.ini
Setting value save file
FILES Used for saving the CSV file
Initial folder to be specified at the time of
saving
Driver USB driver
4
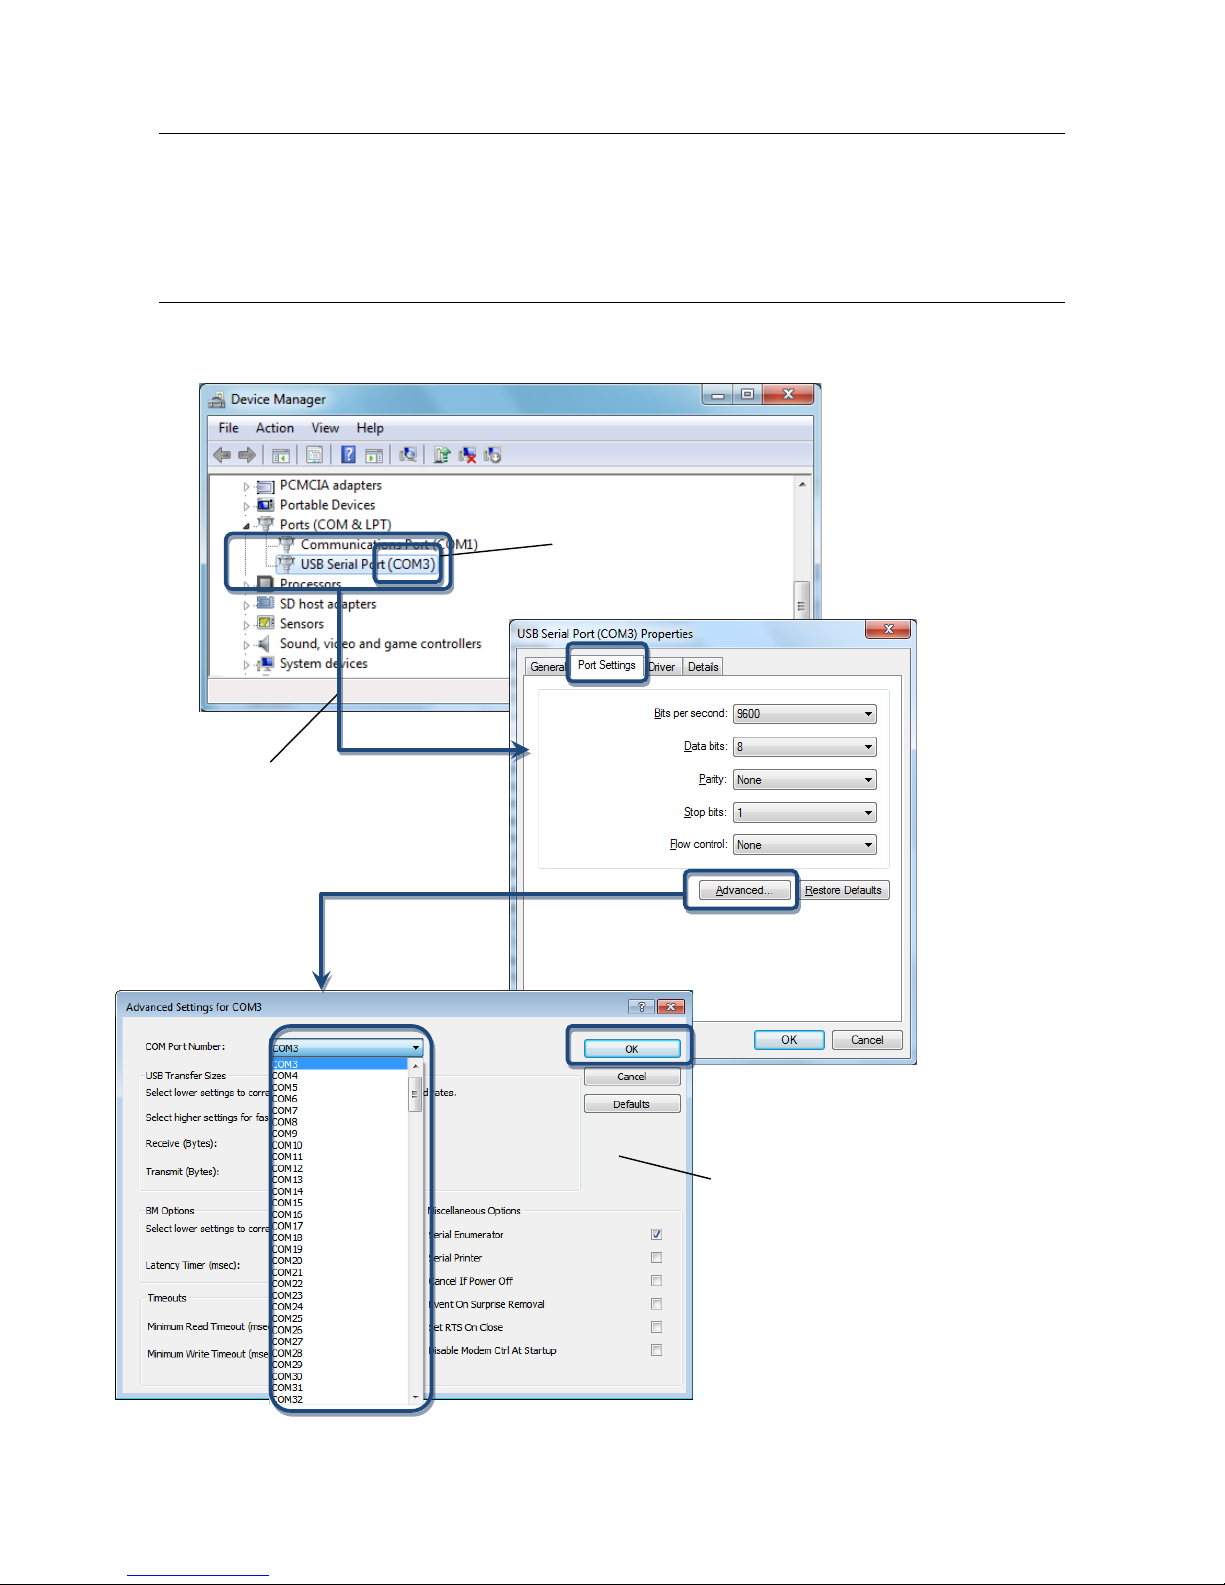
(3) USB driver installation
When connecting a USB device to the PC where the DT-2100 has been installed, the USB driver is automatically installed.
Wait for several minutes until the installation is completed.
(4) COM port setting
Select "USB Serial Port" created under [Control Panel] - [Device Manager], and start to set the port.
To change the COM port number, select
"Properties" in the right-click menu.
The COM port number displayed here becomes the port number
to be used in the application.
Select the COM port number, and click
[OK] to finish the COM port change.

5
If the driver is not recognized correctly, perform [Update Driver] according to the following procedure.
4. StartingApplication
Double click "DT-2100.exe" in the installation folder to start application.
*Label and message descriptions depend on the language setting. (same as those for other screens)
*The initial language setting is English. From the next startup, the application starts with the language set when last closed.
(1) COM port selection
(2) OK button
(1)COM port selection* Select from among COM1 to COM15.
Detects the available ports automatically, and attaches "*" before the COM number.
(2)OK button
Opens the selected COM port, and displays the main screen.
6
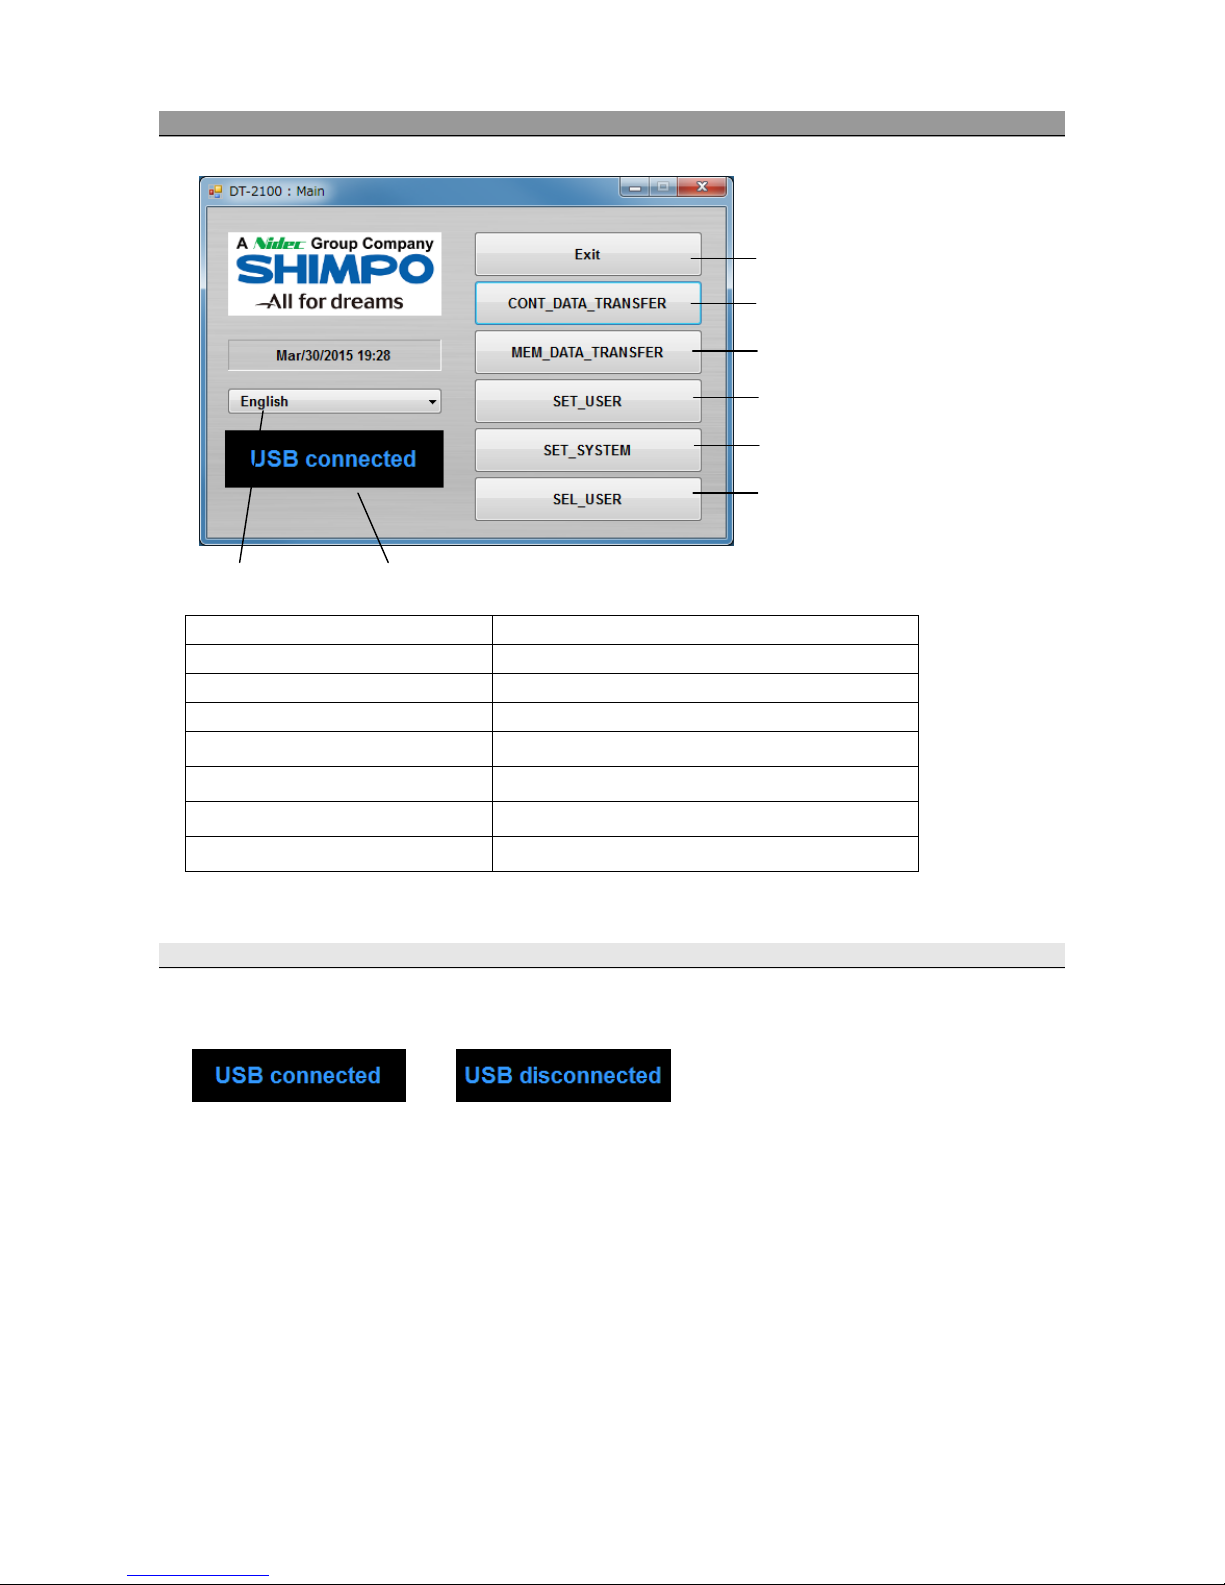
5. Main Screen
(1) Language selection
Select the language from Japanese or English.
(2) Status display
Displays the USB connection status.
(3) Exit button
Exits the application.
(4) CONT_DATA_TRANSFER button
Displays the Continuous Data Mode screen.
(5) MEM_DATA_TRANSFER button Displays the Memory Mode screen.
(6) SET_USER button Displays the SET_USER screen.
(7) SET_SYSTEM button Displays the SET_SYSTEM screen.
(8) SEL_USER button Displays the SEL_USER screen.
5.1 USB Connection Status
Check the connection status with the DT-2100 in the status display screen.
(3) Exit Software button
(4) Continuous Data Transfer button
(5) Memory Data Transfer button
(6) Set User Screen button
(7) Set System Screen button
(8) Select User Screen button
(2) Status display(1) Language
Connected Disconnected
7
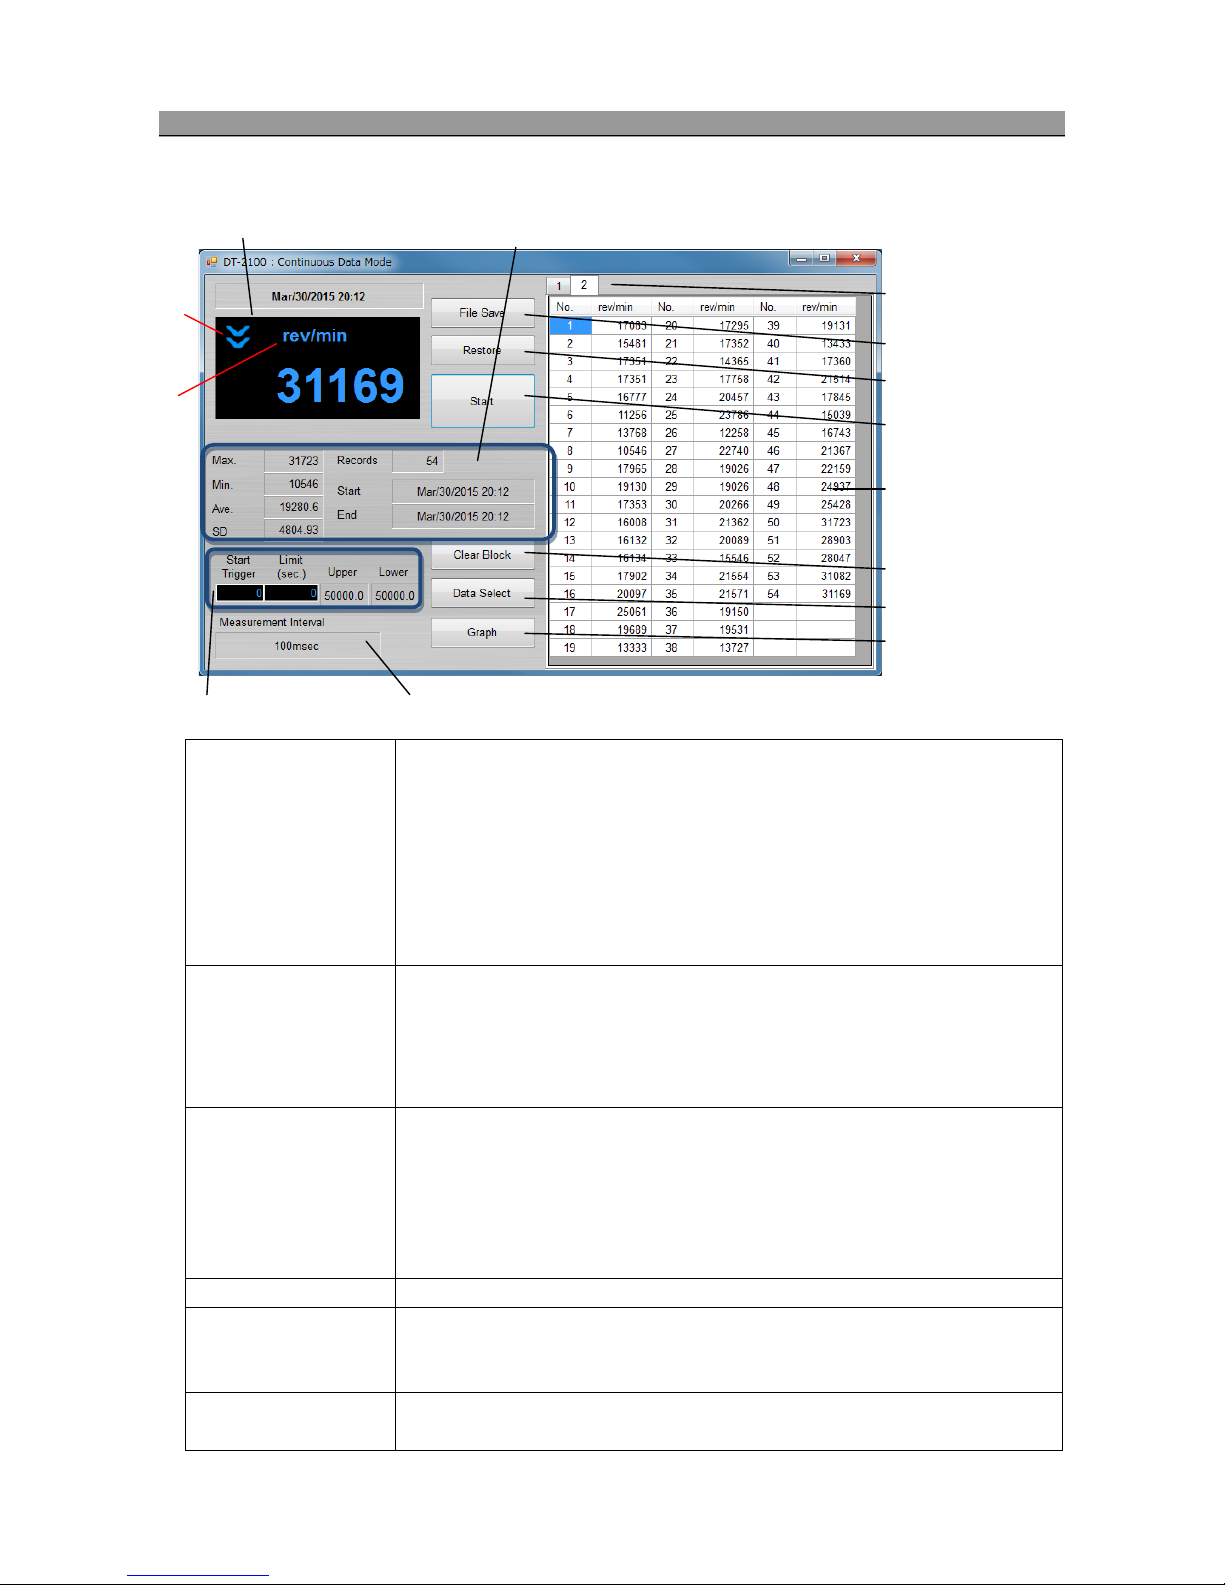
6. Continuous Data Import Screen
Select the "CONT_DATA_TRANSFER button" in the menu to display the continuous data import screen.
(1) Measurement display (1.a)
Upper/lower judgment marks: Compared to the values specified in the user
setting, indicates the upp
er limit mark when the upper limit value is less than the
measurement value, and the lower limit mark when the lower limit value is more than
the measurement value.
(1.b)
Measurement unit: Indicates the unit specified in the user setting, and indicates
"OVER" when the measured value exceeds the measurement range.
Measurement value: Indicates the measurement value (6 digits + decimal point).
When the measurement value exceeds 999999, indicates "------" (hyphens).
(2) Statistics Data For the imported measurement data, ind
icates the maximum value, minimum value,
average value, standard deviation, the number of measurement
data, and the
measurement start, end time. Updates during measurement.
For the average value, when the integer part of the calculated result has x digits, the
number of digits after decimal point becomes 6-x.
(3) Import control setting Import start trigger: After the measurement value exceeds the user defined Start
Trigger, importation of data begins
Import time limit: Importation ends when the user defined limit (sec), setting value has
elapsed.
Upper/lower judgment values: Indicates the upper/lower judgment values specified in
the user setting screen.
(4) Measurement interval
Indicates the measurement interval specified in the system setting.
(5) File Save button Generates the save destination folder selection screen.
Saves the measurement data being displayed and statistics data (Max./Min./Ave./SD)
to the file in the CSV format.
(6) Restore button Indicates the file selection screen.
Creates a new block, and reads the selected measurement data into it.
(5) File Save button
(2) Statistics Data
(4)Measurement interval(3)Import control setting
(1) Measurement display
(6) Restore button
(7) Start button /
Stop button
(8) Clear Block button
(9) Data Select button
(10) Graph button
(11) Block tab
(12) Measurement data
(1.a)
(1.b)

8
*The measurement data and block tab are synchronized with the graph screen.
6.1 Measurement Display
Indicates the data importing status during measurement.
(1) Measurement value
●Indicates the measurement value (6 digits + decimal point).
●When the measurement value exceeds 999999, indicates "------" (hyphens).
(2) Upper/lower limit judgment marks
●Indicates the upper limit mark when COMPARATOR UPPER_LIMIT in the user setting is less than the measurement data.
●Indicates the lower limit mark when COMPARATOR LOWER_LIMIT in the user setting is more than the measurement data.
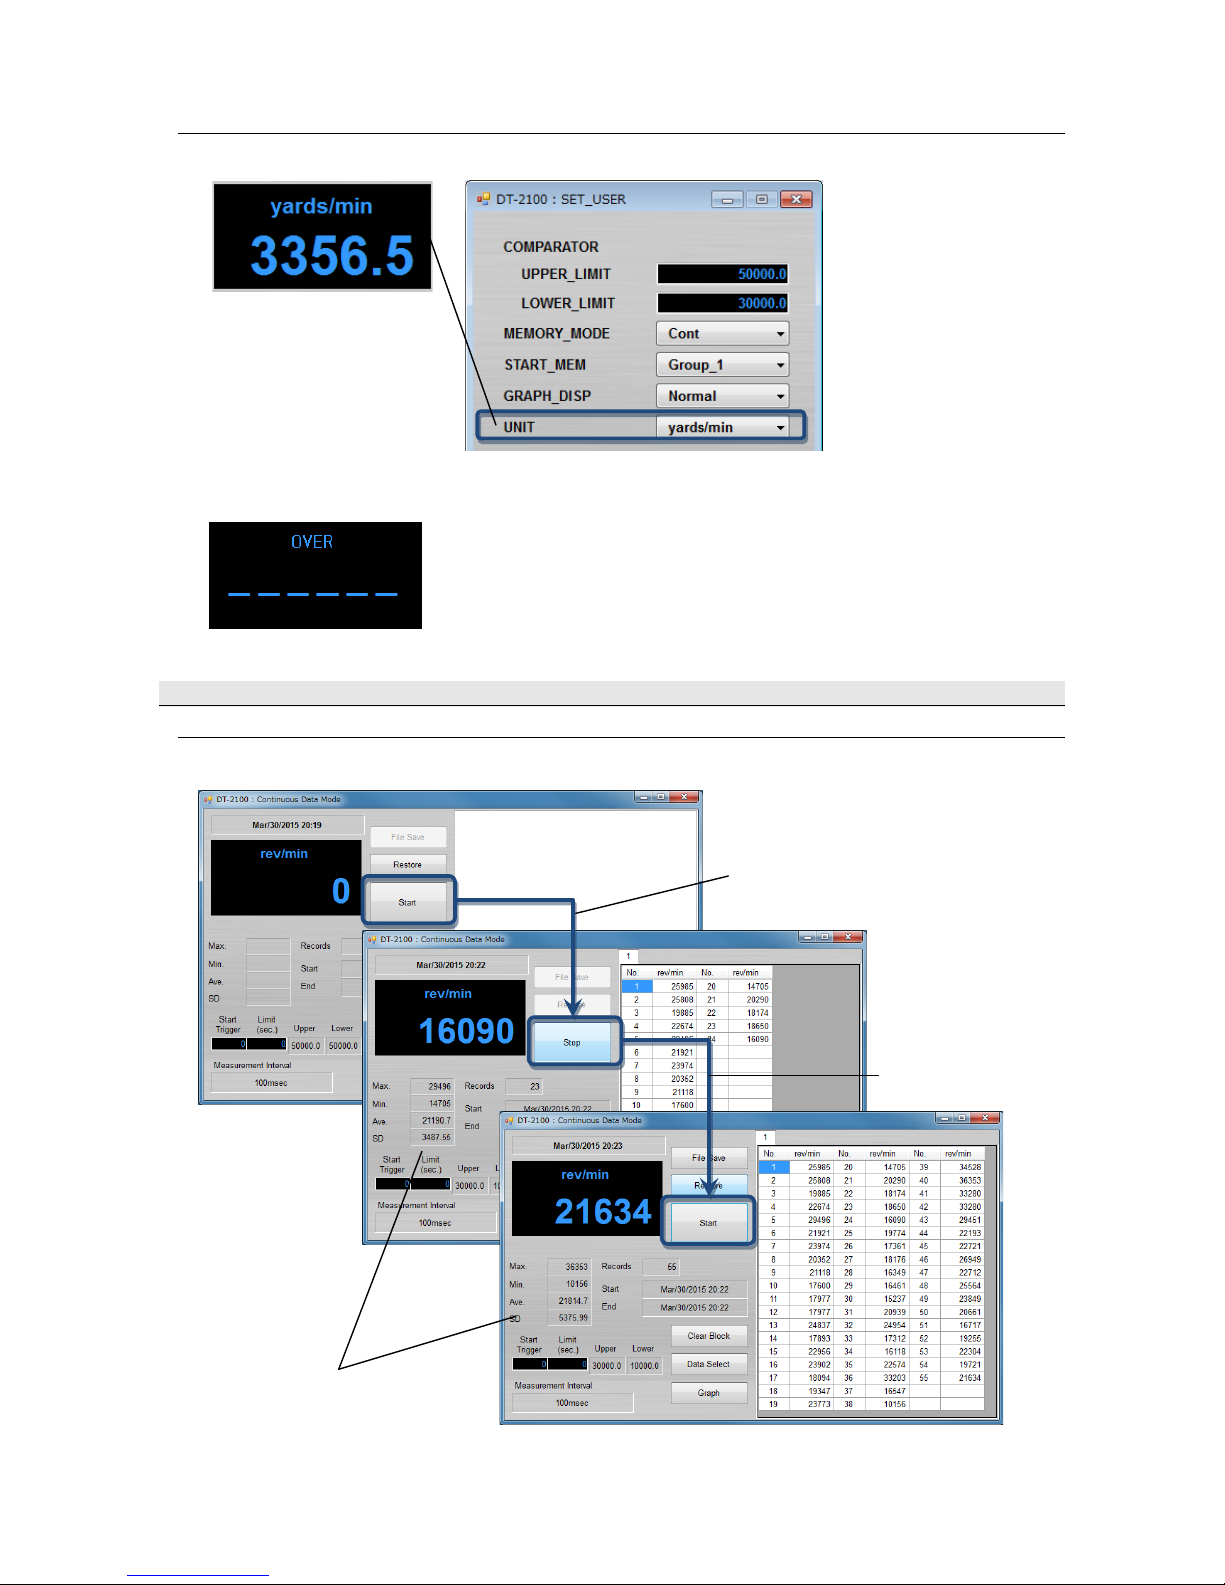
(7) Start button
/Stop button
Press the Start button to start importing the data. The Start button then becomes the
Stop button.
Press the Stop button to finish importing the data. The Stop button then becomes the
Start button.
During data import, buttons other than the Stop and Graph buttons, as well as the
selection columns are disabled.
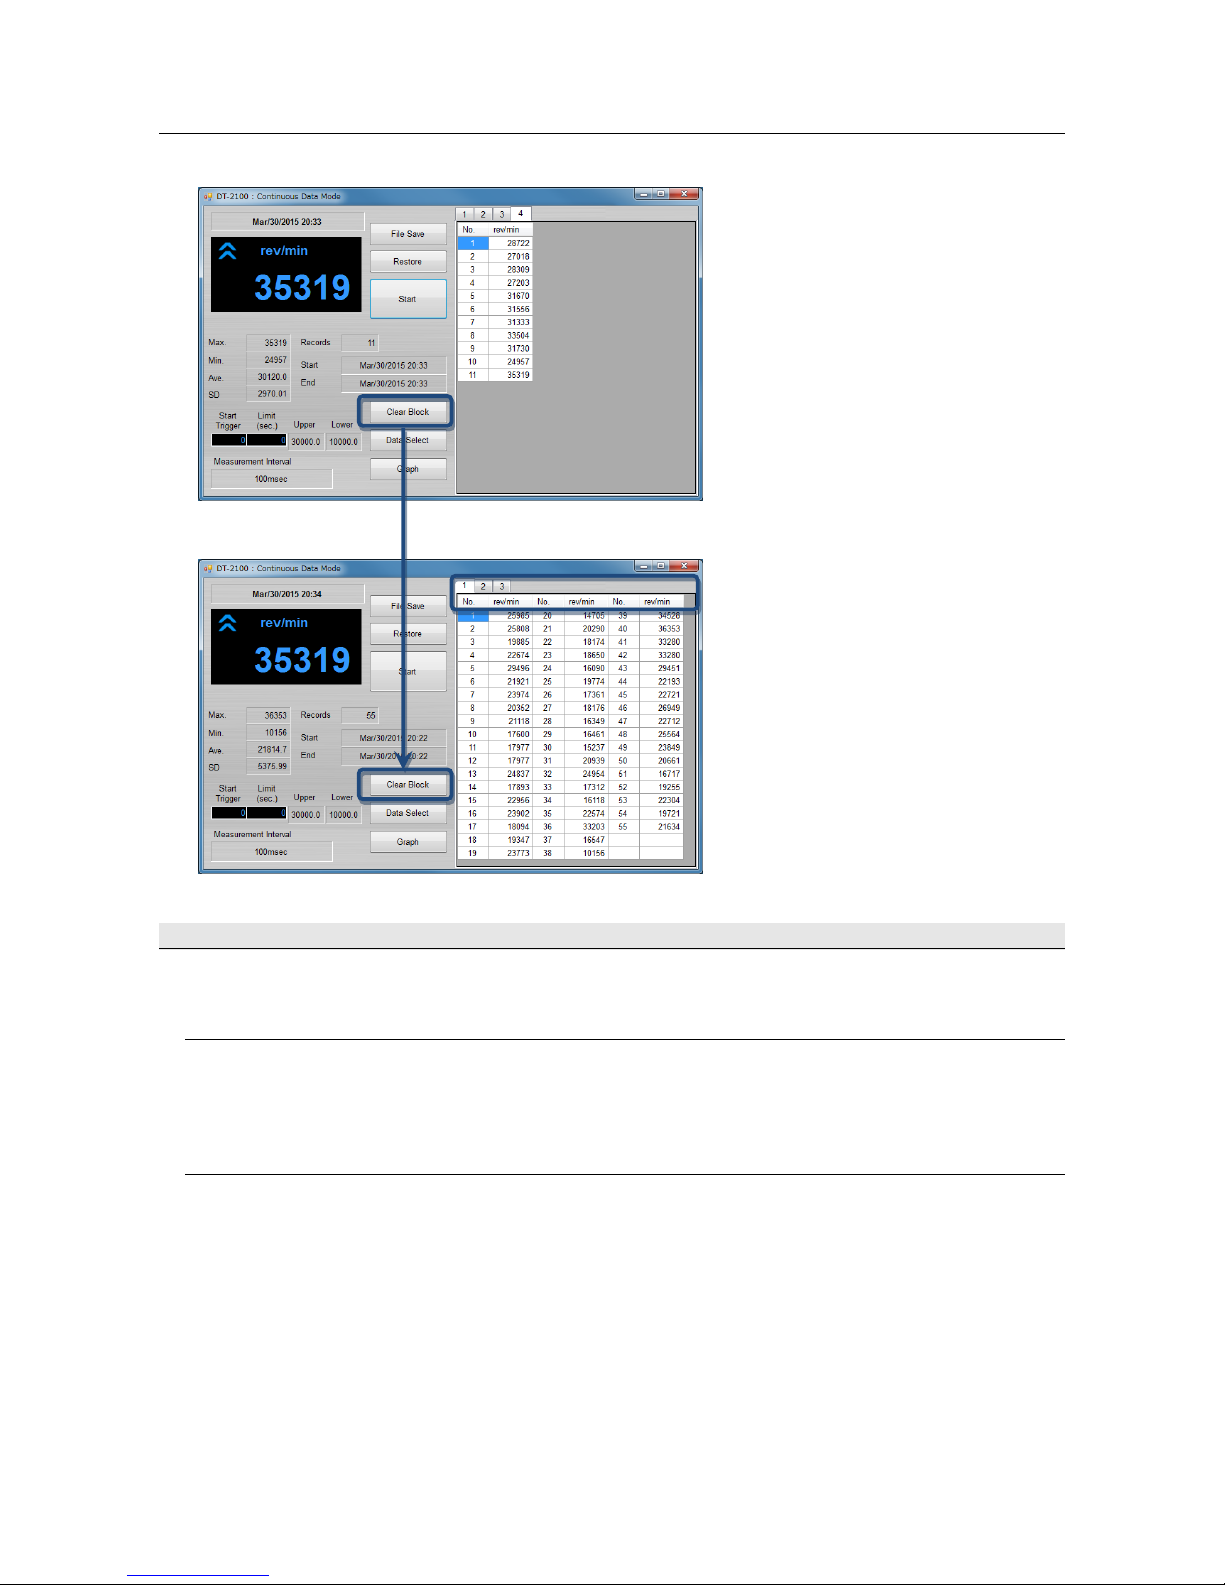
(8) Clear Block button Click this button to display the confirmation screen. Click OK to delete the block that
has been selected.
When there are blocks No.1 to 4 and you delete block No.3, block No.4 is changed to
No.3.
(9) Data Select button Click this button to keep only the data that has been selected.
(10) Graph button Click this button to display the Graph screen.
(11) Block tab* Indicates the measurement data for every measurement. Up to 1000 block.
Creates a new block for every measurement by pressing the Start button.
You cannot switch data tabs while taking measurement.
(12) Measurement data* Indicates the measurement value. Up to 65535 data points can be imported.
Importing ends automatically when the maximum number of data points is attained.
9
(3) Measurement unit
●Indicates the unit specified in the SET_USER.
●Indicates "OVER" when the measured value exceeds the measurement range.
6.2 Measurement Results
(1) Measurement data
Measurement operation - 1
Press the Start button to start importing data.
It then becomes the Stop button during measurement.
The statistics data is calculated even
during data import.
Press the Stop button
to finish importing data.

10
Measurement operation - 2
Adds a new block for every data import by pressing the Start button. Measurement data is retained.
Adds the block tab for every import.
Adds the block tab for every import.
11
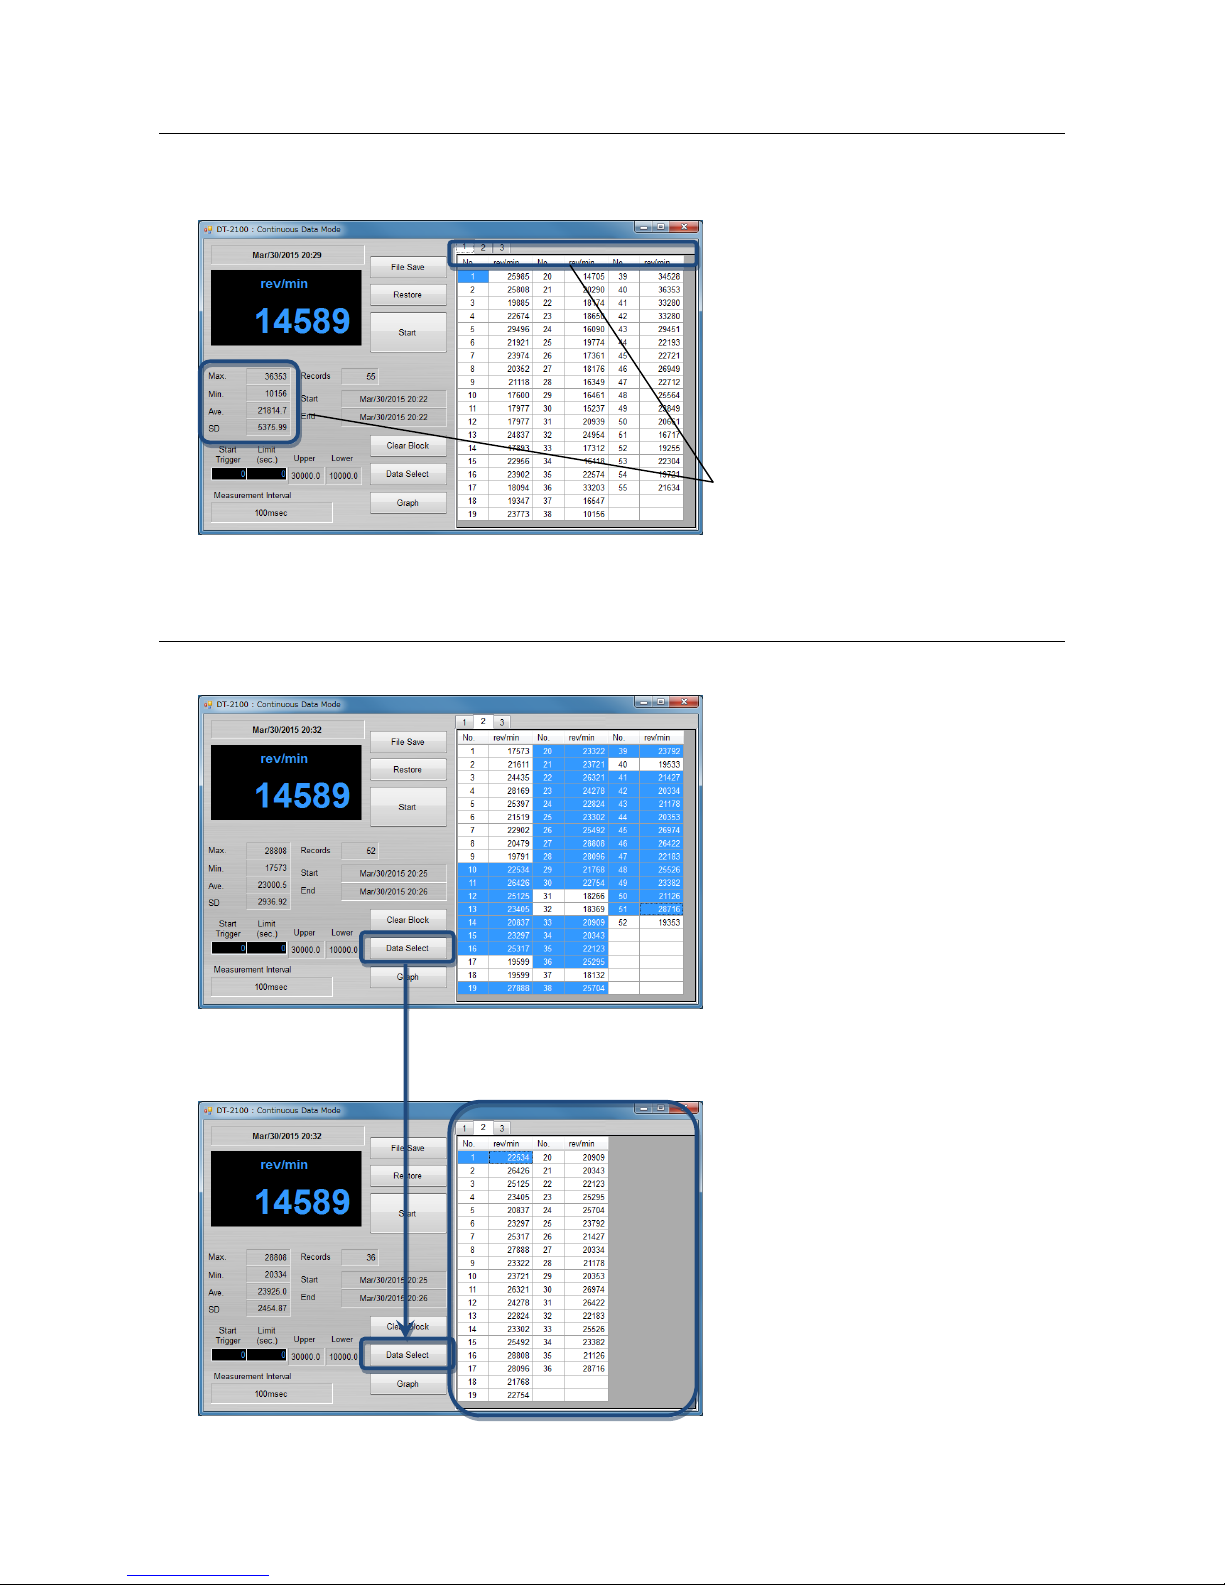
(2) Statistics Data
From the measurement data, calculates the maximum value/minimum value/average value/standard deviation
(Max./Min./Ave./SD). Indicates and retains the data for every import.
(3)Exporting the measurement data
Select the arbitrary measurement data. Click the Data Select button to export the selected data.
Calculate and holds the statistics data
for every import.
*Multiple data may be selected when you press and
hold the Ctrl key while clicking cells with the mouse
button. Groups may be highlighted and selected by
dragging the mouse while holding the Ctrl key.
12
(4) Deleting the measurement data
Click the Clear Block button to delete the block tab that has been selected.
6.3 CSV File Operation
The measurement results can be saved in or read from the arbitrary CSV file.
● Save the measurement results in the CSV file
Click the File Save button to display the "Save as" dialog window.
Specify the arbitrary file name and save destination and click the save button to save the setting contents.
● Read the measurement results from the CSV file
Click the File Save button to display the "Open" dialog window.
Select the CSV file you want to open and click the "Open" button.
A new block tab is created and the measurement data as well as statistics data are displayed in the tab.
Only CSV files that have been saved with this application can be opened here.
If you try to open files other than those specified above, they cannot be opened normally.
13
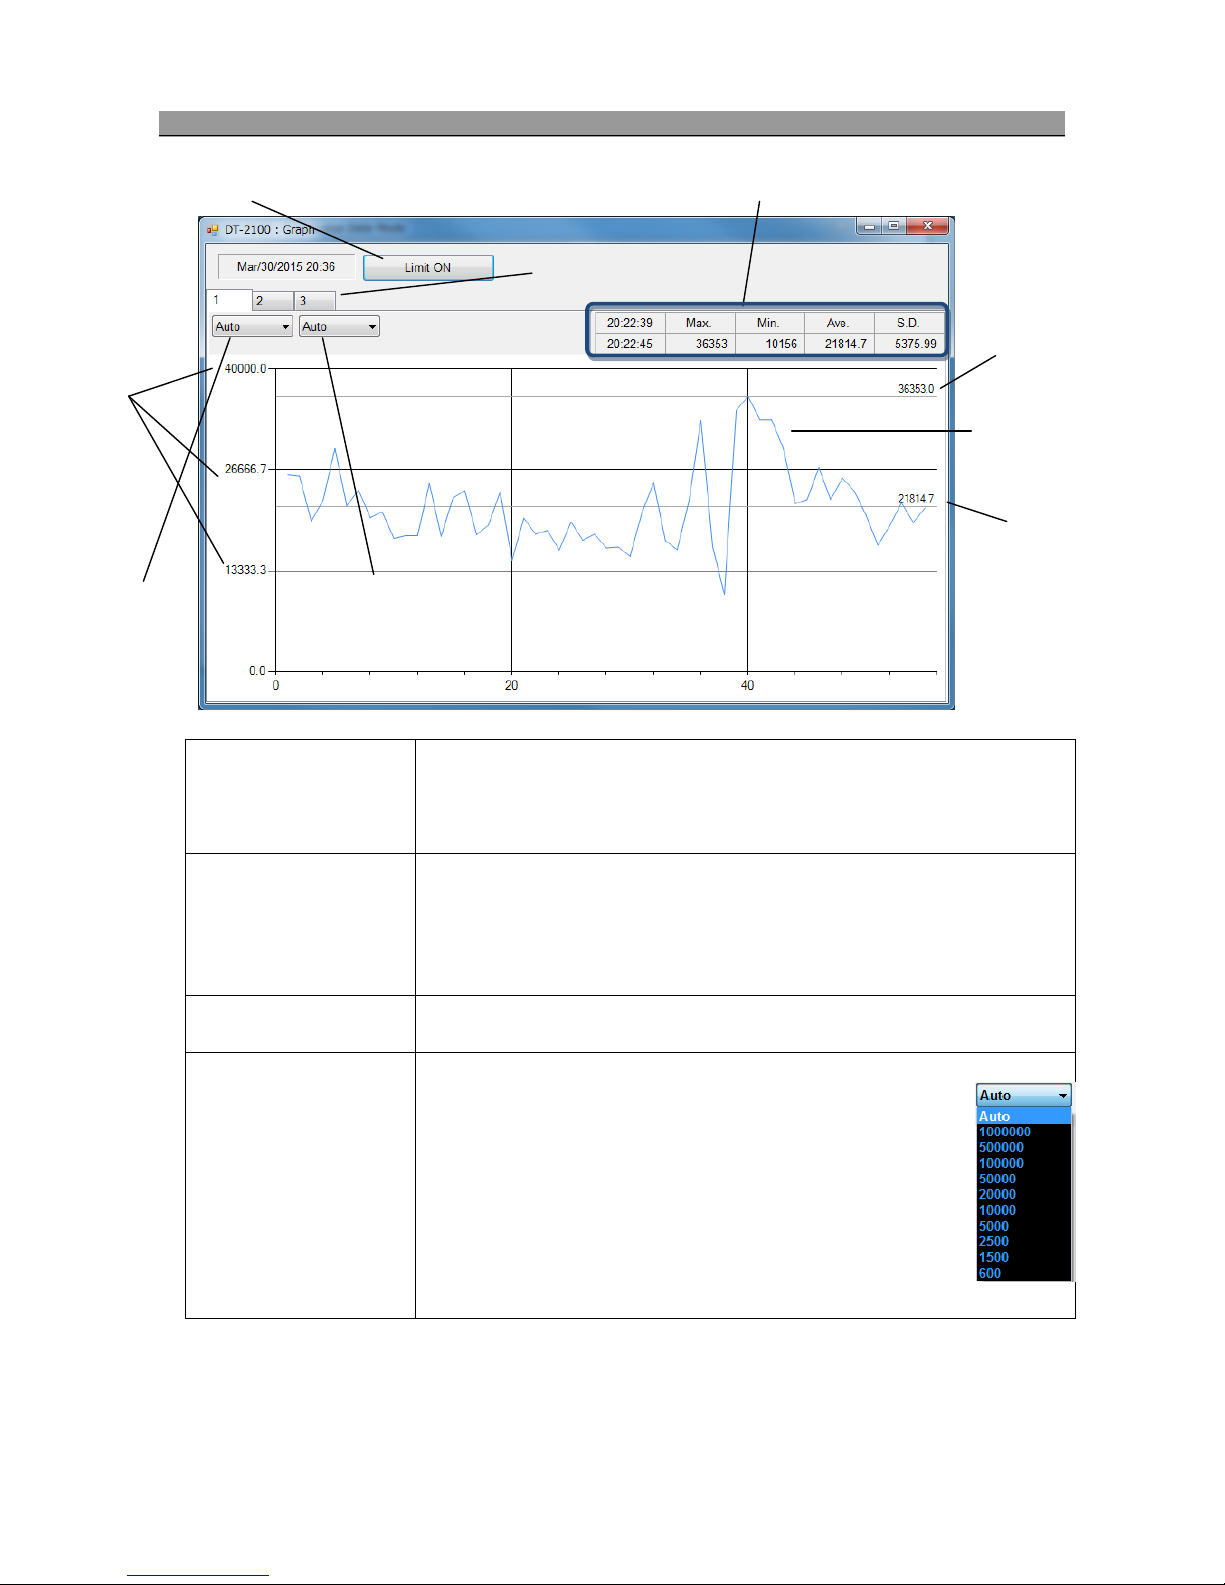
7. Graph Screen
Select the "Graph button" in the continuous data import screen to display the graph screen.
(1)Limit On button/Limit
Off button
Press the Limit On button to draw the upper/lower limit graph. The Limit On button
then becomes the Limit Off button
Press the Limit Off button to erase the upper/lower limit graph lines. The Limit Off
button then becomes the Limit On button
(2) Statistics data
For the imported measurement data, indicates the maximum value/minimum
value/average value/standard deviation, the number of measur
ement data, and the
measurement start/end time. Updates during measurement.
For the average value, when the integer part of the calculated result has x digits, the
number of digits after decimal point becomes 6-x.
(3) Block tab Synchronized with the block tab in the continuous data import screen, stores the
measurement data and statistics data.
(4) Vertical axis selection
column Select the maximum value on the vertical axis
and specify the measurement data
range.
Ranges depend on each unit setting.
If the measurement data does not fit within the range, the scroll bar
becomes enabled to allow you to scroll up or down the column.
If the Auto setting is selected, it switches the range automatically based
on the measured data.
(2) Statistics Data
(5) Horizontal axis
selection column
(4) Vertical axis
selection column
(1)Limit On button/Limit Off button
(3) Block tab
(6) Graph
(7).
(8).
(9).

14
7.1 Graph Drawing
(1) Synchronization of measurement data and statistics data with the continuous data import screen
The graph and statistics data to be displayed are synchronized with the block tab in the continuous data import screen.
(5) Horizontal axis selection
column
Select the maximum value on the horizontal axis.
Auto: Automatically adjusts to the time during measurement.
Limit: Applies the Limit setting in the USB main screen. When the Limit
is 0, the range setting is same as that for theAuto.
10sec, 100sec, 300sec: Sets to the specified measurement time. If the
measurement data exceeds the setting range
, the scroll bar becomes enabled to
allow you to scroll up and down the column.
(6) Graph Indicates the real-time graph.
(7) Graph values Indicates the maximum graph value divided into three
(8) Average value Indicates the average value of measured data
(9) Max value Indicates the maximum value of measured data
The 1st measured data
The 3rd measured data

15
(2) Switching the display of the upper/lower limit graph
Use the Limit On button/Limit Off button to switch between displaying and hiding of the upper/lower limit graph.
LOWER_LIMIT
UPPER_LIMIT

16
8. Memory Data Import Screen
Select the "MEM_DATA_TRANSFER button" in the menu to display the memory data import screen.
8.1 Continuous Memory
Displays "No." and the corresponding "measurement value" recorded on the first row of the memory data, and the serial number
and memory data below them.
Indicates the statistics data corresponding to the memory data on the statistics data column.
(1) Memory mode Indicates the memory mode specified in the user setting.
(2) File Save button Indicates the save destination folder selection screen.
Saves the memory data being displayed to the file in the CSV format.
(3) Restore button Indicates the file selection screen.
Creates a new block, and reads the selected memory data into it.
(4) Block tab Indicates the measurement data every time the memory data is read from the DT-2100. Up
to 1000 blocks.
(5) Memory data Indicates the memory data that has been read.
The contents depend on the measurement mode (continuous memory/each
memory/statistics memory).
(6) MEM_GROUP Select the MEM_GROUP.
(7) Statistics Data
Indicates the maximum value, minimum value, average value, and standard deviation for the
selected block number. Indicates the number of memory data in Blocks.
(8)Clear Device button Click this button to display the confirmation screen. Click OK to delete the memory data for
the MEM_GROUP that has been selected.
(9)Clear Block button Click this button to display the confirmation screen. Click OK to delete the block that has
been selected.
(10) Transfer button Reads the memory data for the MEM_GROUP that has been selected.
(1) Memory mode
(6) MEM_GROUP (7) Statistics data (8)Clear Device button (9) Clear Block button (10) Transfer button
(3) Restore button
(2) File Save button (4) Block tab (5) Memory data

17
8.2 Each Memory
Displays "No." and the corresponding "measurement value" on the first row of the memory data, and the serial number and
memory data below them.
Indicates the statistics data corresponding to the memory data on the statistics data column.
8.3 Statistics Memory
Indicates "No.", "MAX", "MIN", "AVE", and "SD"on the first row of the memory data, and the serial number and memory
data below them.
Indicates the selected memory data on the statistics data column.
8.4 CSV File Operation
The measurement results can be saved in or read from the arbitrary CSV file.
● Save the measurement results in the CSV file
Click the File Save button to display the "Save as" dialog window.
Specify the arbitrary file name and save destination. Click the save button to save the setting contents.
● Read the measurement results from the CSV file
Click the File Save button to display the "Open" dialog window.
Select the CSV file you want to open and click the "Open" button.
A new block tab is created and the measurement data as well as statistics data are displayed in the tab.
Only CSV files that have been saved with this application can be opened here.
If you try to open files other than those specified above, they cannot be opened normally.

18
9. SET_USER Screen
Select "SET_USER button" in the menu to display the SET_USER screen.
(1) Setting value COMPARATOR ―
UPPER_LIMIT Enter 0.00000 to 999999 (0.00000)
LOWER_LIMIT Enter 0.00000 to 999999 (0.00000)
MEMORY_MODE Select from Cont, Each, or Stats
START_MEM Select from Group_1, Group_2, Group_3, Group_4, or
Group_5
GRAPH_DISP
Select from Normal, Graph_1, Graph_2, or Graph_3
UNIT Select from the following items
rev/min, m/min, cm/min, inch/min, feet/min, yards/min,
rev/sec, m/sec, cm/sec, inch/sec, km/h, miles/h, cm, m, km,
inch, feet, yards, or STP
(2) READ button
Reads the current user setting information from the DT-2100.
(3) FACTY_DEFAULT
button
Indicates the factory default values.
(4) WRITE button Saves the user setting in the DT-2100 and returns to the main screen.
If the MEMORY_MODE value is different from the current setting value in the
DT-2100, the confirmation message (OK/Cancel) is displayed.
(5) CANCEL button
Returns to the main screen without saving the changed content.
(1) Setting value
(2) READ button (3)FACTY_DEFAULT button (4) WRITE button (5) CANCEL button
Note: default value indicated in bold letters

19
10. SET_SYSTEM Screen
Select "SET_SYSTEM button" in the menu to display the SET_SYSTEM screen.
(1) Setting value
AUTO_OFF
Select from 1min, 10min, or 30min
AUTO_ZERO
Select from 1sec, 10sec, 30sec, 60sec, or None
SET_GRAPH
―
RAPH_FLOW
Select Right or Left
GRAPH_TIME
Select from 1sec, 10sec, 50sec, or 100sec
GRAPH_MAX
Enter 0.00001 to 999999 (000100)
GRAPH_MIN
Enter 0.00000 to 999999 (0.00000)
MEM_GROUP
―
Group_1
0 to 1000/100/100 (Cont/Each/Stats)
Group_2
0to 1000/100/100 (Cont/Each/Stats)
Group_3
0to 1000/100/100 (Cont/Each/Stats)
Group_4
0to 1000/100/100 (Cont/Each/Stats)
Group_5
0to 1000/100/100 (Cont/Each/Stats)
CONTACT
Select from Contact, Non Contact, Auto, or Contact(Low)
DISP_CYCLE
100msec, 500msec, 1sec, 5sec
PRESCALE
Enter 0.00001 to 999999 (000001)
DIAMETER
―
DIA_UNIT
Select from mm, cm, m, inch, feet, or yards
DIAMETER
Enter 0.00001 to 999999 (000001)
(1) Setting value
(2) FACTY_DEFAULT button (3)CANCEL button (4) READ button (5) WRITE button
Table of contents
Other Nidec-Shimpo Measuring Instrument manuals

Nidec-Shimpo
Nidec-Shimpo FGE-HXY Series User manual

Nidec-Shimpo
Nidec-Shimpo FGE-0.5XY User manual

Nidec-Shimpo
Nidec-Shimpo FG-7000 User manual

Nidec-Shimpo
Nidec-Shimpo PT-110 Installation manual

Nidec-Shimpo
Nidec-Shimpo FG-3000 User manual

Nidec-Shimpo
Nidec-Shimpo DT-200LR User manual

Nidec-Shimpo
Nidec-Shimpo FG-3006 User manual

Nidec-Shimpo
Nidec-Shimpo FG-3000R User manual

Nidec-Shimpo
Nidec-Shimpo FG-3000 Installation manual

Nidec-Shimpo
Nidec-Shimpo FG-7000T User manual


