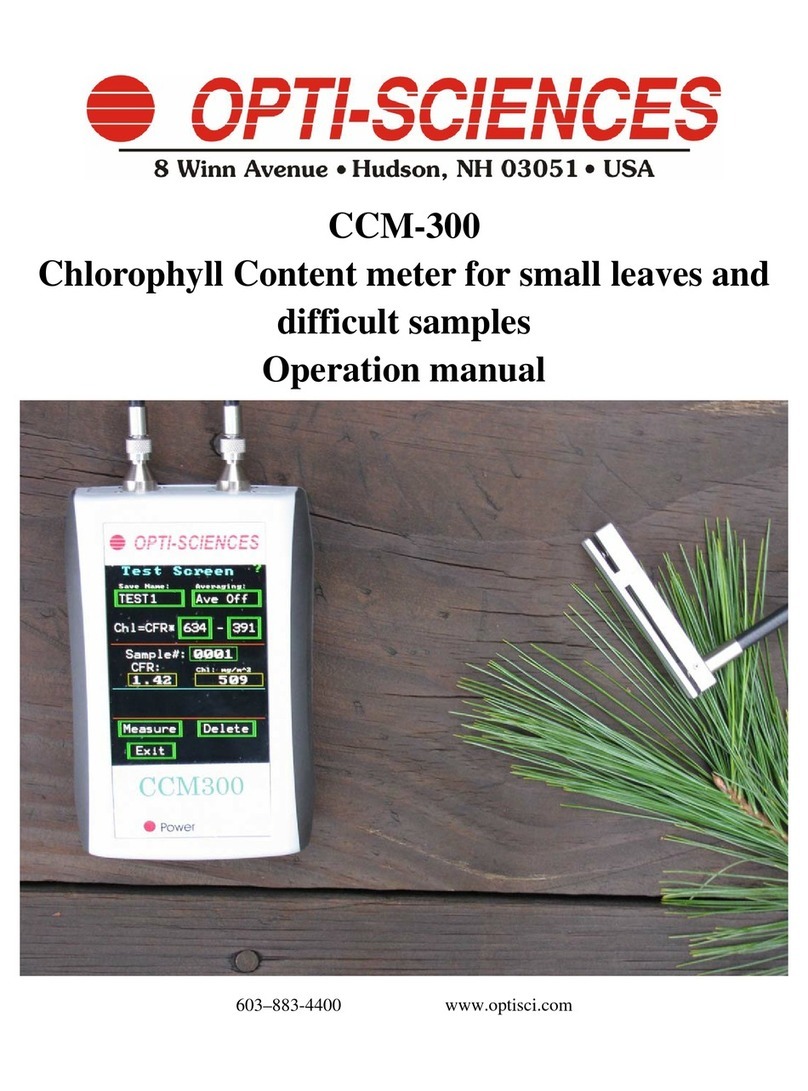
opti-sciences OS1p User manual

OS1p User’s Guide
(Preliminary Advanced Version with RLCs for Algae and Higher Plants)
The New Standard in Portable
Chlorophyll Fluorometers
OS1p040111Advanced

2
CHAPTER 1 •INTRODUCTION....................................................................................................................... 6
OVERVIEW...........................................................................................................................................................6
WELCOME ! .........................................................................................................................................................7
LIST OF EQUIPMENT.............................................................................................................................................7
GETTING STARTED...............................................................................................................................................7
CHLOROPHYLL FLUORESCENCE...........................................................................................................................8
DEFINITIONS:.....................................................................................................................................................11
QUANTUM PHOTOSYNTHETIC YIELD OF PSII –AN IN DEPTH DISCUSSION OF ITS VALUE AND LIMITATIONS. .......16
QUENCHING MEASUREMENTS,AN OVERVIEW ...................................................................................................21
Quenching equations:..................................................................................................................................24
Definitions - lake model parameters............................................................................................................25
Definitions - puddle model parameters........................................................................................................26
Understanding the quenching mode trace ...................................................................................................28
More helpful hints for setting test variable in quenching protocols. ...........................................................33
DARK ADAPTATION –HOW LONG IS LONG ENOUGH? .......................................................................................35
RELATIVE ELECTRON TRANSPORT RATE ...........................................................................................................37
BIBLIOGRAPHY ..................................................................................................................................................40
CHAPTER 2 •THE OS1P.................................................................................................................................. 52
INTRODUCTION ..................................................................................................................................................52
KEY FEATURES ..................................................................................................................................................53
PHYSICAL FEATURES PANEL PHOTOGRAPHS ...................................................................................................54
HARDWARE OVERVIEW AND MEASUREMENT PRINCIPLES .................................................................................56
LIGHT SOURCES .................................................................................................................................................57
Modulated light source ................................................................................................................................57
Saturation pulse light source .......................................................................................................................57
The LED actinic light source .......................................................................................................................58
The far-red light source ..............................................................................................................................58
THE FIBER OPTIC LIGHT GUIDE .........................................................................................................................58
ELECTRONICS ....................................................................................................................................................59
HOUSING AND CARRYING CASE.........................................................................................................................59
CHAPTER 3 •OPERATING THE OS1P......................................................................................................... 60
INTRODUCTION ..................................................................................................................................................60
INTRODUCTION TO RUNNING TESTS....................................................................................................................60
Set up menu..................................................................................................................................................61
Adjust screen touch sensitivity .....................................................................................................................62
Touch Panel Calibrate.................................................................................................................................62
Test menu .....................................................................................................................................................63
FV/FM PROTOCOL (OR FV/M ON THE SCREEN)..................................................................................................64
Cookbook check list before making Fv/Fm measurements..........................................................................65
Running the Fv/Fm test................................................................................................................................67
Drill down view of Fv/Fm measuring screens .............................................................................................68
Changing Fv/Fm measuring parameters -...................................................................................................69
Setting the modulation light source intensity...............................................................................................69
New -automated modulation light set up .....................................................................................................69
Far red light.................................................................................................................................................70
Setting the saturation pulse intensity ...........................................................................................................70
Setting saturation pulse duration.................................................................................................................70
Entering a note with a measurement............................................................................................................72

3
Loading and saving preset measuring routines ...........................................................................................73
Other Fv/Fm function buttons......................................................................................................................74
Measurement review ....................................................................................................................................75
Help screen ..................................................................................................................................................75
Basic definitions of parameters....................................................................................................................76
Error messages ............................................................................................................................................76
Y(II) PROTOCOL:QUANTUM PHOTOSYNTHETIC YIELD OF PSII Y(II) OR )F/FM’ ............................................77
Cookbook checklist before making Y(II) measurements. .............................................................................78
Running the Yield of PSII Y(II) Test.............................................................................................................81
Drill down menu for Y(II) ............................................................................................................................82
Loading and saving preset measuring routines ...........................................................................................83
Copy presets parameters into measuring file...............................................................................................84
Change Y(II) measuring parameters............................................................................................................85
Setting modulation light source intensity.....................................................................................................85
New -automated modulation light set up .....................................................................................................86
Setting the saturation pulse intensity ...........................................................................................................86
Setting saturation pulse duration.................................................................................................................86
Multi-flash vs. standard single flash saturation pulse .................................................................................89
Far red light.................................................................................................................................................91
Pre-actinic light ...........................................................................................................................................92
Entering a note with a measurement............................................................................................................94
Other Y(II) or yield function buttons............................................................................................................95
Measurement review ....................................................................................................................................96
Help screen ..................................................................................................................................................97
Basic definitions...........................................................................................................................................97
Relative Electron Transport Rate.................................................................................................................98
e capture and quantum eff – setting leaf absorption & PSII ratio...............................................................98
Error messages ............................................................................................................................................99
QUENCHING PROTOCOL –HENDRICKSON –KLUGHAMMER LAKE MODEL:.....................................................100
Cookbook checklist before making quenching measurements..................................................................101
Running the quenching test........................................................................................................................105
Screen drill down diagram for quenching .................................................................................................106
Saturation pulse duration...........................................................................................................................107
Setting saturation pulse duration...............................................................................................................107
Saturation pulse count ...............................................................................................................................109
Saturation pulse interval............................................................................................................................109
Fo’ or Fod mode........................................................................................................................................109
Saturation pulse intensity...........................................................................................................................110
Modulation light source intensity...............................................................................................................111
New -automated modulation light set up ...................................................................................................111
Far red intensity and duration...................................................................................................................112
Actinic intensity..........................................................................................................................................112
Using Default PAR.....................................................................................................................................112
e capture and quantum eff – setting leaf absorption & PSII ratio.............................................................113
Log Set Up..................................................................................................................................................113
Enter a note................................................................................................................................................114
Measurement review ..................................................................................................................................115
Test pre-set files. Saving and loading test parameters...............................................................................116
Error messages common to the test modes ................................................................................................116
RAPID LIGHT CURVES (RCL)...........................................................................................................................118
How they work:..........................................................................................................................................119
Curve fitting software.................................................................................................................................120
Cardinal points description........................................................................................................................120
Saturation Pulse Duration .........................................................................................................................121
What are the limitations of RLC?...............................................................................................................122

4
Cookbook checklist before making Rapid Light Curve measurements......................................................124
Running the RLC Test ................................................................................................................................126
Drill down menu for RLC...........................................................................................................................127
Saving measuring parameters....................................................................................................................128
Loading and saving preset measuring routines .........................................................................................129
Copy presets parameters into a new measuring file ..................................................................................129
Change RLC measuring parameters..........................................................................................................130
Setting modulation light source intensity...................................................................................................130
New -automated modulation light set up ...................................................................................................131
Setting the saturation pulse intensity .........................................................................................................131
Setting saturation pulse duration...............................................................................................................132
Far red light...............................................................................................................................................133
When the PAR Clip is used.........................................................................................................................134
When a PAR Clip is not used “Default PAR”............................................................................................135
Multi-flash vs. standard single flash saturation pulse ...............................................................................136
Relative Electron Transport Rate...............................................................................................................139
Entering a note with a measurement..........................................................................................................141
Other RLC function buttons.......................................................................................................................141
Measurement review ..................................................................................................................................142
Help screen ................................................................................................................................................143
Basic definitions.........................................................................................................................................143
Error messages ..........................................................................................................................................143
CHAPTER 4 •OS5P DATA MANAGEMENT..............................................................................................144
USB DATA TRANSFER ......................................................................................................................................144
File transfer by USB cable.........................................................................................................................145
Ejection process.........................................................................................................................................149
FILE TRANSFER BY SD CARD AND DATA MANAGEMENT UTILITIES.................................................................150
DATA VIEWER .................................................................................................................................................155
SOFTWARE UPDATES .......................................................................................................................................157
CHAPTER 5 DIAGNOSTICS................................................................................................................... 158
APPENDIX A •MAINTENANCE .................................................................................................................. 159
CLEANING........................................................................................................................................................160
MISCELLANEOUS MAINTENANCE.....................................................................................................................160
Battery........................................................................................................................................................160
Circuit breaker...........................................................................................................................................160
Light sources..............................................................................................................................................160
Trouble shooting power problems .............................................................................................................161
Trouble shooting tables..............................................................................................................................162
APPENDIX B•PAR CLIP ...............................................................................................................................165
PAR CLIP ........................................................................................................................................................165
Connection.................................................................................................................................................165
Technical specs ..........................................................................................................................................165
Using the PAR Clip....................................................................................................................................166
What is the value of a PAR clip in photosynthesis measurement?.............................................................167
APPENDIX C •TECHNICAL SPECIFICATIONS...................................................................................... 168

5
APPENDIX D •DATA FORMATS................................................................................................................. 171
OVERVIEW.......................................................................................................................................................171
Data format information............................................................................................................................172
Fv/Fm data file format...............................................................................................................................172
Y(II) data file format ..................................................................................................................................173
Quenching data file format – Hendrickson – Klughammer equations.......................................................174
RCL Rapid Light Curve data format..........................................................................................................175

6
Chapter 1 •Introduction
Overview
This chapter provides you with a list of the equipment that you should have received with your OS1p,
and Information about chlorophyll fluorescence with scientific references.
To select the best chlorophyll fluorescence measuring parameter for your application, consult
the Plant Stress Guide provided as a separate document.
The Plant Stress Guide is available on the CD provided with the OS1p or by visiting
www.optisci.com under Stress Testing, and Receive a Stress Guide with References.

7
Welcome !
Congratulations on your purchase of the OS1p Modulated Fluorometer. Please check the
carton for any visible external damage. If you notice any damage, notify the freight carrier
immediately. Follow their procedures for reporting and filing a claim. The carton and all
packing materials should be retained for inspection by the carrier or insurer.
List of Equipment
Carefully unpack the carton. You should have received the following items:
•OS1p Fluorometer
•Universal Voltage battery charger
•Trifurcated fiber optic light guide with built-in trigger switch
•Ten dark-adaptation cuvettes
•Open body cuvette
•OS1p owner’s manual (this document)
•1 GB MMC/SD data card
•USB cable
•USB SD card reader
•Nylon field bag
If any item is missing, please contact your authorized Opti-Sciences agent.
Getting Started
Throughout this manual, you will be shown setup options and response messages. When an
example of a program screen is given, you may assume that this is shown, as it will appear on
the OS1p.
The user interface consists of a high-resolution color graphic touch screen LCD.
For editing parameters and making measurements, menu options are presented as icons or text
legends. Measuring tests and parameter adjustments are all menu driven. Certain keywords
are used to identify common functions. For example, the word or icon Exit will always step
you to the previous program screen, ultimately ending in the "Main Menu".
The OS1p has default settings that allow the unit to work for many applications, however,
changing the settings are very easily done.
Data is stored in on-board system memory. This is based on flash memory so no data will be
lost if the main battery is depleted. Stored data may be transferred to other systems through
use of the MMC/SD data card, or USB port. The data is output in comma delimited and
carriage return separated ASCII strings, easily importable to most spreadsheet programs such
as Excel and Mat Lab.

8
Chlorophyll Fluorescence
A generalized description as it relates to chlorophyll fluorometry.
The following is a generalized description of the photosynthesis light reaction and the value
of chlorophyll fluorescence for investigation of plant health, plant function and plant stress.
Changes in photosystem II (PSII) fluorescence have been shown to be a sensitive test for most
types of plant stress, and reflect measurable changes of many plant functions including
photochemistry, photoprotective mechanisms, low light survival state transition mechanisms,
and heat dissipation photoinhibition mechanisms. PSII fluorescence measurements have been
found to correlate well with changes in CO2fixation under most conditions (for more detailed
correlation information refer to the section on “quantum photosynthetic yield of PSII”).
Reaction centers are of two types, Photosystem II (PSII), and Photosystem I (PSI). Both are
located in the thylakoid membrane of chloroplasts in higher plants. In bacteria, they are in a
membrane surrounding the cytoplasm or in more intricate constructs. All plants that produce
oxygen have both types of reaction centers.
While Photosystem I goes through a somewhat similar process to PSII, PSI fluorescence does
not vary with plant stress nor does it change as changes occur with various photosynthetic
mechanisms. Therefore PSII fluorescence is used for investigation into these areas.
Light energy utilized in photosynthesis by higher plants and algae cells is collected first by an
antenna pigment system and transferred to reaction centers where light quanta are converted
to chemical energy by chlorophylls in a protein environment. Electron transfer starts in the
reaction center when a chlorophyll molecule transfers an electron to a neighboring pigment
molecule. Pigments and protein involved in this primary electron transfer define the reaction
center. This initial electron transfer is also called charge separation.
Competing models of energy capture and transfer have existed. In the puddle model, each
reaction center possesses its own independent antenna system. In the lake model, reaction
centers share antenna. The “lake model” is considered more realistic for terrestrial plants.
PSII and PSI reaction centers also share antenna during a process called state transitions. This
process takes between ten and twenty minutes as a subset of PSII antenna detach from PSII
reaction centers and migrate to PSI reaction centers (Ruban, Johnson 2009). They can also
move back to PSII reaction centers. The process is governed by the oxidation-reduction state
of the plastoquinine pool, and it is thought to be a survival mechanism for plants to subsist in
low light conditions by balancing light levels between the two types of reaction centers
(Allen, Mullineau 2004). Light level changes and changing light quality can trigger
transitions.
During dark adaptation, higher plants and algae shift toward state 1 conditions and
cyanobacteria to state 2 conditions. (Papageorgiou G.C. Tismmilli-Michael M. Stamatakis K.
2007). State transitions should be considered when deciding on dark adaptation times and for
determination of steady state photosynthesis for quantum photosynthetic yield measurements,
and quenching measurements. State transitions affect measurements more at low light levels
than at high light levels (Lichtenthaler 1999).

9
It is in PSII that oxygen evolution and the splitting of water occurs. In the presence of light
energy, an electron is pulled from a water-splitting complex and is used to reduce a PSII
reaction center.
Charge separation occurs as QA, the primary plastoquinone receptor, is reduced to QA-.
Electrons flow from there to other nearby plastoquinone molecules in the thylakoid membrane
by oxidation-reduction reactions. They act as energy transfer molecules in an electron
transport chain.
The next stop is a cytochrome b6f complex where a proton is supplied to the thylakoid lumen.
These protons and those supplied by the splitting of water are used by an ATP pump in the
thylakoid membrane, in the presence of ATP synthase, to create ATP from ADP. Eventually
the cytochrome b6f complex also supplies an electron to PSI.
PSI then goes through a somewhat similar process to PSII, and eventually produces NADPH
at the end of PSI. Both ATP and NADPH are used as energy sources to drive the dark
reaction, called the Calvin Benson Cycle of carbon fixation.
Factors such as light levels, light quality, water availability, nutrient availability, heat, cold,
herbicides, pesticides, pollution, disease, and genetic make up can all have an impact on CO2
assimilation, plant health and condition. When these factors are not provided at optimal levels
plant stress occurs, and most of these types of plant stress are also reflected in the
fluorescence signal from PSII (For more detailed information about the best test for specific
types of plant stress, consult the Plant Stress guide supplied on this disc or visit
www.optisci.com under stress testing).
In 1989, Bernard Genty found that there is a linear correlation between fluorescent quantum
photosynthetic yield measurements in C4plants and CO2assimilation. In 1990, Genty found a
curve linear correlation between fluorescent quantum photosynthetic yield and CO2
assimilation in C3plants, where photorespiration can also use significant products of electron
transport. Psydo-cyclic electron transport and other electron sinks may also be involved.
Different types of plant stress affect PSII differently, therefore one should consult the Plant
Stress Guide on this disc or contact Opti-Sciences at www.optisci.com to determine the best
measuring protocol or special assay before working with a specific type of plant stress.
Research referenced in the Plant Stress guide shows that while some types of plant stress
affect chlorophyll fluorescence of a plant in a dark adapted state (Fv/Fm), measuring some
types of plant stress, at a sensitive useful level, requires the light adapted Y(II) or )F/Fm’.
The Plant Stress guide is updates on a regular basis. For an updated version contact Opt-
Sciences Inc at www.optisci.com.
The most prominent antenna pigment that absorbs energy is usually chlorophyll a. Other
accessory pigments can also be involved, such as chlorophyll b., carotenoids, or phycobilins
in cyanobacteria, or bacteriochlorophyll in some bacteria. We are primarily concerned with
chlorophyll a fluorescence.
Light energy absorbed initially by the antenna and transferred to the reaction centers is
channeled to competitive, different plant processes that include photochemistry, photo-
protective heat dissipation, and other heat dissipation. Normally a healthy plant will channel

10
about 3%-9% (Govindgee 2004) of the light energy absorbed by chlorophyll pigments as
chlorophyll fluorescence. Healthy plants in a healthy environment will use most light energy
for photochemistry. More stressful environments will channel additional energy to heat
dissipation and fluorescence.
This effect was first observed more than 100 years ago, when N.J.C. Müller (1874), using
colored glass filters, studied the phenomenon. He also noted that fluorescence changes that
occur in green leaves was related to photosynthetic assimilation. Lack of appropriate
technical equipment prevented a more detailed investigation.
The basic OS1p is equipped to make several different kinds of tests including: Dark-adapted
Fv/Fm, Light adapted Yield (Y) or )F/Fm’ or Y(II), Fo, Fm, Fms (or Fm’), Fs (or F’).It will
also measure fluorescence quenching, and rapid light curves.
PAR Clips are sold separately, and are required for ETR, PAR, and Leaf temperature.
PAR Clips are highly recommended for field measurement of Y(II) and ETR. Because Y(II)
values vary not only with plant stress, but also with light level and temperature, only samples
at very similar light levels and light histories should be compared. Sun leaves will respond
differently than shade leaves to different light levels.
The ability to use Rapid light curves will be provided in 2011 without additional charge for
those that buy the advanced version of the OS1p. The advanced version also allows the user
to select quenching protocols of interest when the unit is purchased. Other Protocols may also
be purchased during or after the initial purchase. Fod (or Fo’) are provided in the Kramer, and
puddle model quenching protocols. The default quenching protocol that is offered on the
advanced version of the OS1p is the Luke Hendrickson – Klughammer simplified lake model.
This provides the most versatile quenching solution because it includes NPQ that has been
resurrected from the puddle model. Other protocols are available for an additional charge.
One may replace the Hendrickson protocol with either the Kramer protocol or the puddle
model protocol at the time of purchase for no additional charge.
The quenching options include:
1. Dave Kramer’s lake model parameters (Kramer 2004) - Y(II), qL, Y(NPQ), and Y(NO)
2. Luke Hendrickson’s lake model parameters with Klughammer’s resurrection of NPQ from
the puddle model are included in this protocol - Y(II), Y(NPQ),Y(NO), and NPQ.
3. Puddle model quenching parameters qN, qP, and NPQ.
4. A relaxation protocol for subdividing NPQ into qE, qT, and qI. This protocol may be used
with NPQ in either the puddle model, or the Hendrickson lake model. The test runs at the
same time as the protocols mentioned above. To use this protocol either the Hendrickson or
puddle model protocols must also be purchased.

11
Definitions:
Actinic light source – This is any light source that drives photosynthesis. It may be the Sun,
or an artificial light. Higher end fluorometers contain one or more built-in artificial actinic
light sources for experimentation with specific repeatable radiation (or light) levels. The
OS1p uses a high intensity white light LED.
Dark-adapted or Dark Adaptation – This is a term that means that an area of a plant, or the
entire plant, to be measured has been in the dark for an extended period of time before
measurement. Dark adaption requirements may vary for dark-adapted tests. Dark adaption
times of twenty minutes to sixty minutes are common, and some researchers use only pre-
dawn values. Dark-adapted measurements include Fv/Fm, and non-photochemical quenching
parameters. Longer dark adaption times are common for quenching measurements. In this
case, it is common to use times of eight to twelve hours, or overnight. For a detailed
discussion of dark adaptation, refer to the section on dark adaptation, or the application note
on dark adaptation.
Far red light – is a light source that provides light above 700 nm to drive PSI, drain PSII of
electrons, and allow the rapid re-oxidation of PSII. It is used extensively for the determination
of quenching parameters in Quenching protocols, and for pre-illumination and rapid re-
oxidation of PSII in Fv/Fm measurements. Fo’ or Fod is used in determining Kramer’s
quenching parameters, as well as puddle model, qN. They require the use of far red light to
determine quenched Fo’ or Fod.
Modulated light source This is the light source that makes light adapted quantum
photosynthetic yield measurements possible along with direct measurements of Fo and Fo’ or
Fod. The modulated light source is used at an intensity range that is too low to drive
photosynthesis and yet allows fluorescence measurement of pre-photosynthetic Fo, and post
photosynthesis Fo’ or Fod. This light source is turned off and on at a particular frequency.
The frequency is adjusted automatically for optimal application usage. Intensities are adjusted
between >0 to 0.4 :mols. The intensity must be set differently for light and dark-adapted
methods. It is critical to adjust the intensity of this lamp correctly in dark-adapted protocols to
prevent driving photosynthesis in Fv/Fm, and quenching measurements. For more details see
the application note on dark adaptation.
Saturation pulse is a short pulse of intense light designed to fully reduce a leaf’s PSII
system. For higher plants, the optimal duration of the saturation pulse is between 0.1 seconds
and 1.5 seconds (Rosenqvist and van Kooten 2006). In algae and Cyanobacteria, the optimal
saturation pulse duration is between 25ms. and 50ms. It is typically a white light that has to be
high enough to close all PSII reaction centers. On the OS1p an LED light source is used.
Opti-Sciences uses 0.8 seconds as the default saturation pulse duration for higher plants. This
duration is adjustable from 0.025 to 2.0 seconds.
Fm - is maximal fluorescence measured during the first saturation pulse after dark adaption.
Fm represents multiple turnovers of QA with all available reaction centers closed. All
available energy is channeled to fluorescence.

12
Fs also known as F’ is the fluorescence level created by the actinic light . Initially the value is
high and then decreases over time to steady state values due to the initiation of electron
transport, carboxilation, and nonphotochemical quenching. Fs has also been used to designate
steady state F’ conditions.
Fms – also known as Fm’ is the saturation pulse value that is not dark-adapted. They are at a
lowered values due to NPQ or non-photochemical quenching. When this parameter has
reached steady state, it is used to calculate photosynthetic Yield - Y(II) or )F/Fm’ along with
Fs. Fms at steady state is also used to calculate qN, NPQ, qP, qL, Y(NPQ), Y(NO), qE, qT,
and qI.
Fo is minimal fluorescence after dark adaptation. It is measured with a modulated light
intensity too dim to drive photosynthesis and yet bright enough to detect “pre-photosynthetic”
antennae fluorescence.
Fod – also known as Fo’, is the minimal value after the actinic light has been turned off and
after a far red light is turned on for several seconds. It represents Fo with non-photochemical
quenching. It may also be described as minimum chlorophyll fluorescence yield with
maximal opening of all PS II reaction center traps in a light-acclimated state.
Ft – is the current instantaneous fluorescent signal shown on the fluorometer measuring
screen. It is used to set the modulated light source intensity. See setting the modulated light
source intensity.

13
FV/Fm measuring Screen
Fv/Fm = (Fm – Fo) / Fm This is a dark adapted test used to determine Maximum quantum
yield. This ratio is an estimate of the maximum portion of absorbed quanta used in PSII
reaction centers (Kitajima and Butler, 1975). Another way to look at Fv/Fm is a measurement
ratio that represents the maximum potential quantum efficiency of Photosystem II if all
capable reaction centers were open. 0.79 to 0.84 is the approximate optimal value range for
most land plant species with lowered values indicating plant stress. It is important to dark-
adapt samples properly for reliable test results. Since dark adaption requirement can vary with
species and light history, testing should be done to ensure proper dark adaption, (See the
section on dark adaptation). This test is a normalized ratio.
Y(II) or Yield Measuring Screen
Yield or quantum photosynthetic yield of PSII= (Fm’ – Fs) / Fm’ -This test is also
known as ΔF/Fm’ or Y(II). Yield of PSII is a fast light adapted test taken at steady state
photosynthesis levels. It provides a measure of actual or effective quantum yield. This ratio is
an estimate of the effective portion of absorbed quanta used in PSII reaction centers. (Genty,
1989) It is affected by closure of reaction centers and heat dissipation caused by non-
photochemical quenching. Y(II) allows investigation of the photosynthetic process while it is
happening. No dark adaption is required. According to Maxwell and Johnson (2000) it takes
between fifteen to twenty minutes for a plant to reach steady state photosynthesis at a specific
light level. To obtain a reliable Y(II) measurement, photosynthesis must reach steady state.
Fast -Light Adapted Y(II)
Yield Test - Usually less than 2 seconds
Fast -Dark Adapted Fv/Fm
Usually less than 2 seconds

14
This is usually not a concern when using ambient sunlight or artificial greenhouse light,
however, clouds and light flecks below a canopy level can cause problems. If one uses a built
in fluorometer actinic illuminator to measure yield, make sure that steady state photosynthesis
has been reached (See the discussion on Yield for more information). Remember that ambient
Sun light contains FAR red illumination for activation of PSI. It is something to consider
when using an internal illuminator for Yield measurements. Far Red illumination is an option
when using internal actinic illumination for yield measurements. See the section regarding an
in depth discussion on quantum photosynthetic yield.
Yield has been found to be more sensitive to more types of plant stress than Fv/Fm, however
one must only compare measurements at the same light level as the value changes at different
light levels. A PAR clip should be used with the fluorometer to measure Yield in all field
applications. This allows for proper comparisons of values and the determination of ETR or
electron transport rate, a parameter that includes both yield and actinic light level. See the
Stress guide for more details.
Light adapted measurements include Yield of PSII or )F/Fm’ or Y(II), ETR, PAR (or PPFD),
and Leaf Temp. With RLC (rapid light curves) The OS1p measures ETRmax, lk, and ‘.
µE – is a micro Einstein. This a dimension that involves both time and area. It is equivalent
to the micro mol. Both terms have been used extensively in biology and radiation
measurements.
µmls - is a micro mole(also abbreviated µmol, or µmol m-2s-1 ) . This a dimension that
involves both time and area (per meter squared per second) . It is equivalent to the micro
Einstein. Both terms have been used extensively in biology and radiation measurements.
µmol – or micro mole(also abbreviated µml, or µmol m-2s-1 ) . This a dimension that involves
both time and area (per meter squared per second) . It is equivalent to the micro Einstein.
Both terms have been used extensively in biology and radiation measurements.
1µE
PAR – Photosynthetically Active Radiation between 400nm and 700nm. Measured in either
µmols or µE. PAR can be measured in different dimensions such as Watts per meter or in
micro- Einsteins or micro-moles. When using a PAR Clip, dimensions will always be in the
equivalent terms, micro-Einsteins, or micro-moles
PAR Clip – This is a fluorometer accessory that allows the measurement of PAR or PPFD
and Leaf Temperature along with Yield or Y(II) measurements. Since Yield changes with
PAR radiation (or light) levels and temperature levels as well as plant stress, the ability to
record Yield values with these parameters provide control over important variables. A PAR
Clip allows the calculation of relative ETR or Electron Transport Rate. It will also work with
the internal fluorometer actinic illuminator, to measure reproducible and repeatable controlled
values. PAR clips are recommended for field use with quantum photosynthetic yield
measurements. See the section on quantum photosynthetic yield for an in depth discussion.

15
PPFD - Photosynthetic Photon Flux Density is the photon flux density of PAR. Measured in
either umls or uE., PPFD, or “photosynthetic photon flux density”, is the number of PAR
photons incident on a surface in time and area dimensions (per meter squared per second).
These terms are equivalent for PAR Clip leaf radiation measurements. Furthermore, both can
be presented in either of the equivalent dimensions, micro-moles (µmols) or micro-Einsteins
(µE).

16
Y(II) or Yield Measuring Screen
Quantum photosynthetic yield of PSII – an in depth
discussion of its value and limitations.
Yield (or )F/Fm’ or (Fm’ – Fs) / Fm’) or Y(II) is a time tested light adapted parameter that is
more sensitive to more types of plant stress than Fv/Fm according to a survey of existing
research. While Fv/Fm is an excellent way to test for some types of stress and the health of
Photosystem II in a dark adapted state, Quantum Photochemical Yield is a test that allows the
measurement of the efficiency of the overall process under actual environmental and
physiological conditions. It has also been found to be more sensitive to more types of plants
stress. See the Plant Stress Guide on this disc or contact Opti-Sciences at www.optisci.com
for details.
Quantum Photochemical Yield of PSII is a normalized measurement ratio that represents
achieved efficiency of photosystem II under current steady-state photosynthetic lighting
conditions. (Genty 1989), (Maxwell K., Johnson G. N. 2000), (Rascher 2000) It is affected by
closure of reaction centers and heat dissipation caused by non-photochemical quenching
(Schreiber 2004).
As ambient light irradiates a leaf, about an average of 84% of the light is absorbed by the
leaf, and an average of 50% of that light is absorbed by the antennae associated with PSII and
transferred to PSII (Photosystem II) reaction centers. (Leaf Absorption can range from 70% to
90% (Eichelman H. 2004) and PSII absorption can range from 40% to 64% (Edwards GE
1993) (Laisk A. 1996)). Under normal non-stressed conditions, most light energy is channeled
into photochemistry with smaller amounts of energy channeled into heat and fluorescence. In
photosystem II, this process is competitive so that as plant stress occurs, mechanisms that
dissipate heat, photo-protect the leaf, and balance light between photosytem II and
photosystem I, change the output of fluorescence and heat. In other words, conditions that
maximize photochemistry minimize fluorescence and heat dissipation and conditions that
maximize fluorescence minimize photochemistry and heat dissipation.

17
Once these mechanisms have achieved an equilibrium at a specific light level and
temperature, steady state photosynthesis has been achieved. This is a process that takes fifteen
to twenty minutes (Maxwell and Johnson 2000). Once at steady state photosynthesis, a very
intense short light pulse, called a saturation pulse, is used to momentarily close or chemically
reduce all capable PSII reaction centers. Apart from the known exceptions listed under
“Correlation to Carbon Assimilation” later in this discussion, quantum photochemical yield
will reflect changes in the function levels of PSII antennae, PSII reaction centers, electron
transport, carbon assimilation, and regulatory feedback mechanisms.
Y(II) = (Fm’- Fs) / Fm’
Quantum photosynthetic yield is measured only at steady state photosynthesis. Fs is the
fluorescence level at steady state photosynthesis, and Fm’ maximum fluorescence value
measured during a saturation pulse, and is taken to mean that all PSII reaction centers are
closed. In a high light environment, this may not be true and the multi-flash method may be
required. See the multi-flash section for more details.
Graphic display of a single Yield measurement taken with a PAR Clip. Yield measurements
may also be taken with an Open Body Clip (without PAR or temperature measurement).
Yield Y(II) will change at different light levels and temperatures so it can be of great value to
use a heavily recommended accessory called a PAR Clip that measures Y(II) relative to light
intensity, or irradiation level, and temperature. PAR Clips measure Photosynthetically Active
Radiation between the wavelengths of 400 nm and 700nm. When the dimensions per square
meter per second in micro-mols or micro-einsteins are added, this parameter becomes
Photosynthetic Photon Flux Density (or PPFD) (micromoles and micro-einsteins are
equivalent, and when using a PAR Clip, PAR and PPFD are equivalent).

18
NOTE: It is possible to misinterpret results if PAR and temperature changes are not
taken into account. One leaf may appear to be stressed compared to another when the
only difference is light irradiation level. PPFD or PAR must be measured very close to
the sample or errors can result.
In addition, it is important not to change the orientation of a leaf and to avoid shading the
sample measuring area with the PAR clip or by other means. Extraneous reflections and
breathing on the sample should also be avoided (Rosenqvist and van Kooten 2006).
PAR Clips also allow measurement of relative ETR or relative Electron Transport Rate. ETR
is a parameter designed to measure the electron transport of PSII. It has also been found to
correlate well with CO2 assimilation. More advanced fluorometers provide built-in
illuminators for greater experimental control of light irradiation intensity. This allows pre-
illumination with a controlled predetermined intensity value for sample comparison.
For reliable Yield and ETR measurements, photosynthesis must be at steady state and with
illumination on the same side of the leaf that is being measured (see number eight under
correlation to carbon assimilation). Steady state photosynthesis is an equilibrium condition
reached after a several minutes of exposure to existing light radiation conditions. Maxwell
and Johnson (2000) tested 22 different species of British plant and found that steady state
occurred in fifteen to twenty minutes in the plants measured. Measurements taken under
variable
lighting conditions may not provide reliable Yield results (Rascher 2000). No dark adaptation
is required for Yield measurements.

19
Correlation to Carbon assimilation:
In 1989, Genty developed the yield measurement and provided strong evidence of a linear
correlation between Yield measurements, Electron Transport Rate, and CO2 assimilation for
C4 plants (Baker and Oxborough 2004) and many others have confirmed the relationship
(Edwards and Baker 1993), (Krall and Edwards 1990, 1991), (Siebke 1997). It was found that
a curve-linear correlation between Yield and CO2 assimilation exists for C3 species where
photorespiration can also use significant products of electron transport (Genty 1990),
(Harbinson 1990), (Baker and Oxborough 2004). Psydo-cyclic electron transport and other
electron sinks may also be involved.
Limitations of Y(II) or )F/Fm’
The strong relationship between Yield and CO2 assimilation correlation has been reaffirmed
repeatedly by many researchers with the following caveats:
1. There is a small percentage of chlorophyll fluorescence that comes from photosystem I that
does not change with light intensity (PPFD) or plant stress. Therefore, the error is greatest at
very high light levels when yield is minimized and PSI fluorescence remaining constant. This
error is not large (Baker Oxborough 2004).
2. “Super-saturating flash” error is produced by using a very intense saturation light source
that is longer that 2 milliseconds causing multiple turnovers of primary PSII receptor QAand
the reduction of plasotoquinone to plastoquinol. This raises Fms (or Fm’) and can cause an
overestimate of Yield by less than 10% (Baker and Oxborough 2004), (Schreiber 2004). Use
of a super-saturation flash is by far the most common method of measuring yield in higher
plants.
3. Cold stress can produce a non-linear correlation with CO2assimilation. Electron transport
of PSII in cold stressed corn far exceeds the requirements for CO2assimilation by more than
three to one. This indicates, that under these conditions, other electron sinks are at work. The
ratio of ETR to CO2assimilation, under cold stress, can be diagnostic for cold stress. (Fryer
M. J., Andrews J.R., Oxborough K., Blowers D. A., Baker N.E. 1998)
4. The ratio of ETR to CO2assimilation can be diagnostic for water stress in C3plants. C3
plants exhibit strong electron transport rates for early and moderate levels of water stress even
when CO2assimilation has decreased due to water stress. This indicates that there are other
electron sinks for electron transport. (Ohashi 2005). This problem of early water stress
measurement and detection may be overcome by using the Burke assay (Burke 2010). Yield
can be used to measure very early water stress (Burke 2007 and Burke 2010).
5. Mangrove leaves growing in the tropics. Here again electron transport rate is more that
three times that of CO2assimilation. It is believed that this is mostly due to reactive oxygen
species as an electron sink. (Baker Oxborough 2004), (Cheeseman 1997)

20
6. Measurements not taken at steady state photosynthesis can lead to non-linearity caused by
state transitions. This error can be in the range of 10% to 30% depending on the organism
(Allen and Mullineau 2004). The error can be avoided by allowing plant samples to reach
steady state photosynthesis, a process that takes between fifteen and twenty minutes (Maxwell
and Johnson 2000).
7. At very high light stress levels, the correlation between ETR and CO2assimilation breaks
down. It is thought by some to be caused by the inability of the most intense saturation light
sources to completely close all PSII reaction centers under high light stress conditions. To
compensate for this issue, Earl (2004) uses saturation pulses at various levels and extrapolates
the saturation pulse fluorescence intensity at infinity using linear regression analysis. This
method restores the correlation of ETR and CO2 assimilation and it is an option that is
offered on the Opti-Sciences OS1p and the OS5p.
8. While linear correlation and curvilinear correlation are possible (Genty 1989), (Genty
1990), (Baker Oxborough 2004), exact correlation between fluorescence ETR and gas
exchange ETR is not possible due to the fact that fluorescence comes from only the upper
most layers of the leaf while gas exchange measurements measure lower layers as well
(Schreiber 2004).
9. In CAM plants, gas exchange measurements are not possible during daylight hours so
Yield measurements can provide insights into daytime light reactions (Rosenqvist and van
Kooten 2006).
As illustrated by the exceptions listed above, in some cases the relationship between light
reactions and dark reactions is not straightforward. The energy molecules ATP and NADPH
can be used for carbon fixation and for photorespiration (Rosenqvist and van Kooten 2006),
or light reaction electrons may flow to other electron sinks (Ohashi 2005), (Baker Oxborough
2004), (Fryer M. J., Andrews J.R., Oxborough K., Blowers D. A., Baker N.E. 1998). For this
reason, it is not uncommon for authors to differentiate between work done under non-
photorespiratory conditions and under photorespiratory conditions (e.g. Earl 2004), (e.g.
Genty B, Harbinson J., Baker N.R. 1990).
The Opti-Sciences chlorophyll fluorometer models OS5p and OS1p can be used to make
Quantum Photosynthetic Yield Y(II) measurements. Both units accommodate optional digital
PAR Clips.
Yield,Y(II), is the more versatile fluorescence measuring parameter, but it is best to use a
system that offers multiple test parameters for diverse stress applications. While systems that
provide true yield measurements tend to cost more than ones that provide just Fv/Fm
measurements, they offer greater capability.
Table of contents
Other opti-sciences Measuring Instrument manuals