PiezoDrive PDUS200-PWR User manual

PDUS200-PWR 200W Ultrasonic Driver
Manual and Specifications
PiezoDrive Pty. Ltd.
www.piezodrive.com

Contents
1Warnings / Notes .......................................................................................................................................3
2Specifications .............................................................................................................................................4
3Software Manual........................................................................................................................................5
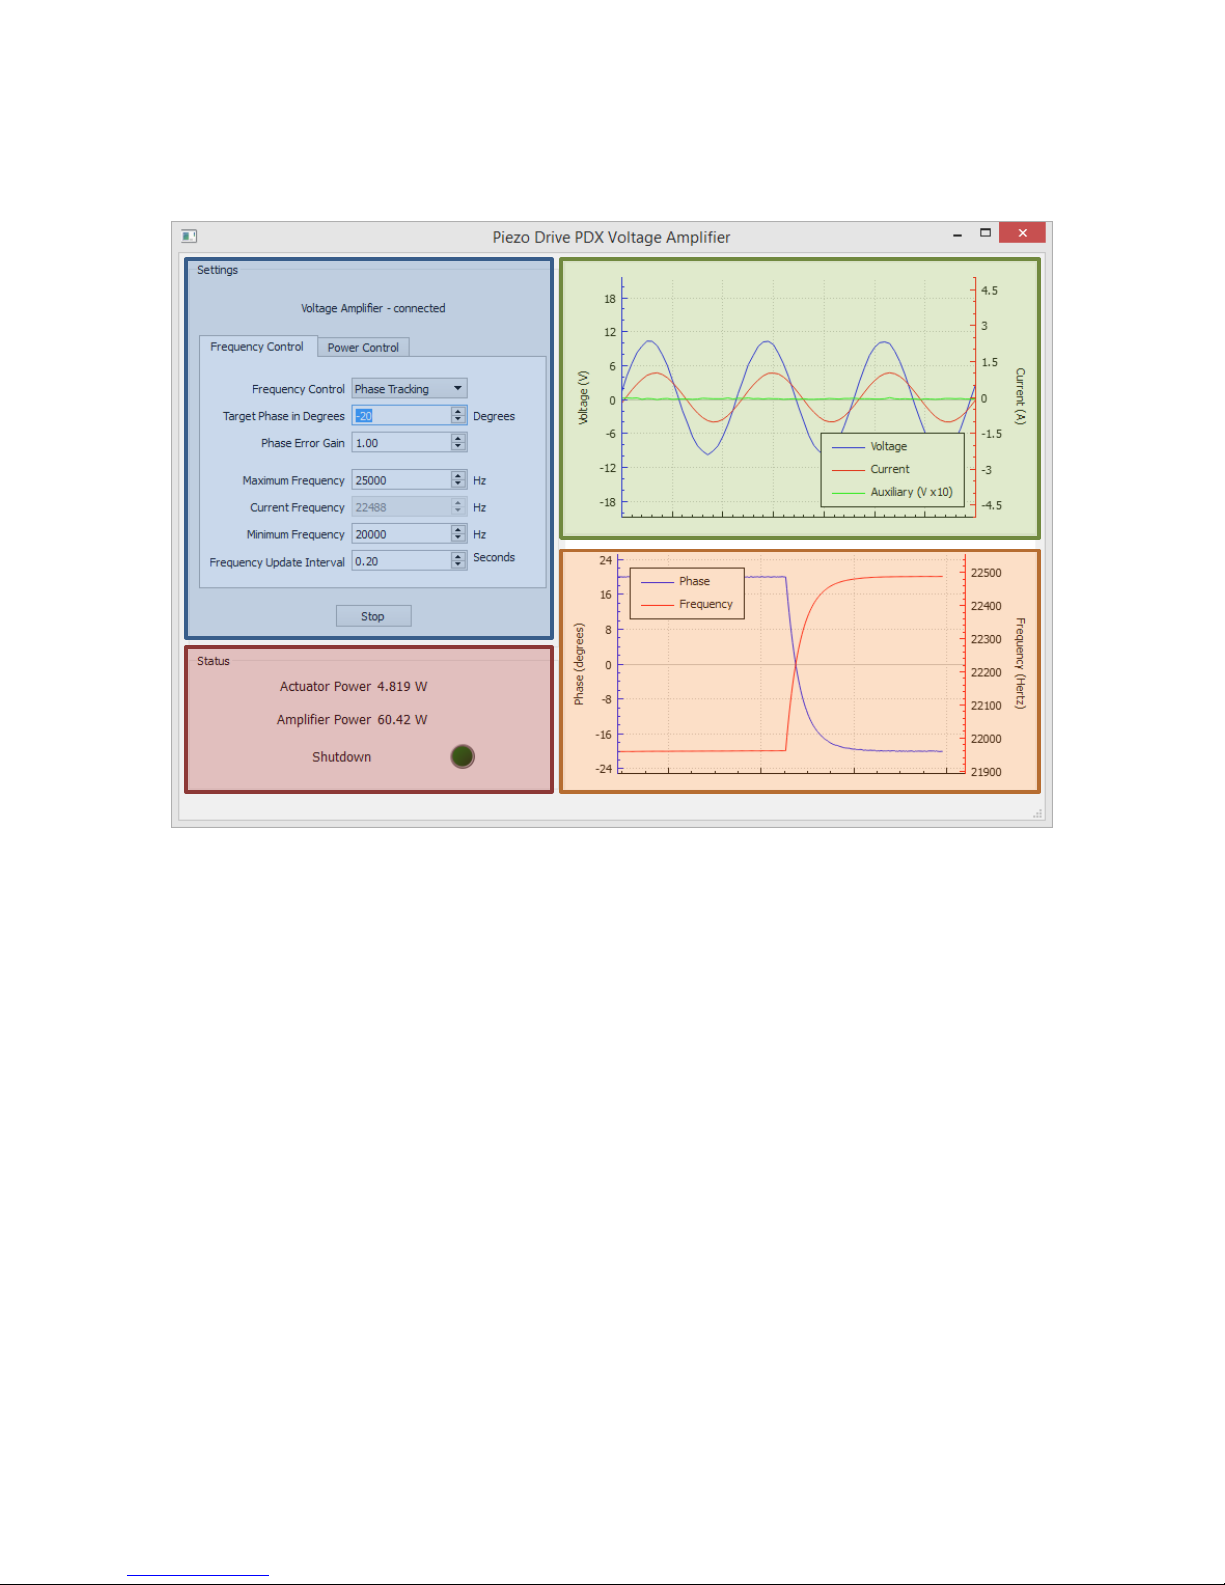
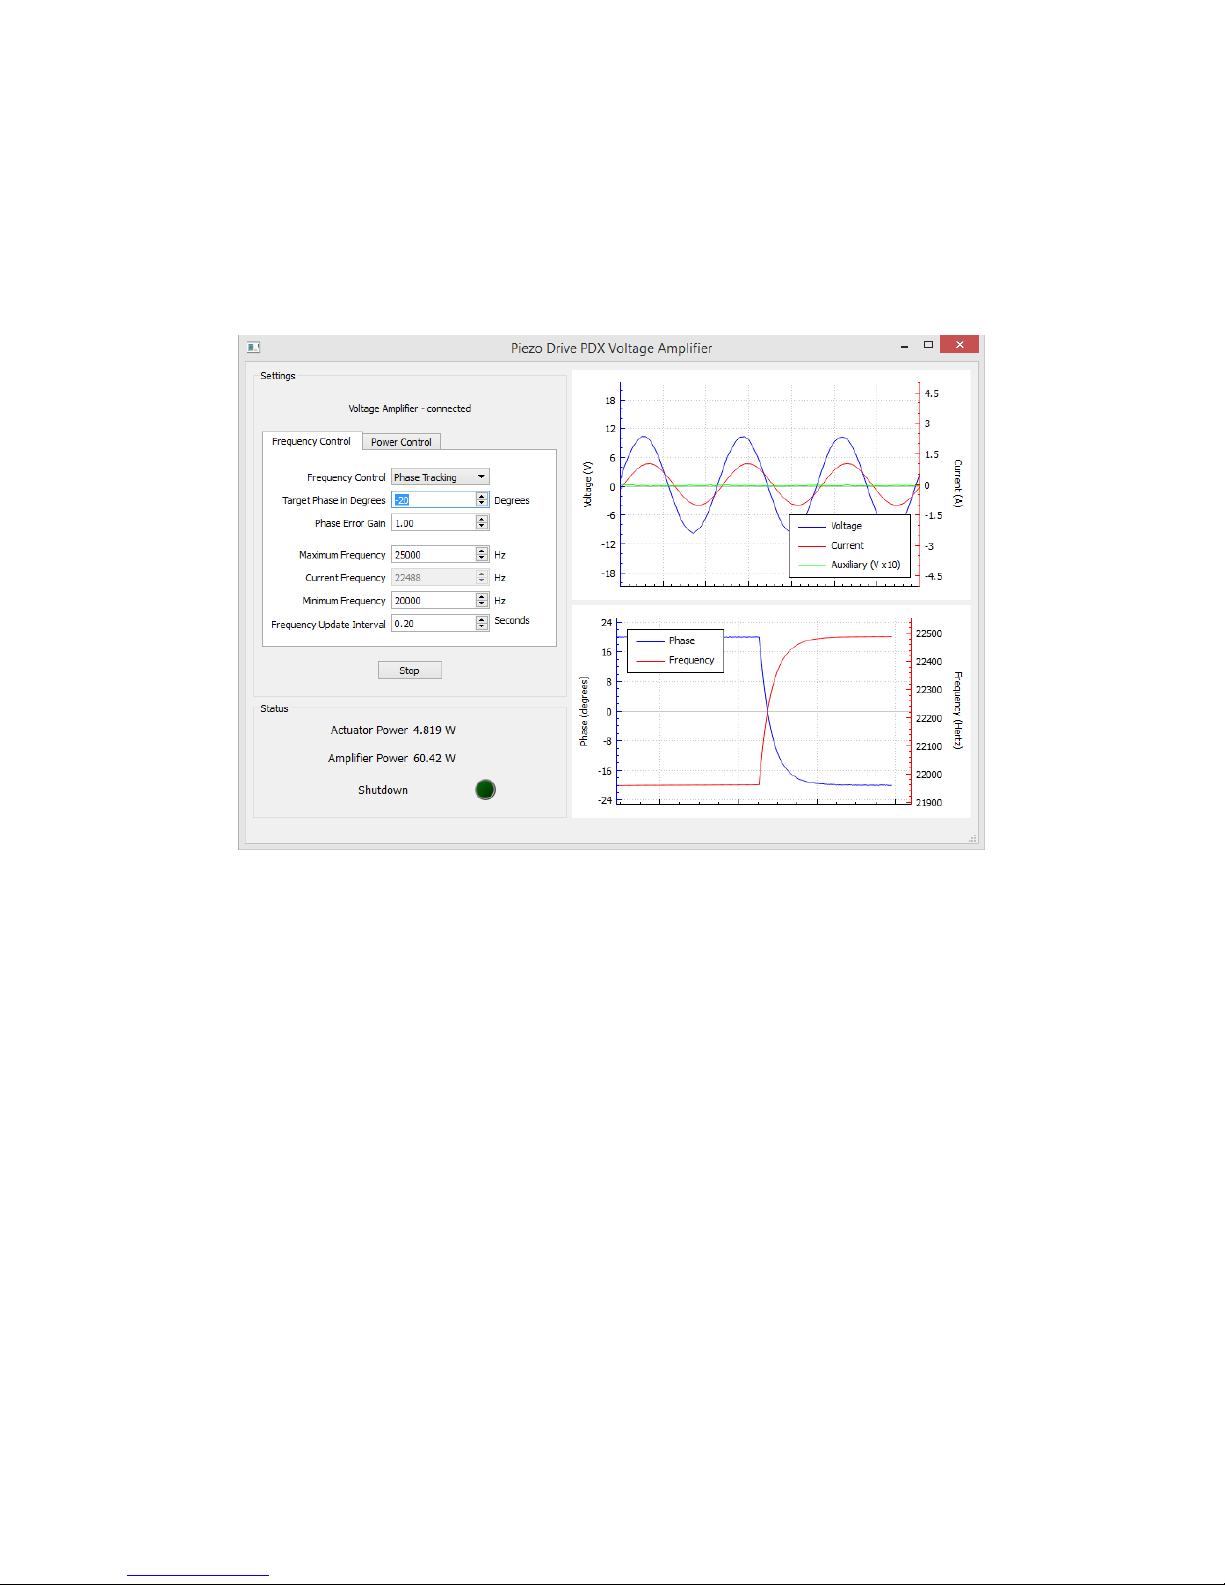
3.1 Main Window......................................................................................................................................5
3.1.1 Overview ......................................................................................................................................5
3.1.2 Status ...........................................................................................................................................6
3.2 Plot Windows ......................................................................................................................................6
3.2.1 Graph Scale ..................................................................................................................................6
3.2.2 Legend Position............................................................................................................................7
3.2.3 Exporting Graph Data...................................................................................................................7
3.2.4 Notes on Graph Functions ...........................................................................................................7
3.3 Manual Control Mode.........................................................................................................................7
3.4 Resonance Tracking Mode (Phase Tracking).......................................................................................8
3.5 Resonance Tracking Mode with Power Control..................................................................................9
3.6 Frequency Sweep Mode....................................................................................................................10
3.6.1 Dynamic Range ..........................................................................................................................11
4Hardware Manual ....................................................................................................................................12
4.1 Output Connection Diagram .............................................................................................................12
4.1.1 LEMO Plug Cable Preparation....................................................................................................13
4.1.2 LEMO Plug Assembly..................................................................................................................13
4.2 Overload Protection..........................................................................................................................14
4.2.1 Shutdown Indicator ...................................................................................................................14
4.2.2 External Shutdown.....................................................................................................................14
4.2.3 Enclosure....................................................................................................................................14
5Installation ...............................................................................................................................................15
6API Functions ...........................................................................................................................................15

1Warnings / Notes
1) This device produces hazardous potentials and should only be used by suitably qualified personnel
under the supervision of an observer with appropriate first-aid training. Do not operate the device
when there are exposed conductors.

2Specifications
Electrical
Frequency
1 to 50 kHz (Pure Sine-wave)
Output Voltage
100 V
Output Current
4 A
Transducer Power
200 W
Signal Bandwidth
100 kHz
Slew Rate
35 V/us
Gain
15 V/V
Overload
Thermal and over current
protection
Analog Outputs
Voltage and current monitors
Analog Inputs
Signal input (7.5 V)
Auxiliary monitor input (10 V)
Output Connectors
LEMO 0B Socket
4mm Banana Sockets
Power Supply
90 Vac to 250 Vac
Mechanical
Environment
-40 to 60C (-40 to 140F)
Non-condensing humidity
Dimensions
212 x 304.8 x 88 mm
Weight
2 kg
Digital
USB
USB 2.0
Frequency Resolution
1 mHz
Phase Resolution
0.1 Degrees
Sampling Rate
1 MHz
Available Signals
Voltage, current, auxiliary
Amplifier Shutdown
USB or Digital (Via BNC)

3Software Manual
3.1 Main Window
Figure 1. Main software window
The main window is comprised of four sections, the
Settings control panel,
Amplifier status panel,
Signal waveforms graph, and
Phase and frequency graph.
3.1.1 Overview
The amplifier is controlled by the settings control panel, which is comprised of the mode selection boxes,
the numeric parameters, and the Start/Stop button. The available settings depend on the mode and
whether the amplifier is running.
Most of the settings can be controlled by multiple input methods:
clicking the controls in the widget
the up, down, page up, and page down keyboard keys
the mouse scroll wheel
numeric text input.
Settings
Status
Signals
Phase and
Frequency

3.1.2 Status
The Status section of the Main Window reports the power being dissipated by the actuator and the
amplifier, and the amplifier shutdown indicator.
Actuator Power
The Actuator Power is calculated by
where and are the samples of voltage and current and and are the average (DC) values. is
chosen to include an integer number of the waveform periods.
The amplifier power is calculated by
where is
where is the total supply voltage (200V) and is supply current which is calculated by averaging the
rectified output current
Shutdown
The shutdown indicator is activated when the amplifier has entered a shutdown state due to a current
overload or when the temperature of the amplifier exceeds 100 ºC (212 ºF). In the shutdown state, the
amplifier output is switched to high-impedance.
3.2 Plot Windows
The user can interact with the plot windows with a number of controls.
3.2.1 Graph Scale
The scale of an axis can be controlled by clicking it then moving the mouse scroll wheel. The limits of the
axis can also be adjusted by clicking and dragging. To de-select an axis, the user can left-click on the graph
area. The graphs auto-scale by default but this is disabled once the user has made a manual adjustment. To
re-enable autoscaling the user can double click the axis to enable auto-scaling.

Figure 2. An example where the scale and offset of the phase and frequency plot is manually controlled
3.2.2 Legend Position
To adjust the legend position, right-click the legend and select a new position.
3.2.3 Exporting Graph Data
To export a graph, right-click the graph area select either ‘Save as PDF’ or ‘Save as CSV’, then select the file
location.
3.2.4 Notes on Graph Functions
The x-axis of the Phase and Frequency
graph is fixed and cannot be selected or
adjusted.
Auto-scaling is not disabled for the
Actuator Impedance or Auxiliary Transfer
Function graphs while the sweep is active.
The graph is auto-scaled until the sweep is
complete.
3.3 Manual Control Mode
The amplifier operates in manual mode when the Frequency Control is set to “Manual” and the Power
Control is set to “fixed amplitude”. In this mode the amplifier generates a sine wave output with the
amplitude and frequency set in the settings control panel. The controls that are available in this mode are:
Driving Amplitude Peak to Peak controls the peak-to-peak voltage of the drive signal. It can take
integer values between 0V and 200V.
Maximum Frequency controls the frequency limits of the Current Frequency and can be set
between the 10 kHz and 100 kHz. If this value is adjusted below the Current Frequency, the Current
Frequency is adjusted to comply with the Maximum Frequency setting.
Current Frequency can be set to an integer value between the Minimum Frequency and Maximum
Frequency.

Minimum Frequency can be set to an integer value between 1 kHz and the Maximum Frequency. If
this value is adjusted above the Current Frequency, the Current Frequency is adjusted to comply
with the Minimum Frequency.
Power. If the power dissipated in the actuator is greater than this value, the actuator power
reading in the status panel changes to bold red text to alert the user.
Start/Stop button. Enables/disables the signal generator.
The above settings can be adjusted whether the amplifier is stopped or started. The user can also switch
between Test Signal and Resonance Tracking when the amplifier is stopped or started.
Figure 3. Manually controlled frequency and amplitude
3.4 Resonance Tracking Mode (Phase Tracking)
Resonance tracking is achieved by setting the Frequency Control to “Phase Tracking”. In this mode the
amplifier adjusts the frequency of the drive voltage to maintain a constant phase between the drive
voltage and current. All of the controls described above are available in resonance tracking mode, with the
addition of:
Frequency Step controls the rate of change in the frequency adjustment. The next frequency is
calculated by
High values of Frequency Step cause the drive frequency to adjust more quickly but may be less
stable. The Frequency Step can be set between 0.01 and 10.0.

Target Phase of the current relative to the drive voltage. This is equivalent to the phase of the
admittance, which is the inverse of impedance. Negative values indicate a current lag (inductive),
and positive values indicate a current lead (capacitive)
Frequency Update Interval sets the minimum amount of time that the amplifier will wait between
frequency updates. Longer intervals allow the transient response to settle before the next phase
measurement, at the expense of update rate.
Figure 4. Resonance tracking using phase control and fixed amplitude
3.5 Resonance Tracking Mode with Power Control
In addition to resonance tracking, the applied voltage can also be controlled to achieve a constant actuator
power dissipation. This mode is entered by setting Power Control to “Power Tracking”. The additional
settings in this mode are:
Power is the desired real power dissipation in the actuator.
Power Error Gain sets the rate at which the voltage is adjusted. The useful range is between 0.1
and 10. A value of 0.5 is recommended during initial testing.
Power Control Region sets the phase range where the power control is active. The power control is
only active when the phase error of the resonance tracking is less than the numeric value (in
degrees). That is, the resonance tracking function occurs first; then the power is controlled when
the phase error is less than 10 degrees (default value).

Figure 5. Resonance control with power tracking
3.6 Frequency Sweep Mode
In the frequency sweep mode, the impedance of the transducer is measured from the set Minimum to
Maximum frequency. Since many ultrasonic actuators exhibit a non-linear resonance at high-power, the
frequency is swept in both directions. 500 points are recorded in both directions; therefore the resolution
is controlled by the Maximum and Minimum Frequency. During the frequency sweep, there is a fixed
200 ms delay between measurements to allow for the decay of transients between frequency changes, this
results in 5 measurements per second and a total sweep time of 200 seconds.
Figure 6. The frequency sweep window

In the Frequency Sweep mode, the available controls are:
Driving Amplitude Peak to Peak
Maximum Frequency
Minimum Frequency
Start/Stop button.
In addition to the impedance measurement, the transfer function between the voltage and an auxiliary
signal can also be measured simultaneously by applying an auxiliary signal to the front panel. Typical
signals include the acceleration, velocity, or displacement. A scaling coefficient is available below the
Auxiliary Transfer Function plot which allows the vertical scale to be equated to the sensor gain.
3.6.1 Dynamic Range
The dynamic range of the frequency response measurement is 12-bit relative to the full-scale range of the
current measurement, which is 5 Amps. Therefore, the minimum detectable current is 3 mA.
Furthermore, in order to allow grounded transducers, the internal current measurement is performed on
the “high-side” of the load which is subject to a large common-mode signal. The common-mode rejection
ratio of the current measurement is approximately -80 dB at 100 kHz. This may also limit the detection of
small currents when large voltages and high frequencies are encountered.
Due to the limited dynamic range, the PDUS200 will not accurately measure anti-resonances in the
impedance transfer function where very little current is flowing. Precise measurement of the system anti-
resonances are best performed using a shunt resistor to ground and a dedicated spectrum, or network
analyzer.
The minimum detectable signal in the auxiliary transfer function is 5 mV.

4Hardware Manual
4.1 Output Connection Diagram
The actuator can be connected to the amplifier by either two 4mm banana plugs or a 2-way LEMO 0B
socket (LEMO EGG.0B.302.CLL). Preassembled LEMO cable assemblies are available from
www.PiezoDrive.com
The mating plug is a LEMO 0B 2-Way Straight Cable Plug. Ordering details and specifications are listed
below. These parts can be obtained directly from www.mouser.com
Plug
LEMO 0B 2-Way Straight Cable Plug
Crimp Terminal Version
*LEMO FGG.0B.302.CYCZ
Solder Tag Version
LEMO FGG.0B.302.CLAZ
Max Conductor Size
AWG22
Cable Collet
FGG.0B.742.DN
Cable Diameter
3.1mm –4mm
Strain Relief Boot
GMA.0B.035.DN (3.5–3.9mm Cable)
*The crimp terminal plug requires a tool, if this is not available, the solder tag plug should be used.
A two conductor cable is required to connect the amplifier to a transducer. A recommended cable is the
Belden 8451 cable. The specifications are listed below.
Cable
Belden 8451
Conductor Size
AWG22 (0.64mm diameter)
Resistance
53 mOhms/m
Capacitance
115 pF/m core–core, 220 pF/m core-shield
Outside Diameter
3.5mm
The actuator wiring diagram is shown below.
Female Panel Socket Male Cable Plug Actuator
HV +
GND
+
-

4.1.1 LEMO Plug Cable Preparation
(Taken from LEMO 0B Series Cable Assembly Instructions)
4.1.2 LEMO Plug Assembly
(Taken from LEMO B Series Cable Assembly Instructions)
1. Strip the cable as above
2. If the cable is shielded, fold the
shield back over the cable
3. Slide the strain relief, collet nut (1)
and collet (3) onto the cable.
4. Solder or crimp the conductors onto the contacts.
5. Assemble the plug,

4.2 Overload Protection
4.2.1 Shutdown Indicator
The Shutdown indicator will illuminate during a shutdown caused by a current overload or if the amplifier
overheats as a result of excessive ambient temperature, poor air-flow, or fan failure.
During shutdown, the amplifier output current is limited to a few mA and may float to the high or low
voltage rail if the load impedance is high.
When the amplifier is turned on, the overload protection circuit is engaged by default and will take
approximately three seconds to reset.
4.2.2 External Shutdown
In addition to the internal shutdown triggers, the output stage of the amplifier can also be disabled by
applying a positive voltage to the external shutdown connector (2V to +12V).
The impedance of the external shutdown input is approximately 2.5 kΩ.
4.2.3 Enclosure
The PDUS200 Driver has a side air intake and rear exhaust. These vents should not be obstructed. If
sufficient air-flow is not available, the amplifier will enter a thermal overload state as discussed above.
The PDUS200 amplifiers can be bolted together in a side-by-side two-channel arrangement. With the
addition of rack-mount handles, this configuration can be mounted into a standard 19-inch rack. A 19-inch
rack-mount kit is also available for a single amplifier.

5Installation
The PDUS200 desktop software is straight-forward to install and remove. Simply copy the program folder
to a convenient location, for example, the desktop; then open the application “PDUS200.EXE”. If desired, a
shortcut can be created by right clicking PDUS200.EXE and selecting “Create Shortcut”, this shortcut can be
placed on the desktop or dragged into the start menu.
The USB drivers are plug-and-play, no installation is necessary.
6API Functions
All of the amplifier functions can be controlled from any Windows application by utilizing the PDUS200
Application Programming Interface (API). The API is a DLL file which provides functions for controlling the
amplifier and reading the status and signals. The documentation and program files for the API can be
The desktop software for the PDUS200 uses the API so the source code is a useful programming example.
This is included in the API package.
Table of contents
Other PiezoDrive Amplifier manuals

PiezoDrive
PiezoDrive PX200 User manual

PiezoDrive
PiezoDrive PD200X4-V0,200 User manual

PiezoDrive
PiezoDrive PD200 User manual

PiezoDrive
PiezoDrive PD32 User manual

PiezoDrive
PiezoDrive PD200 User manual

PiezoDrive
PiezoDrive PDUS210 User manual

PiezoDrive
PiezoDrive PX200 User manual

PiezoDrive
PiezoDrive TD250 User manual

PiezoDrive
PiezoDrive TD250 V8 User manual