16.1 Install the Digital Inclinometer App from the Google Play Store ...............51
16.2 Install the Digital Inclinometer App APK from Local Storage....................51
16.3 Connect the USB For File Transfer..........................................................52
16.4 Uninstall the Digital Inclinometer App.......................................................52
16.5 Delete Application Data...........................................................................52
16.6 Configure Display Options.......................................................................53
16.7 Configure Sound Options.........................................................................53
16.8 Configure Touch Panel Control................................................................53
LIST OF FIGURES
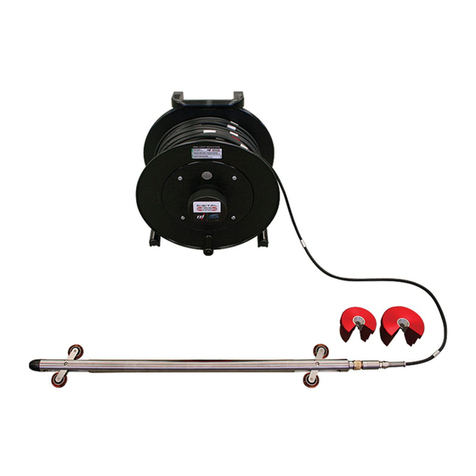
Figure 1: Parts and components...........................................................................................................6
Figure 2: RST Digital MEMS Inclinometer digital probe sizing vs. competitor inclinometer .................8
Figure 3: Probe orientation..................................................................................................................10
Figure 4: Sign convention in the A-axis and deviation measured by inclinometer probe ...................11
Figure 5: Probe axes...........................................................................................................................11
Figure 6: A+ marking on the inclinometer probe.................................................................................11
Figure 7: Reel battery port ..................................................................................................................13
Figure 8: Plugging charger into battery port........................................................................................13
Figure 9: Status icons .........................................................................................................................14
Figure 10: Expanded status ................................................................................................................14
Figure 11: Sample Devices screen showing reel is disconnected......................................................15
Figure 12: Information icon .................................................................................................................15
Figure 13: Reel information.................................................................................................................16
Figure 14: Probe information...............................................................................................................16
Figure 15: App screen organization....................................................................................................18
Figure 16: Workflow Hierarchy............................................................................................................20
Figure 17: Sample site list...................................................................................................................20
Figure 18: Sample borehole list ..........................................................................................................21
Figure 19: Sample Axis A+ bottom and top depth readings ...............................................................23
Figure 20: Sample Axis A- bottom and top depth readings ................................................................24
Figure 21: Sample Axis A+ and Axis A- readings...............................................................................27
Figure 22: Sample Absolute, Mean Deviation and Checksum plots...................................................28
Figure 23: Sample reading list and comparison graph .......................................................................29
Figure 24: New borehole for spiral probe screen sample ...................................................................33
Figure 25: Sample Data view screen for spiral probe.........................................................................36
Figure 26: Spiral Data Collection Method ...........................................................................................41
LIST OF TABLES
Table 1 Battery status LED .................................................................................................................12
Table 2 Diagnostic information for the reel and probe........................................................................14
Table 3: App icons and functions........................................................................................................19
Table 4: Standby Mode.......................................................................................................................49
Table 5: Initial charge LED indications................................................................................................49
Table 6: MED charge LED indications................................................................................................50
Table 7: HI charge LED indications.....................................................................................................50
Table 8: MAX charge LED indications ................................................................................................50
Table 9: Error in charging LED indications .........................................................................................50
