Solmetric PVA-600 User manual

Solmetric PV ANALYZER PV Analyser Quick Start Guide
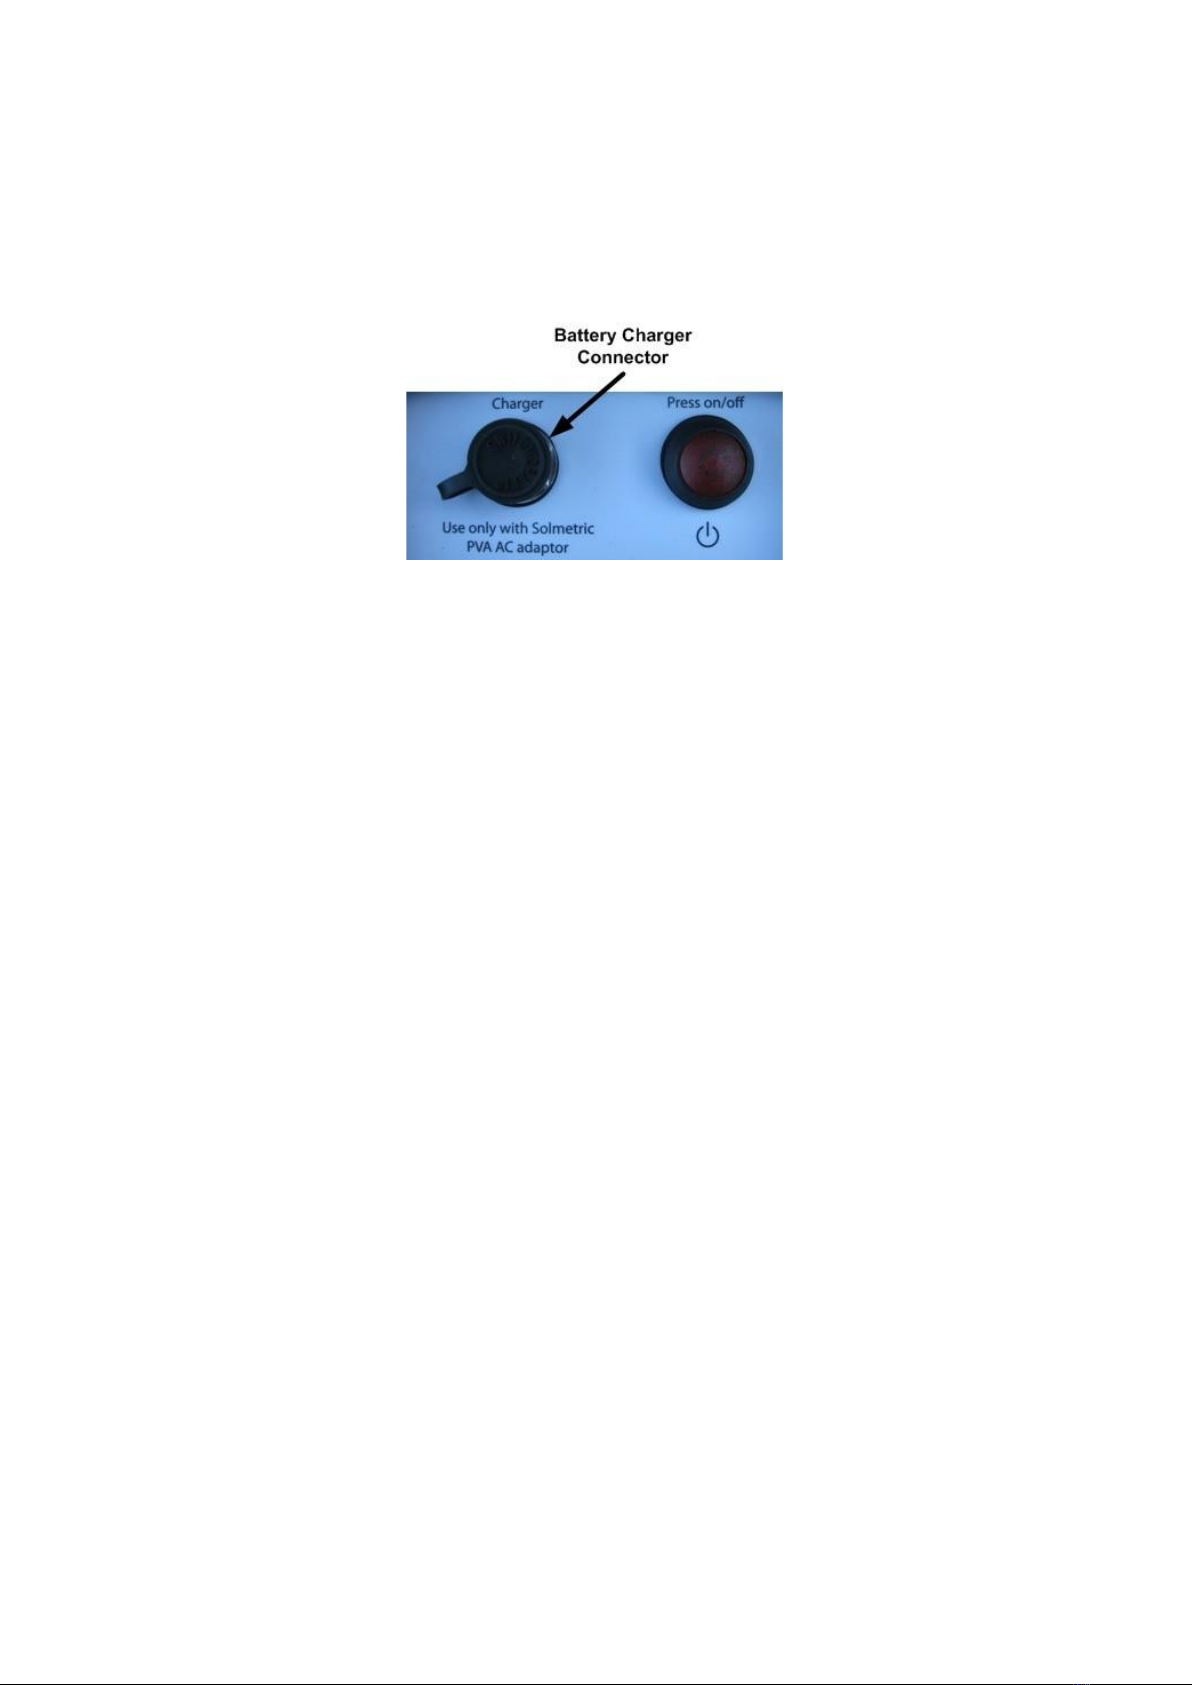
Charging the Battery
The battery in the PV ANALYZER is not removable. It may be recharged byattaching the battery
charger to the connector on the PV ANALYZER shownbelow and plugging the charger into an AC
wall-plug.
Charging the battery can take up to 6 hours. Once the battery has been charged, the PV ANALYZER will
operate for approximately 2 days of normaluse. During heavy use, nightly charging is suggested.
The PV ANALYZER Software interface will warn the user when approximatelyone hour of battery life
remains.
The software user interface displays the Disabled alert (below the MeasureNow button) when the
battery is nearing the end of its charge. In this state, no measurements can be taken.
Computer Minimum Requirements
•
Tested and Supported Operating System: Windows 7® (32 and 64bit versions), Windows Vista®
(32 bit versions only), Windows XP® SP3
•
Two USB Ports (or one USB port if wireless sensors will not beused)
•
Display Resolution: 1024 X 600 (minimum)
•
Processor Speed: >700 MHz
•
RAM: >500 Mbytes
•
Available Disc Space: 100 Mbytes or more
Systems that do not meet these requirements may not operate correctly

PV ANALYZER Operational States
The PV ANALYZER can be in any of the following operational states:
•
Power off –LED off (I-V Measurement Unit is turned off)
•
Network search –LED blinking (press the power button once toturn the Unit on and start it
searching for the PC)
•
Sweep enabled –LED on (I-V network exists and sweep isenabled)
•
Sweeping –LED blinks once at start of each sweep when the I-VMeasurement Unit receives a
sweep trigger from the PC.
•
Sweep disabled –LED off (press the power button once to disablethe I-V sweep)
•
Reset –LED blinking (press and hold the power button for morethan 5 seconds to force a power-
up type reset)
Specifications
•
Current Measurement Range: 0 to 20/30 A dc
•
Voltage Measurement Range: 0 to 1000/1500 V dc
•
Operating Temperature: +0ºC to +50º C
•
Storage Temperature: -20ºC to +60º C
•
Operating Humidity: 10 to 80%

Precautions
PV Connectors
Always keep Connector-Saver jumpers attached to the primary test leads toextend the life of the primary PV
connectors. To prevent damage to matingconnectors, replace the Connector-Saver jumpers when they have
been connected 100 times. Cut off the used-up connectors to prevent re-use.
PV/Electrical Safety Precautions
PV systems differ widely in design and construction. Therefore theguidance provided in this section
is general in nature.
WARNING The operator must assess the potential dangers of eachPV system, and take appropriate
precautions.
FAILURE TO TAKE APPROPRIATE SAFETY PRECAUTIONS COULD LEAD
TO PERSONALINJURY OR LOSS OF LIFE.
WARNING Do not remove instrument covers. There are no user serviceable parts within.
Operation of the instrument in amanner not specified by Solmetric may result in personalinjury or loss
of life.
•
Do not use the PV ANALYZER in wet environments.
•
Wear electrical safety gloves and eye protection.
•
Assume that metal surfaces are energized unless provenotherwise.
•
Isolate the PV source circuit to be tested from the inverter andfrom other PV source circuits
before making any electrical connections to the test device (PV module or string).
•
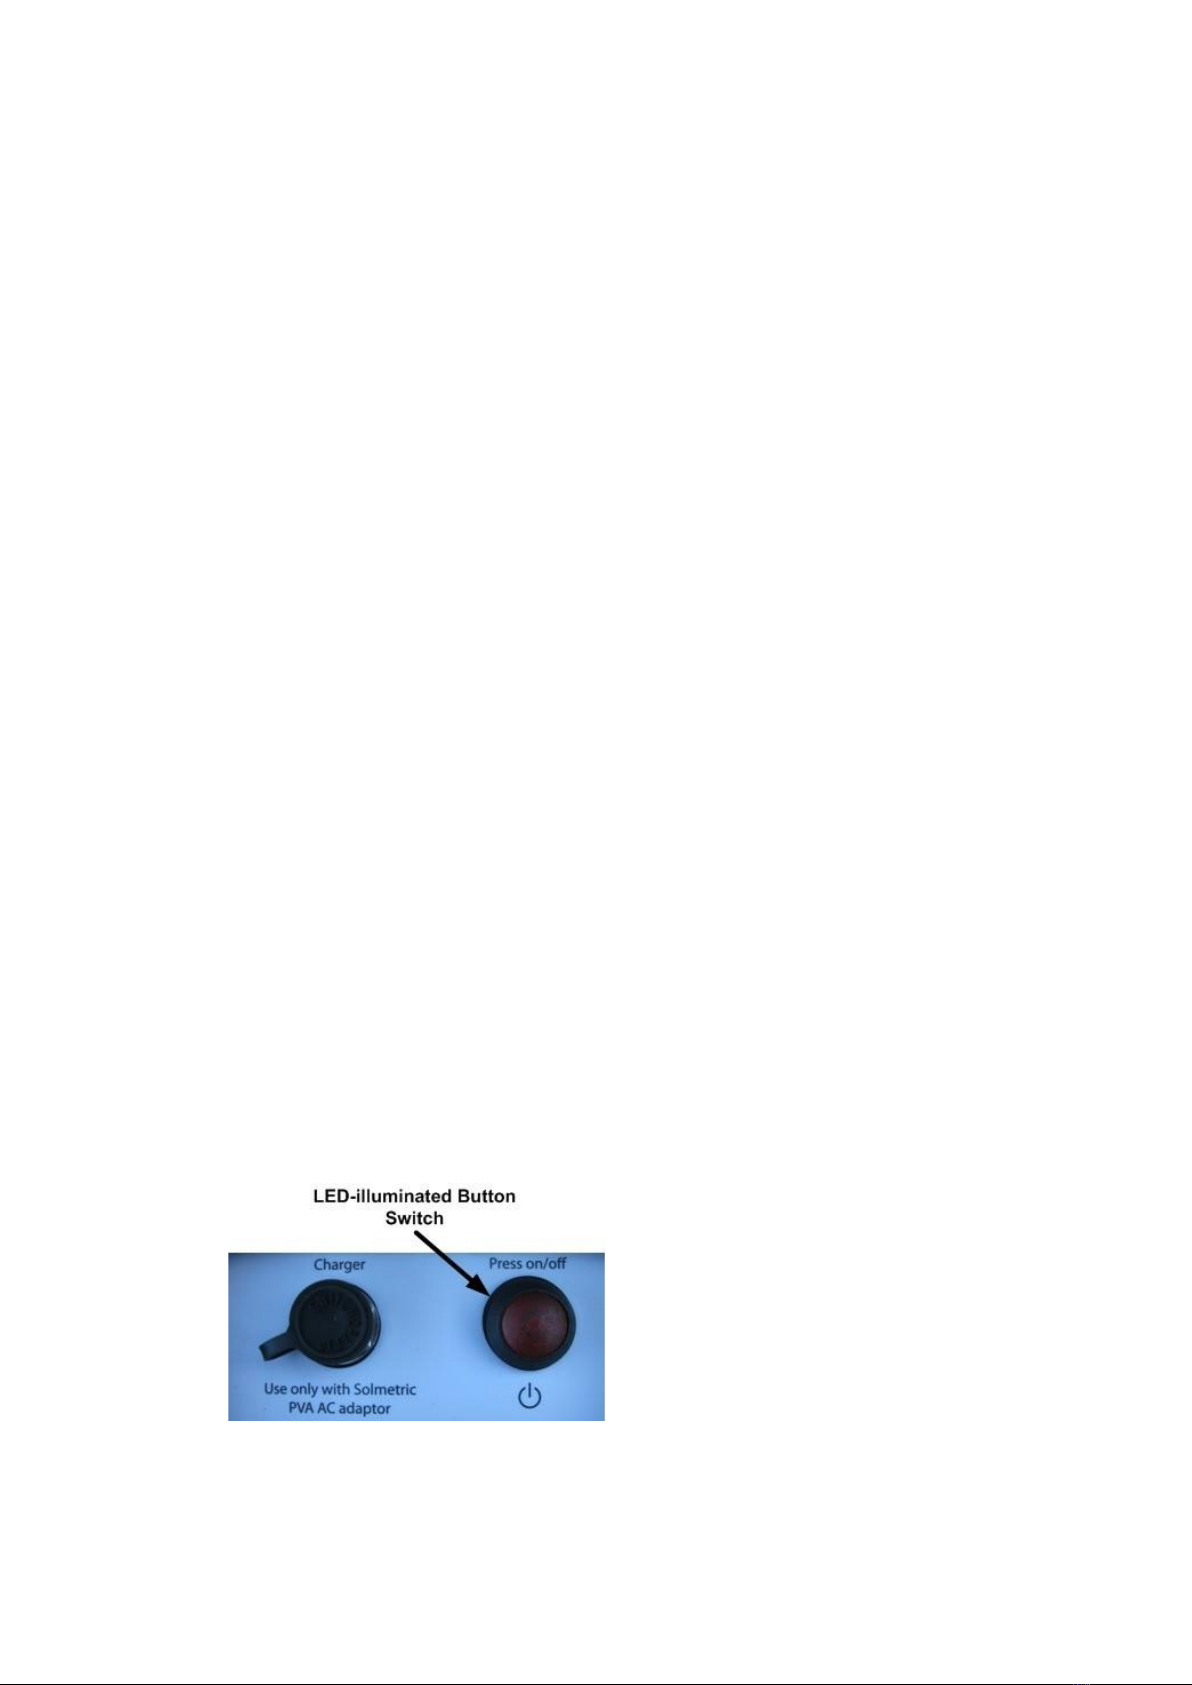
Always disable the measurement sequence using the LED- illuminated pushbutton switch on the I-
V unit before connectingor disconnecting the test leads of the PV ANALYZER.
•
Connect the test leads to the test device (PV module, string, orarray) with the correct polarity.
•
Do not use the PV ANALYZER to test devices that produce more thanthe instrument’s specified
maximum current and voltage.
•
Do not operate at or subject the PV ANALYZER to temperatures beyondthe published operating
and storage temperature specifications.
•
Inspect cables and connectors for damage before using. Do notuse if damaged.
•
Do not use the I-V Measurement Unit if it is damaged. Alwaysinspect for damage before using.
•
Do not use the I-V Measurement Unit if it is performing abnormally. Contact Solmetric for
guidance or return the I-VMeasurement Unit to the factory for service.

Overview
Proper operation of the Solmetric PV ANALYZER includes the following steps:
1.
Installing the Software
2.
Setting up the PV ANALYZER
3.
Setting up a Performance Model
4.
Connecting to the PV Equipment
5.
Powering up the I-V Measurement Unit
6.
Making I-V Measurements
7.
Viewing and Analyzing the Data

1. Installing the Software
1.
Start the installer by inserting the pendrive provided/ downloading the setup file, the installation
file is available at www.solmetric.com.
2.
Follow the instructions in the welcome screen to install the PV ANALYZER software. The
drivers for the wireless USB adapter will also be installed. The directory structure shown
here is created.
3.
When the installation process is finished, start the PV ANALYZER software by double-clicking
on the shortcut icon on your desktopas shown below.
Or, in the Start menu, select Programs>Solmetric>PV Analyzer>Solmetric PV Analyzer
2. Setting Up the PV ANALYZER
1.
Place the I-V Measurement Unit close to the PV device to bemeasured.
CAUTION In hot weather, place the PV ANALYZER in the shade to reducethe likelihood of thermal
shutdown. Don’t place the PV ANALYZER on hot asphalt or the roof in direct sun.
NOTE The PV ANALYZER will automatically shut down if its internaltemperature reaches a
preset limit. Internal temperature isincreased by PV energy collected during I-V sweeps,
andalso by heat absorbed from the environment, including high ambient air temperature,
hot surfaces on which the PV ANALYZER is placed, and exposure to direct sunlight.
2.
Ensure that the Connector-Saver jumpers are installed on theprimary test leads.
3.
If using alligator clip leads or extension cables, connect them to the connector-saver jumpers. Be
sure these leads are rated for themaximum current and voltage of the I-V Measurement Unit.
4.
If long extension cables are used, lay the cables alongside one another to minimize the
inductance they add to the measurementcircuit path.
5.
Connect the Wireless USB Adapter to a USB port in yourcomputer.
6.
If you will be using the PV ANALYZER Sensor Kit, refer to the followingsection for
setup information.

3. Setting Up a Performance Model
The following procedure shows how to set up a performance model in thePV Analyzer software to compare
with the I-V measurements.
1.
In the PV ANALYZER Software, drop down the Model menu and select
Properties…
2.
In the Name tab, enter a model name.
3.
In the Location tab, enter Latitude, Longitude and Time Zone.
4.
In the Modules / String tab, enter string information. Select theDetailed or Simple performance
model.
a.
If you chose the Detailed Performance Model, click onChange... and select the PV
module manufacturer andmodel number from the drop down lists.
b.
If you will be entering performance model parameters fromthe manufacturer’s published
specifications, select SimplePerformance Model and edit the default values to matchyour
module’s datasheet.
NOTE Enter temperature coefficients in units of % / C. If the manufacturer supplies coefficients
for Voc (STC) in unitsof V / C, this value can be converted to % / C by dividingthe
supplied number by Voc and multiplying by 100.
c.
Enter the number of modules in each string and the numberof strings in parallel that are being
tested.
2.
In the Inverter tab, select your inverter (optional step).
3.
In the Wiring tab, enter the wire gauge and the wire length
•
Wire Length is the one-way length of the PV output conductors from the ends of the
module/string under test to the point where the PV ANALYZER is connected. (For two 50
footleads running between the I-V unit and the string, enter “50”not “100”.)
4.
In the Sensor Methods tab, select irradiance and temperature sensor methods. See the PV
ANALYZER User’s Guide for more details.
a.
If you choose the wireless irradiance sensor, in the CalFactor box, enter the cal factor
from the sensor label.
b.
If you choose to enter the irradiance manually, enter theirradiance in the Irradiance
(POA) text box.
c.
If you choose to use a wireless temperature sensor, enter a temperature Offset number
that represents the rise in PV celltemperature compared with the measured temperature.
5.
In the Inverter tab, select your inverter (optional step).

6.
In the Wiring tab, enter the wire gauge and the wire length
•
Wire Length is the one-way length of the PV output conductors from the ends of the
module/string under test to the point where the PV ANALYZER is connected. (For two 50
footleads running between the I-V unit and the string, enter “50”not “100”.)
7.
In the Sensor Methods tab, select irradiance and temperature sensor methods. See the PV
ANALYZER User’s Guide for more details.
a.
If you choose the wireless irradiance sensor, in the CalFactor box, enter the cal factor
from the sensor label.
b.
If you choose to enter the irradiance manually, enter theirradiance in the Irradiance
(POA) text box.
8.
If you choose to use a wireless temperature sensor, enter a temperature Offset number that
represents the rise in PV celltemperature compared with the measured temperature
9.
In the Array Plane tab, enter the slope and azimuth of the PV modules under test. Always perform
this step if you are using the Sandia Performance Model and a wireless or manual irradiance
sensor.
4. Connecting to the PV Equipment
WARNING PV systems differ widely in design and construction. Therefore the procedure
described below is general in nature. The operator must assess the potential dangers of each
particular PV system, and take appropriate safety precautions. FAILURE TO TAKE
APPROPRIATE SAFETY PRECAUTIONS COULD LEAD TO PERSONAL INJURY OR LOSS
OF LIFE.
1. Isolate the PV module string to be tested (test string) from the inverter and from other strings in the
array. If the measurement is being made at a fused DC combiner box, isolate the combiner box by
means of the DC disconnect switch, then isolate the PV strings from one another by pulling their
fuses.
2. Press the button on the I-V Measurement Unit to disable the I-V sweep.
WARNING PV circuits continue to present danger of electrical shock when fuses are pulled and
the PV ANALYZER system is paused.
3. Following safe operating procedures, connect the PV ANALYZER to the test string. The
connection may be made at PV connectors at the ends of the test string, or by clipping to the de-
energized buss bars in a DC combiner box, using suitable test leads with MC-4 connectors at one
end and insulated alligator clips at the other end.
4. If one or both of the terminals of the test device must be some distance from the I-V Measurement
Unit, use extension cables made of UL (or equivalent) listed PV wire, with correctly installed
connectors. Select a wire gauge that will introduce minimal voltage drop.
5. When extension cables are longer than 10 feet (one-way), lay the cables close to one another to
minimize added cable inductance.
6. If connecting at a fused combiner box, insert one fuse to select the string to be measured.
7. Powering-Up the I-V MeasurementUnit
Press the power button once on the I-V Measurement Unit.
The LED will begin to blink indicating that the I-V Measurement Unit isattempting to

establish communication with the wireless USB adapter connected to the PC. If the
wireless USB adapter is inserted into an operating PC, a network will be established and
the LED will become continuously lit (no blinking). If a network is not established within
15 minutes, the I-V Measurement Unit will turn off to conserve the battery.
7.Making I-V Measurements
Ensure that the PC is running the Solmetric PV Analyzer software, that the wireless USB adapter is
connected to the PC, that the PV ANALYZER is properly connected to the PV equipment, and that
the I-V Measurement Unit is wirelessly connected to the PC (the “Measure Now” button will be
colored green).
NOTE If the Wireless USB Adapter used for PV ANALYZER or wireless sensor communication is
installed before starting the software, the USB port will be found automatically. If you install the
Wireless USB Adapter(s) after starting the software, you must select the proper USB ports on your
PC manually using the Utility/Settings menu.
1. Click on the Measure Now button to start a measurement.
•The Ready button will change to Measuring and blink during the measurement. The red
pushbutton on the I-V Measurement Unit will blink once.
•The I-V Measurement Unit measures a single I-V curve each time the user clicks on the Measure
Now button. I-V data is transmitted to the PC shortly after each I-V sweep is taken.
2. Save the trace by pressing “Save Trace…” in the Traces tab. Saved trace data can be viewed by a
program that can read a csv file, such as Excel®. See the User’s Guide for further instructions.
3. Pause the measurement sequence of the PV ANALYZER by pressing the power button.
WARNING Do not disconnect from the tested string unless the red power button is turned off.
4. Disconnect from the tested string and connect to the next string to be measured.
5.
Repeat the process until all strings have been measured.
WARNING PV circuits continue to present danger of electrical shockwhile system is paused.
FAILURE TO TAKE APPROPRIATE SAFETY PRECAUTIONS COULD LEAD TO
PERSONAL INJURY OR LOSS OF LIFE.
6.
If you are using the PV ANALYZER Sensor Kit, perform the following:
a.
Insert the Wireless Sensor USB Adapter into a second USBport.
b.
Ensure that the PV ANALYZER Sensor Kit is set up correctly.
c.
Turn on the sensor transmitters by pressing the I/0 buttononce.
NOTE Always turn on the wireless transmitters AFTER startingthe PV ANALYZER application.
NOTE If communications are not established within one minute:
1.
Move the PC closer to the I-V Measurement Unit.
2.
Reset the I-V Measurement Unit.
3.
Remove and replace the Wireless USB Adapter.
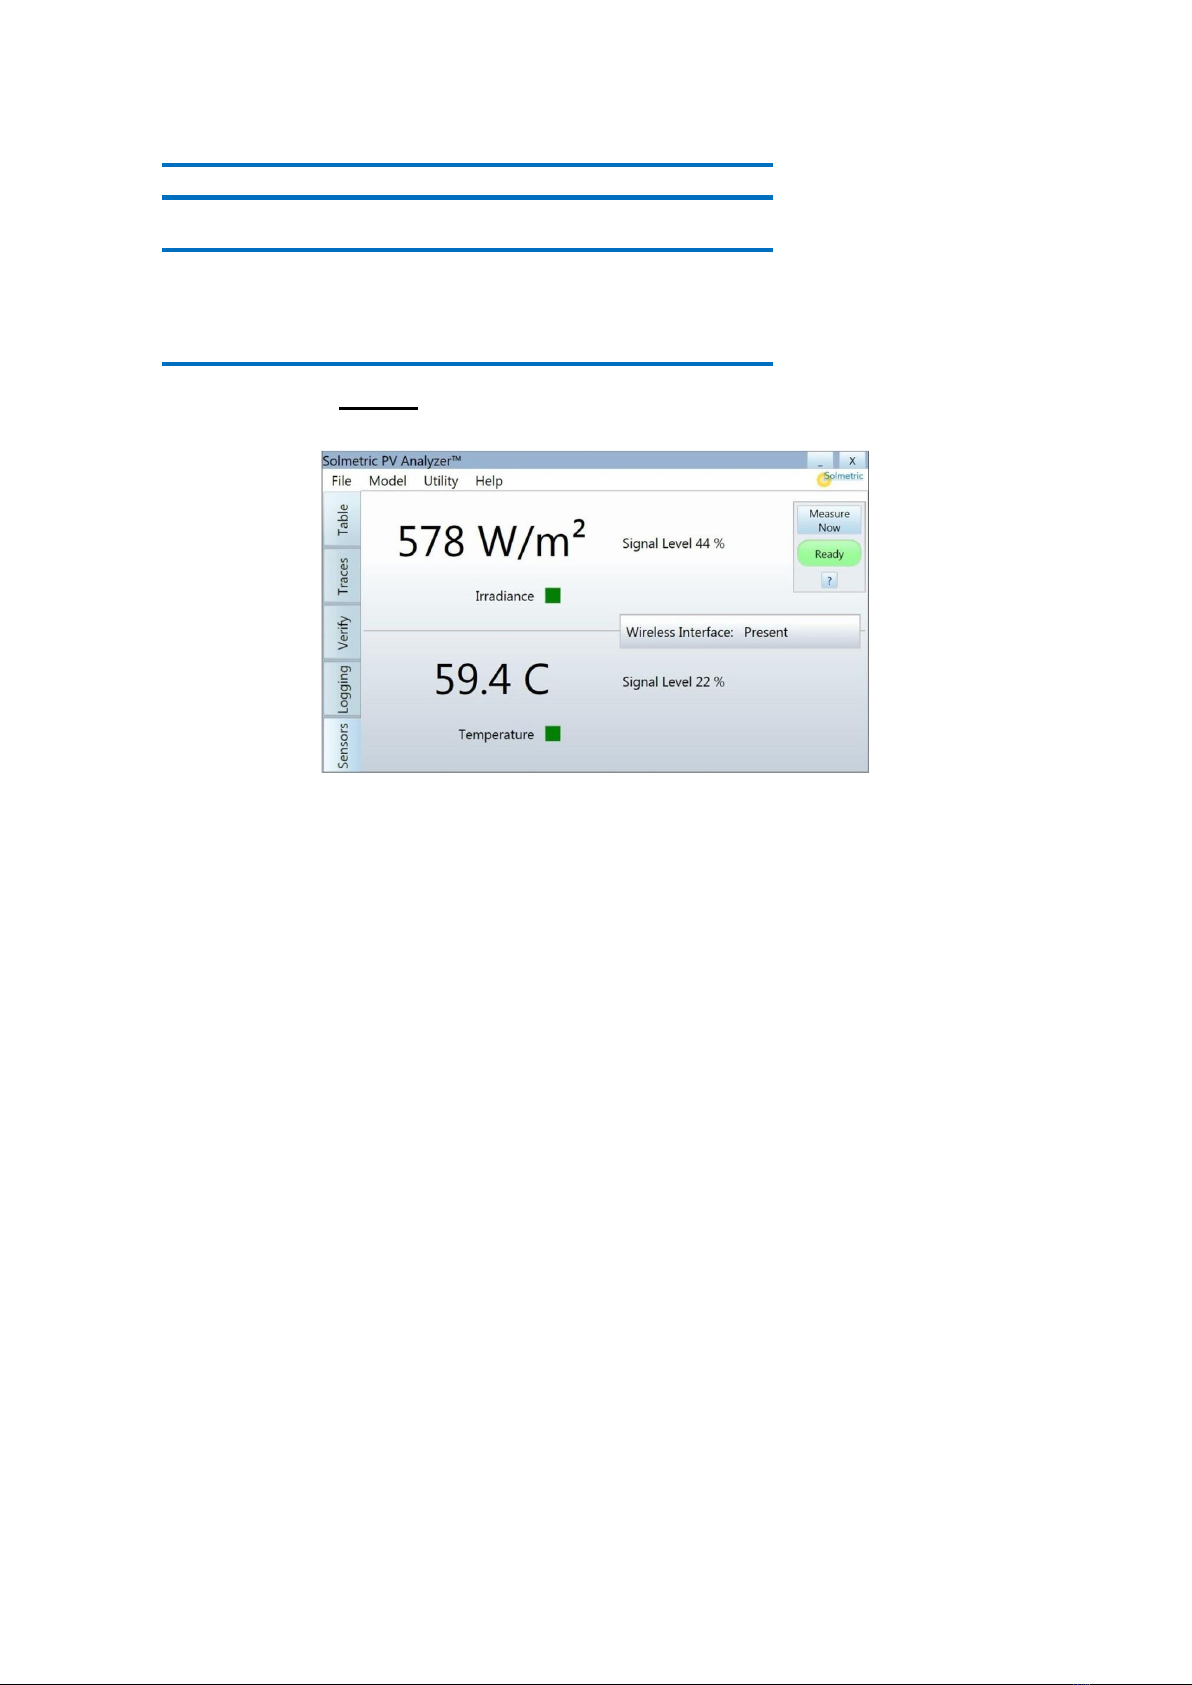
Click on the Sensors tab to access the screen shown in thefollowing screen.
a.
Ensure that the Irradiance box blinks green every two seconds. If the box is not blinking,
you may need to shortenthe distance between transmitter and PC or clear the line-of-sight to
the transmitter.
b.
Ensure that the Temperature box blinks green every ten seconds. If the box is not
blinking, you may need to shortenthe distance between transmitter and PC or clear the line-
of-sight to the transmitter.
c.
If the Wireless Interface: Not Found message appears,select Settings from the Utility
menu and set up the wireless sensor USB interface manually. Select the communications
port with the “+” sign.
8. Click on the Measure Now button to start a measurement. TheReady button will
change to Measuring and blink during the measurement. The red pushbutton on the I-V
Measurement Unitwill blink once.
8. Viewing and Analyzing the Data
Once an I-V measurement has been taken, the data is presented in severalforms.
Table
Click the Table tab to observe Predicted and Measured parametervalues.
Press the Snapshot button to temporarily store measured values for comparison with
subsequent measurements. Temperature and irradiancevalues appear in the Predicted
column if they are being derived from themeasured I-V curve
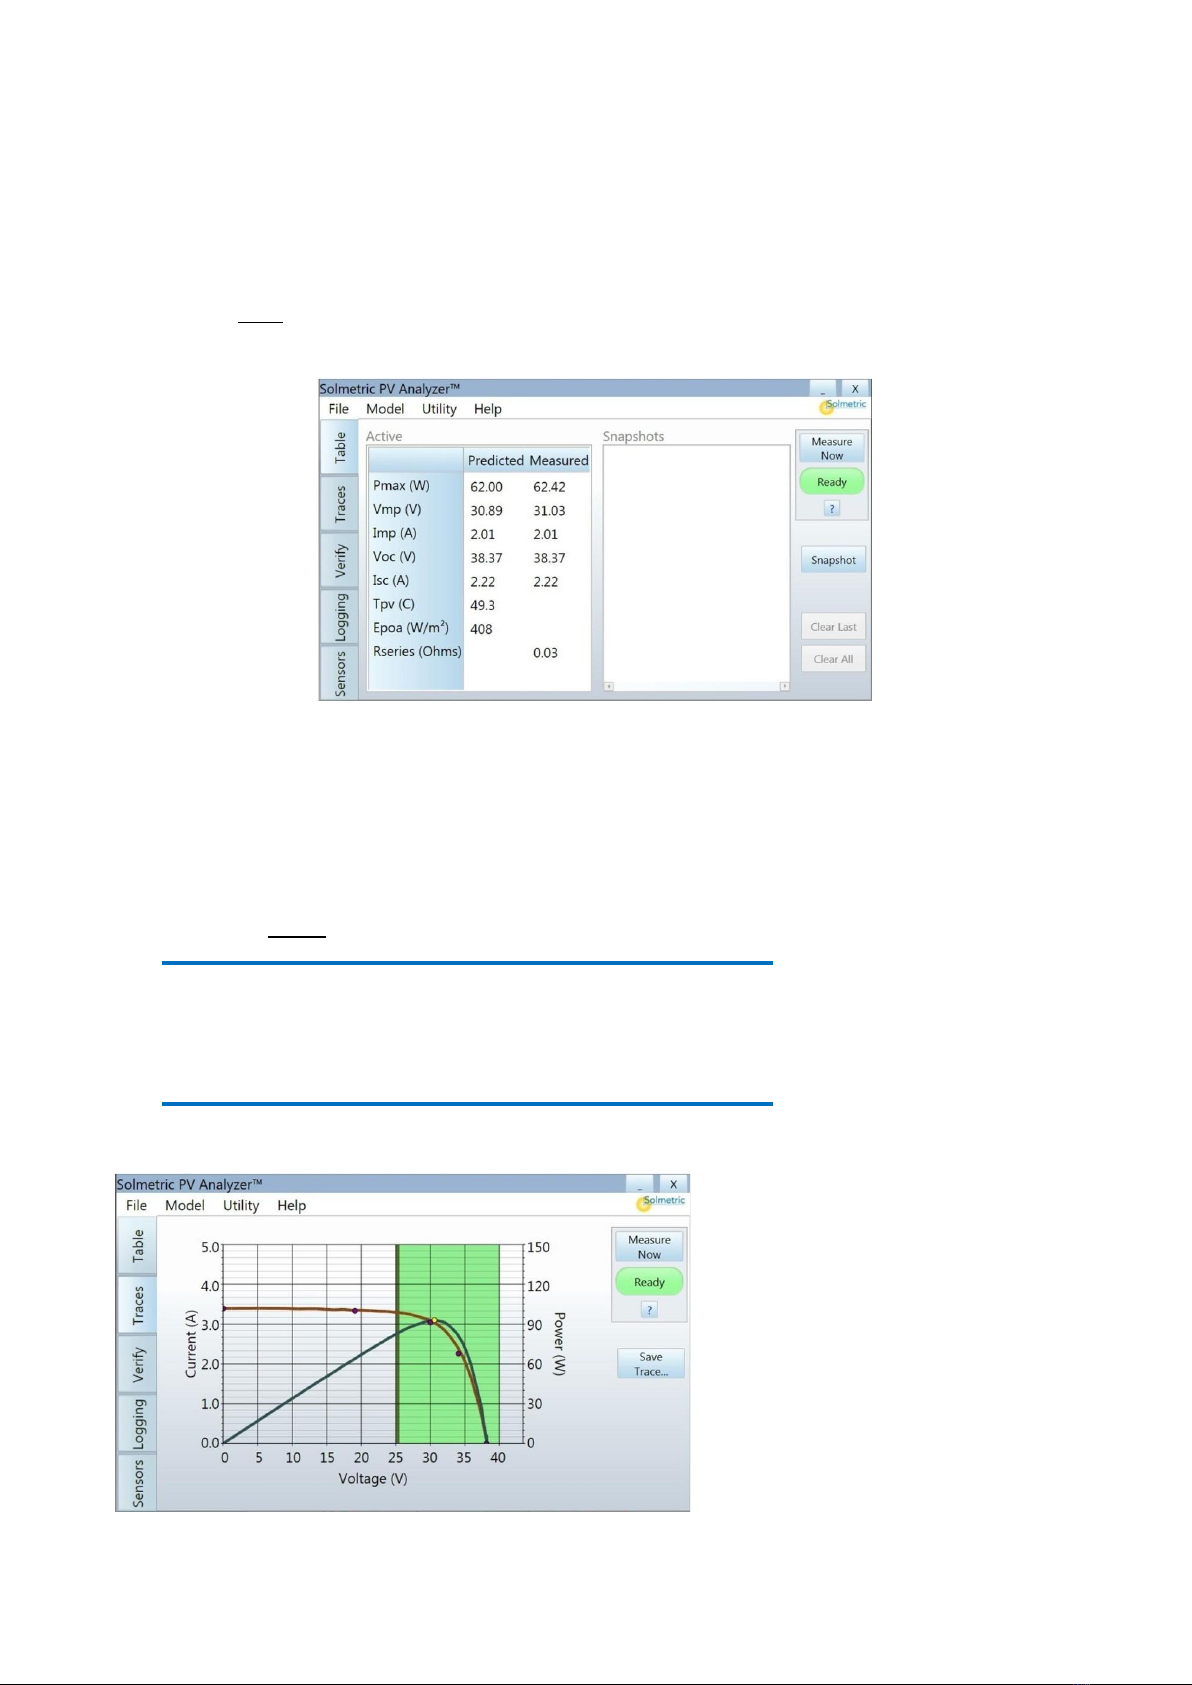
Traces
Click on the Traces tab to view the I-V and P-V graphs as shown in thefollowing screen.
NOTE The first time a measurement is made, the trace may appear rough because the PV
ANALYZER uses special internalsettings to check the voltage and current of the circuit
under test before choosing the most appropriate internalsettings for the second and
subsequent sweeps. In the second measurement, the data will scale properly and should be
similar to the graph shown in the following screen.
NOTE If the Sandia Model is selected and the array itself is being used as the
sensor, the end points of the measured I-V trace typically will match the predicted model
pointsfor Isc and Voc. If the 5 Parameter Model is selected andthe array itself is being
used as the sensor, the end pointsmay not match the predicted points
To save the data to a csv file, click on the Save Trace… button then entera filename in the Save As
dialog box. The trace data file will be saved in the Traces folder. To save time in the field, create in
advance a Windows® directory tree tree with the same architecture as the PV system under test.
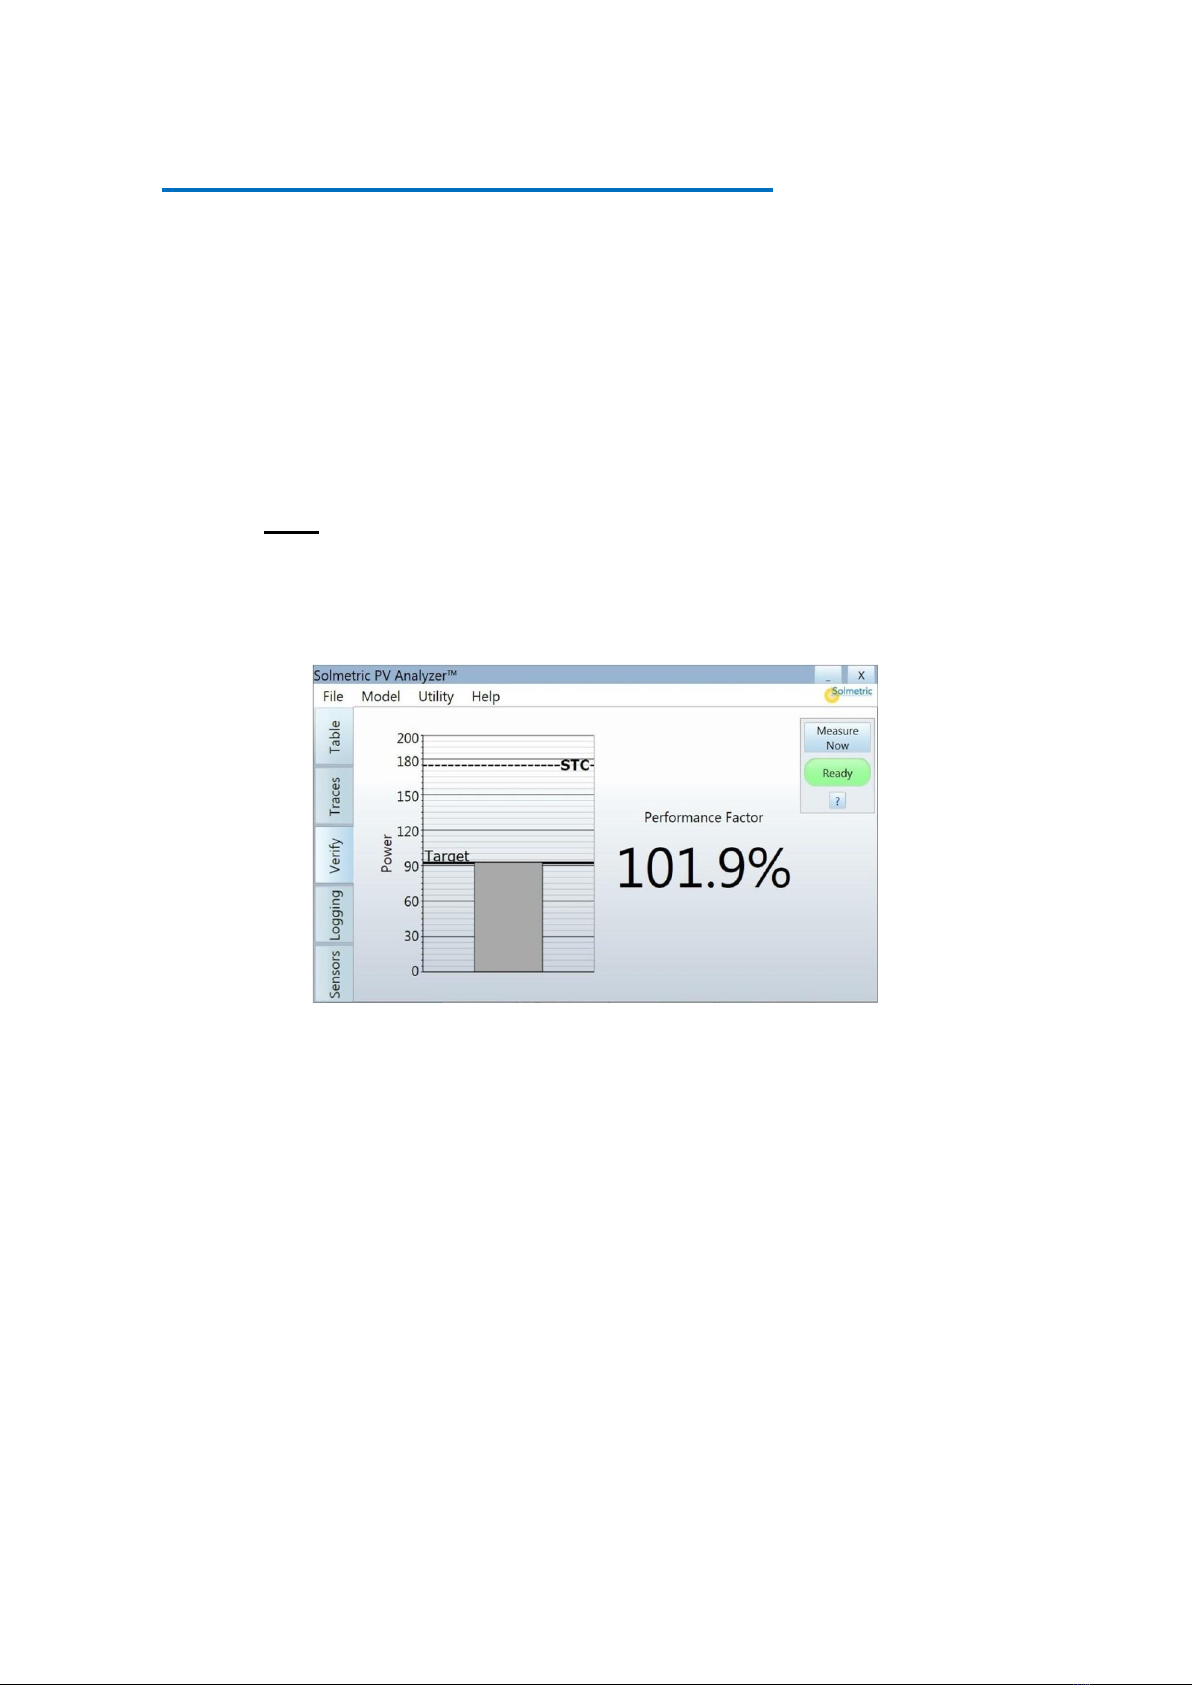
Verify
Click on the Verify tab to view the numeric Performance Factor valueas shown in the following
screen. The Performance Factor is the ratio of actual to predicted maximum power, expressed in
percent.
More information about the analysis of the data is available in the
PV ANALYZER User’s Guide, which is accessible from the DVD, via the Helpmenu in
the PV ANALYZER Software interface, and on the Solmetric website


Other manuals for PVA-600
1
Table of contents
Other Solmetric Measuring Instrument manuals

Solmetric
Solmetric PVA-1500S User manual

Solmetric
Solmetric PVA-1500T User manual

Solmetric
Solmetric PVA-1500V2 User manual

Solmetric
Solmetric PV ANALYZER PVA-1500 Series User manual

Solmetric
Solmetric PVA-1000S User manual

Solmetric
Solmetric PVA-1500V2 Reference guide

Solmetric
Solmetric SunEye 210 User manual

Solmetric
Solmetric PVA-600 User manual
Popular Measuring Instrument manuals by other brands

Precision Digital Corporation
Precision Digital Corporation PD2-6300-7H7 instruction manual

Xylem
Xylem WTW Multi 3320 quick start guide

Gandy
Gandy Gandy Orbit-Air 66 Series Operator's manual

Secomam
Secomam Basic user manual

ELNet
ELNet GR/PQ Installation & operation manual

Garnet
Garnet SEELEVEL II 714 manual


