Sonic Meter Sonic AO User manual

Sonic Meter ®
Sonic AO
Operating Manual

Important: Do not attempt to operate this instrument without completely reading
this manual and understanding the correct operating procedures.
For online technical support and further information refer to our web site at
www.sonicmeter.com
Rev A-0915

Table of Contents
1. Safety
1.1 Batteries
1.2 Charger
1.3 Meter
1.4 Probe
1.5 Electromagnetic Compatibility
2. Introduction
3. Description
3.1 Sonic Meter
3.2 Keypad
3.3 LCD display
3.4 1 meter cable
3.5 Sonic Meter probe
3.6 Battery Charger
3.7 Batteries
4. Operation
4.1 Changing the batteries
4.2 Resetting the circuit breaker
4.3 Powering up the meter
4.4 Options
4.5 Battery capacity
4.6 Real time reading
4.7 Averaged reading
4.8 Setup
4.9 Powering off the meter
4.10 How to take measurements
5. Appendices
A. Specifications
B. Troubleshooting
C. Parts List
D. Warranty
E. Calibration sheet

1. Safety Issues:
1.1 Batteries:
The Sonic Meter
Sonic AO
is powered by 4 AAA Nickel Metal Hydride
(NiMH) batteries rated at 1000mAh. The meter is fault protected against reverse
polarity via a resettable circuit breaker. The meter ships with 8 AAA batteries.
The 4 AAA batteries in the meter were charged at the time of shipping. The other
4 AAA batteries are not charged.
CAUTION: Shorting the batteries (positive terminal connected to negative
terminal) is extremely dangerous and could cause serious injury. Extreme
caution should be used when handling and charging the batteries.
Do not store meter for long periods with the batteries installed. When disposing
of batteries follow all state and local laws.
1.2 Charger:
The battery charger is powered by 120/240Volts AC at 50/60Hz. Use of charger
with any other voltage input will damage the charger and could cause serious
injury.
1.3 Meter:
The Sonic Meter’s housing is not waterproof. If the meter becomes immersed in
water do not attempt to use it. Do not attempt to repair it. Return the meter to
SyncroCraft® for authorized repair.
1.4 Probe:
The probe attaches to one end of the 1 meter co-axial BNC cable. The other end
of the BNC cable connects to the meter. Never attempt to remove or install the
probe or cable while the meter is powered. Attempting this could cause
voltage surges, possibly damaging the probe or meter.
1.5 Electromagnetic Compatibility:
The Sonic Meter
Sonic AO
complies with EN 61326-1:1997. The meter is CE
approved.
Important: The Sonic Meter
Sonic AO
is not designed for use as a medical
device.
Important: Never operate the Sonic Meter
Sonic AO
and probe in areas where
high voltage potentials are not properly contained.

NOTE: Please read and understand the entire manual before operating the Sonic
Meter
Sonic AO
.
2. Introduction:
The Sonic Meter
Sonic AO
is a pressure sensitive measuring device. It is
designed to help maintain the quality and integrity of parts during cleaning cycles
in ultrasonic cleaners.
Ultrasonic cleaners utilize a transducer attached to the tank’s exterior. The
transducer outputs pulsating mechanical energy at high frequencies (ultrasonic),
which cause the liquid in the tank to agitate.
The agitation at this high frequency level is what gives ultrasonic cleaners their
cleaning ability. As the liquid becomes agitated, a phenomenon known as
cavitation takes place. Cavitation is the almost instantaneous formation and
implosion of small bubbles and cavities in the cleaning liquid.
As the liquid cavitates, the minute bubbles and the coincidental implosions cause
the surrounding liquid to impinge forcefully upon the surface areas of the part
being cleaned. The force that the liquid applies to the area of the part is
commonly referred to as the scrub-force.
This scrub-force action takes place throughout the tank. However, the scrub-force
can vary significantly due to the placement of the tank’s transducer and the
constructive and destructive interference caused by the shape of the tank and parts
being cleaned.
These process variations in scrub-force throughout the tank can be referred to as
hot spots or cold spots in the liquid. Hot and cold spots are locations of high and
low intensity scrub-force relative to a mean value scrub-force. These process
variations can significantly alter the cleanliness or integrity of the parts being
cleaned. Some parts may not have been thoroughly cleaned for the next process,
or the stresses due to the cleaning action may have altered the integrity of the
parts. With the Sonic Meter these process variation situations can be minimized.
With the Sonic Meter’s slender probe, operators can probe ultrasonic cleaners to
pinpoint areas of optimum intensity in which to place each part. The Sonic
Meter’s LCD displays the intensity variations. Parts can be varied in their z-
height or their x and y positions via an adjustable array fixture. The operator can
determine the location for each part so that all parts are placed in regions of the
same specified pressure reading (scrub-force). Or several readings can be taken
and averaged to determine the mean value pressure of a particular cleaner.
The Sonic Meter
Sonic AO
measures in units of pounds per square inch (psi).
The
Sonic AO
works with tanks that use frequencies up to 500kHz.
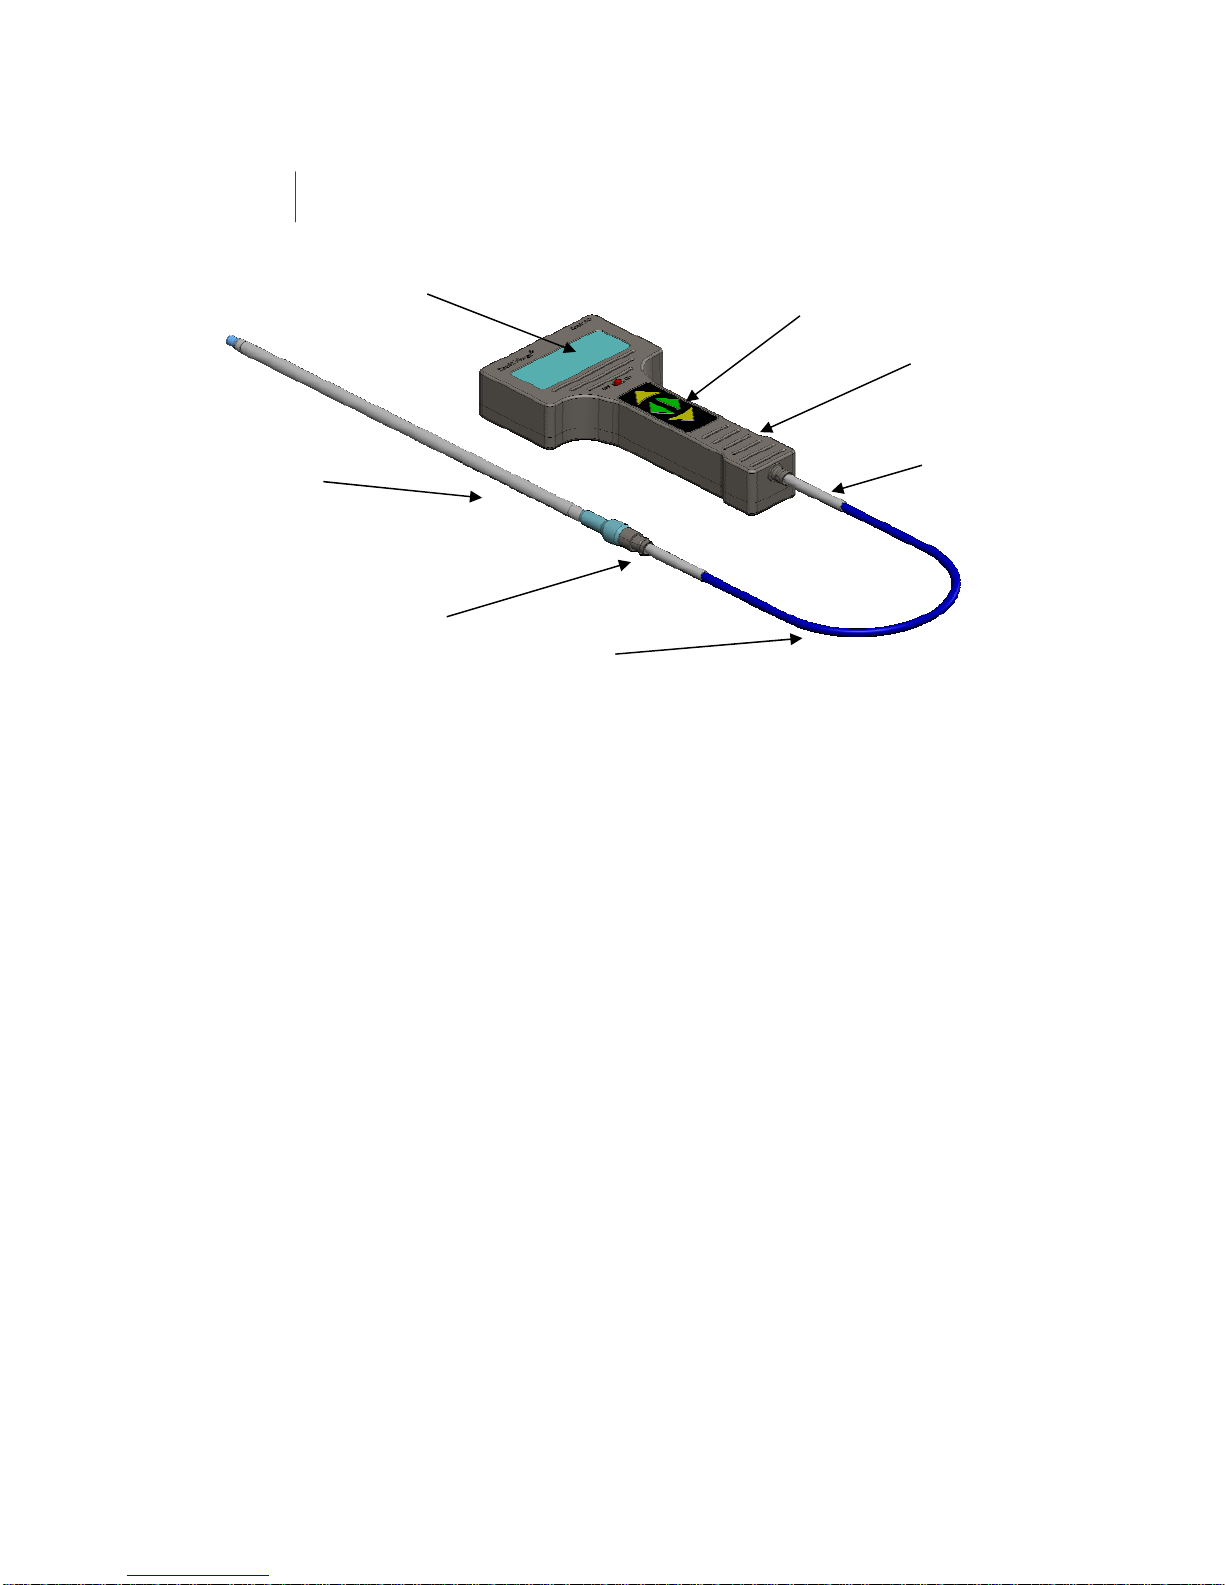
3. Description:
Figure 1
Figure 1 shows the main components of the Sonic Meter
Sonic AO
.
3.1 Sonic Meter:
The Sonic Meter
Sonic AO
is packaged in an ergonomic T-shaped housing. The
housing is made of aluminum with a durable anodized surface. The housing is
not waterproof.
LCD Display
Sonic AO
Keypad
Sonic AO Probe BNC connector
1 meter Cable
BNC connector
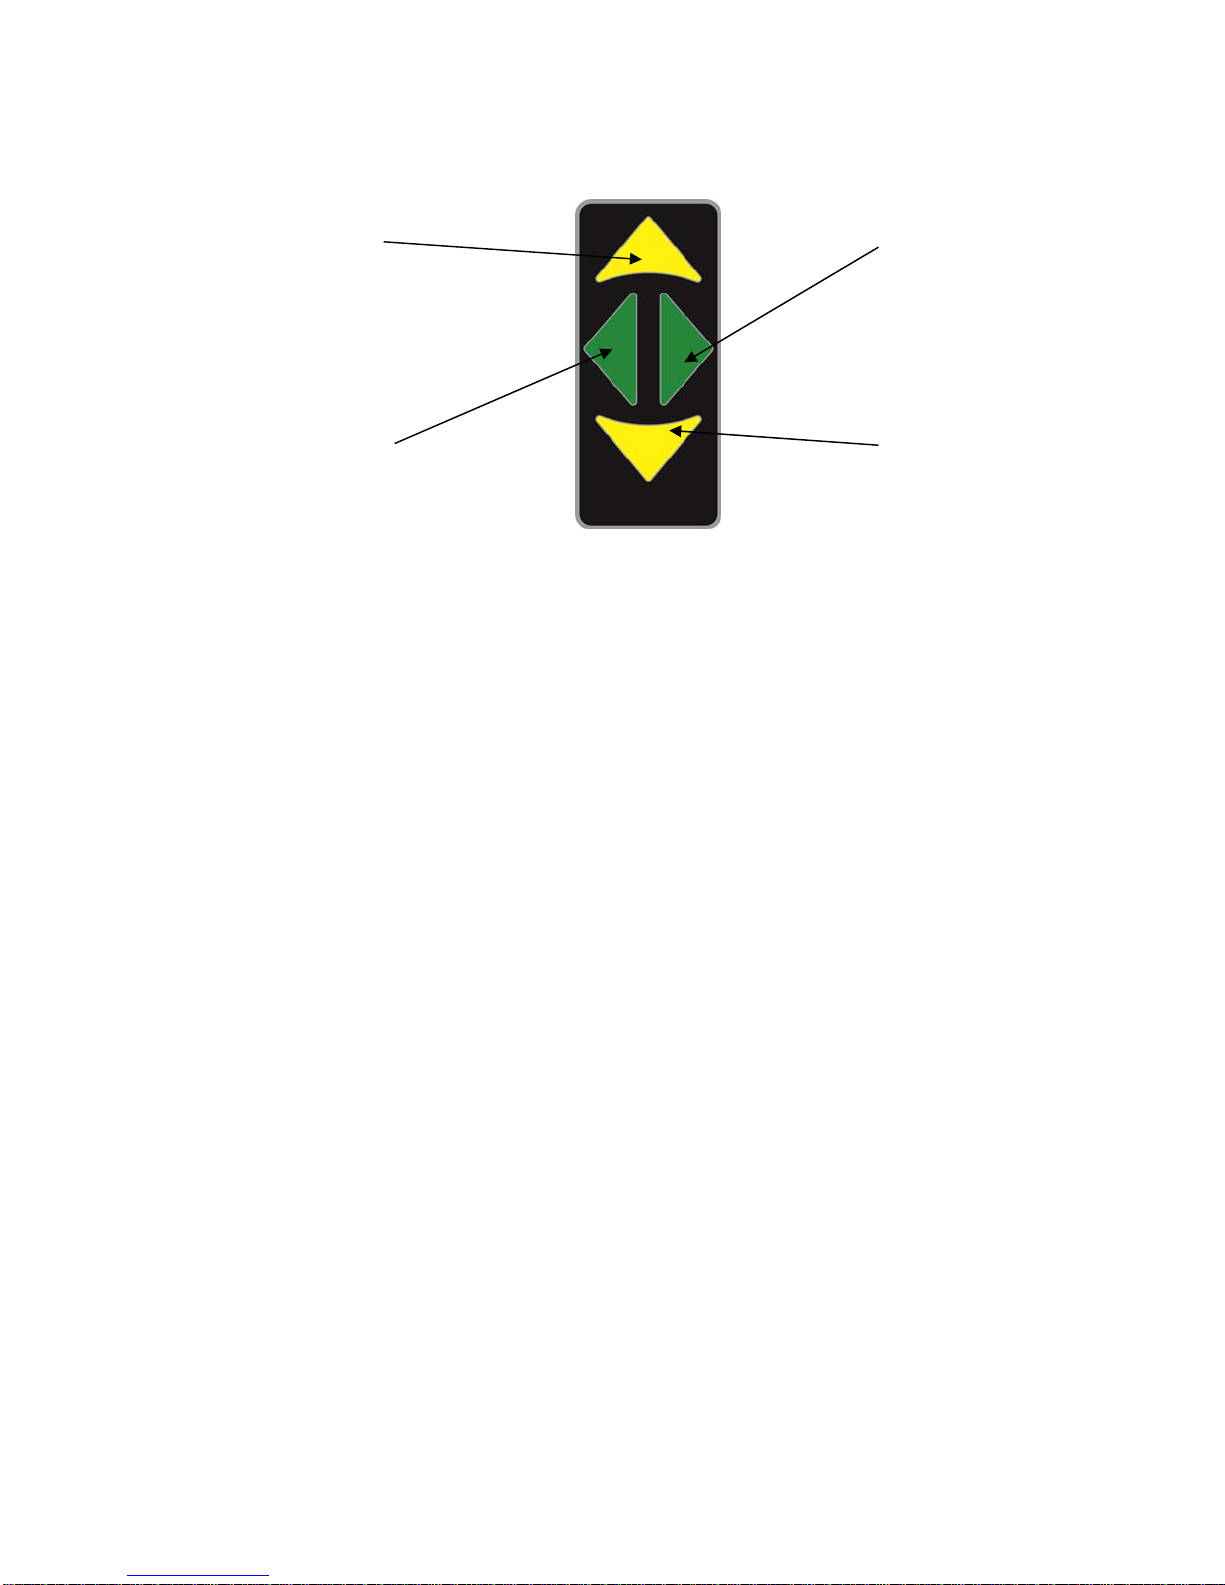
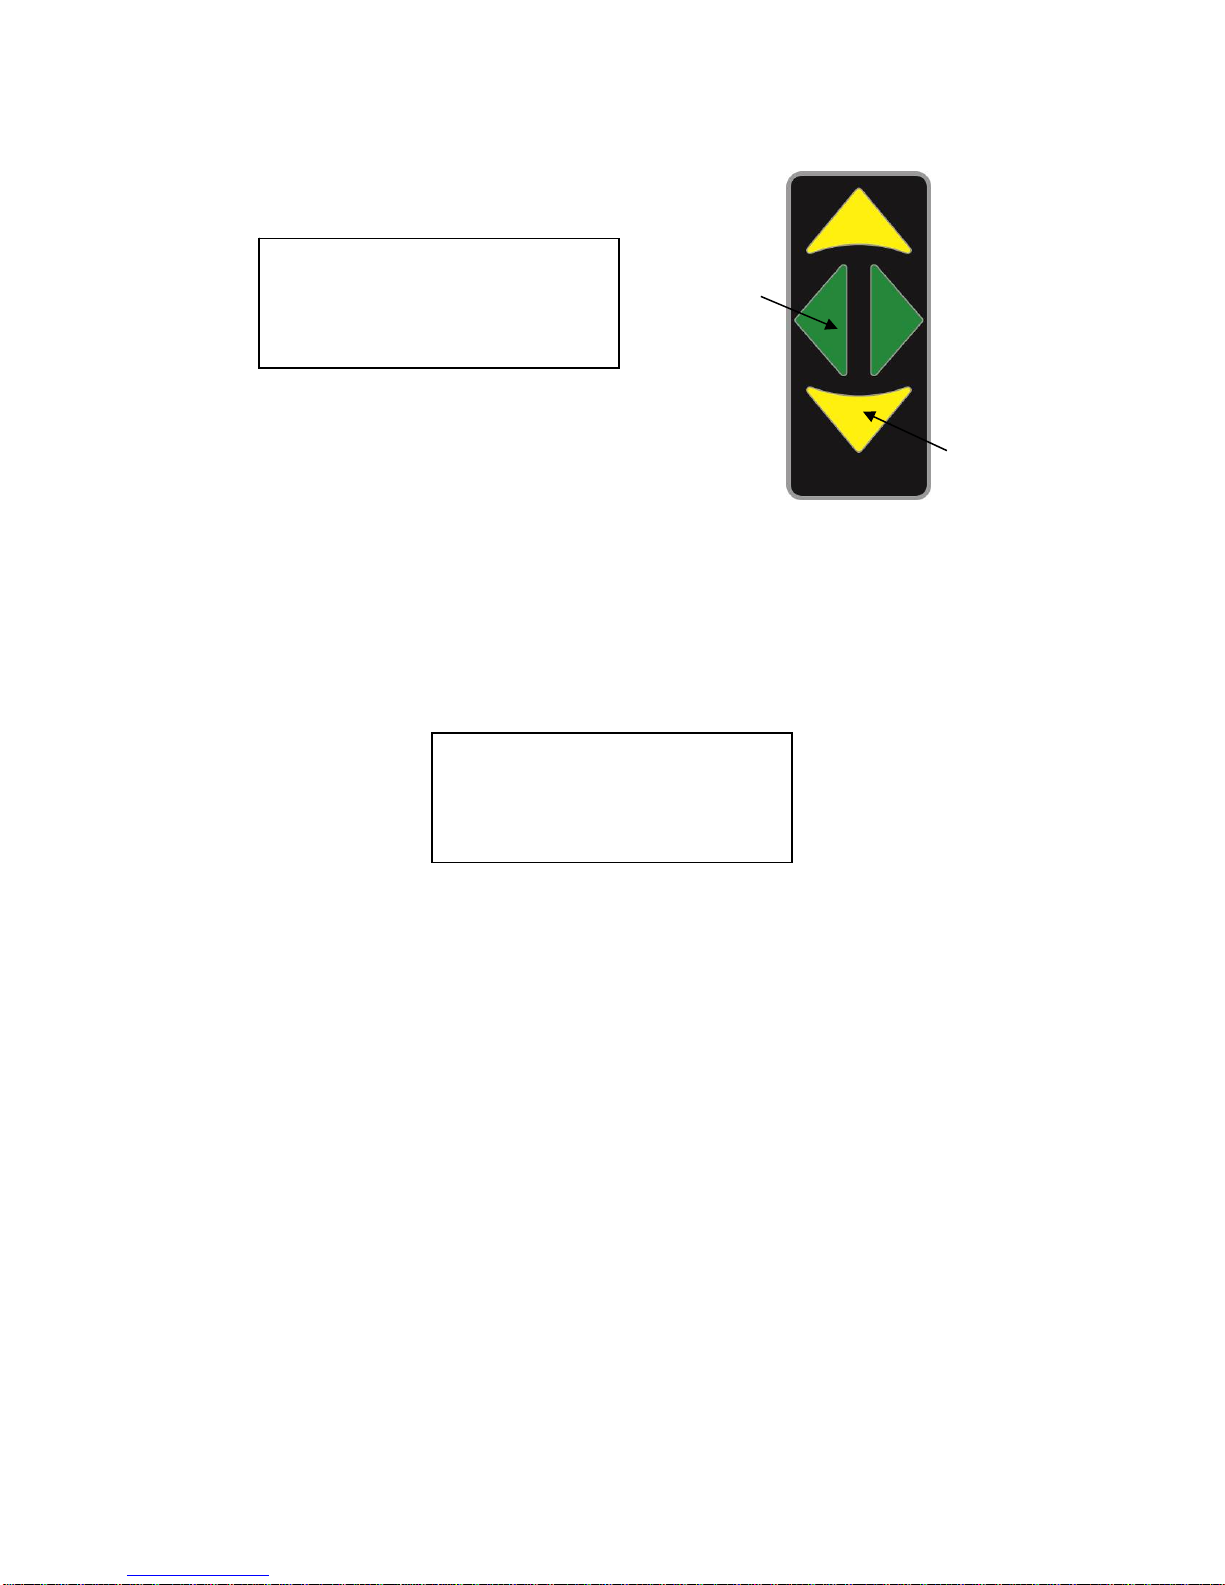
3.2 Keypad:
Figure 2
Figure 2 shows the designations of the keypad’s four keys.
The keypad utilizes membrane keys with a color Mylar overlay. There are four
keys that control the meter:
Scroll Up: Color designation is yellow. Used for scrolling up through the menu
choices and increasing input values.
Scroll Down: Color designation is yellow. Used for scrolling down through the
menu choices and decreasing input values.
Scroll Right: Color designation is green. Used for selecting a specific menu
choice and for scrolling right when changing input values.
Scroll Left: Color designation is green. Used for returning back to the previous
menu and for scrolling left when changing input values. By holding this key the
meter will always return to the main Options menu from any other menu.
3.3 LCD Display:
The LCD is a character based, high contrast display made up of 4 lines by 20
characters. Information is displayed in a menu driven format where selections are
made by scrolling to the desired selection point with the keypad.
3.4 1 meter cable:
The 1m BNC cable connects the meter to the probe.
Never attempt to remove or install the probe or cable while the meter is
powered on. Surges in voltage could damage the probe or meter.
Scroll Up
Scroll DownScroll Left
Scroll Right

3.5 Sonic Meter Probe:
The probe is made of 304 stainless steel with a BNC connector at the top of the
probe and the sensing transducer at the bottom. Each probe has a unique
sensitivity value associated with the sensing transducer. The sensitivity value is
input into the meter’s memory via the keypad. The top of the probe is engraved
with a serial number that distinguishes it from other Sonic Meter probes. For
example, if an operator were to switch the probe from the meter with another
probe, the operator would need to power off the meter, switch the probes, power
up the meter and then go into the Setup menu and change the probe’s sensitivity.
This procedure is explained in detail in section 4.8.
3.6 Battery charger:
The battery charger can only be used to charge Nickel Metal Hydride (NiMH)
type rechargeable batteries. Do not charge NiCd batteries or mix other
batteries with NiMH batteries.
The battery charger should only be powered by 120/240Volts AC at 50/60Hz.
The plug type is NEMA 5-15.
3.7 Batteries:
The Sonic Meter
Sonic AO
ships with 8 AAA Nickel Metal Hydride (NiMH)
batteries. The meter uses 4 AAA NiMH batteries rated 1.2V/800mAh or higher.
The batteries should reach full charge in 5hrs or less.
Do not attempt to charge these batteries with any other charger than the unit
shipped with the meter.

4. Operation:
4.1 Changing the Batteries
Figure 3
Figure 3 shows how the 4 AAA batteries are removed.
With a Phillips screwdriver, unscrew the 6-32 Phillips screw from the back of the
meter. Lift the battery cover out from the meter. Remove the 4 AAA NiMH
batteries, and replace with 4 charged batteries. Make certain that you replace the
batteries into their sockets with the correct polarity. The polarity is clearly
marked on the bottom of each battery socket. Reinstall the battery cover with the
retaining tab positioned first in the bottom of the meter before securing the cover.
Phillips Screwdriver
#6-32 Phillips Screw
Battery Cover
Retaining Tab
4X AAA Batteries
If the batteries are installed with the incorrect polarity, one of three situations will
be evident:
1. One of the 4 batteries was installed with the incorrect polarity.
Observation: The meter will power on, but the battery percentage will not be
displayed, and keypad keys will not function. Reinstall the battery correctly.
2. Two or three batteries were installed with the incorrect polarity.
Observation: The meter will not power on. Reinstall the batteries correctly.
3. All four batteries were installed with the incorrect polarity.
Observation: The 0.63Amp circuit breaker will disengage power. The meter
will not power on. Remove all four batteries. Reset the circuit breaker.
Reinstall the batteries correctly.
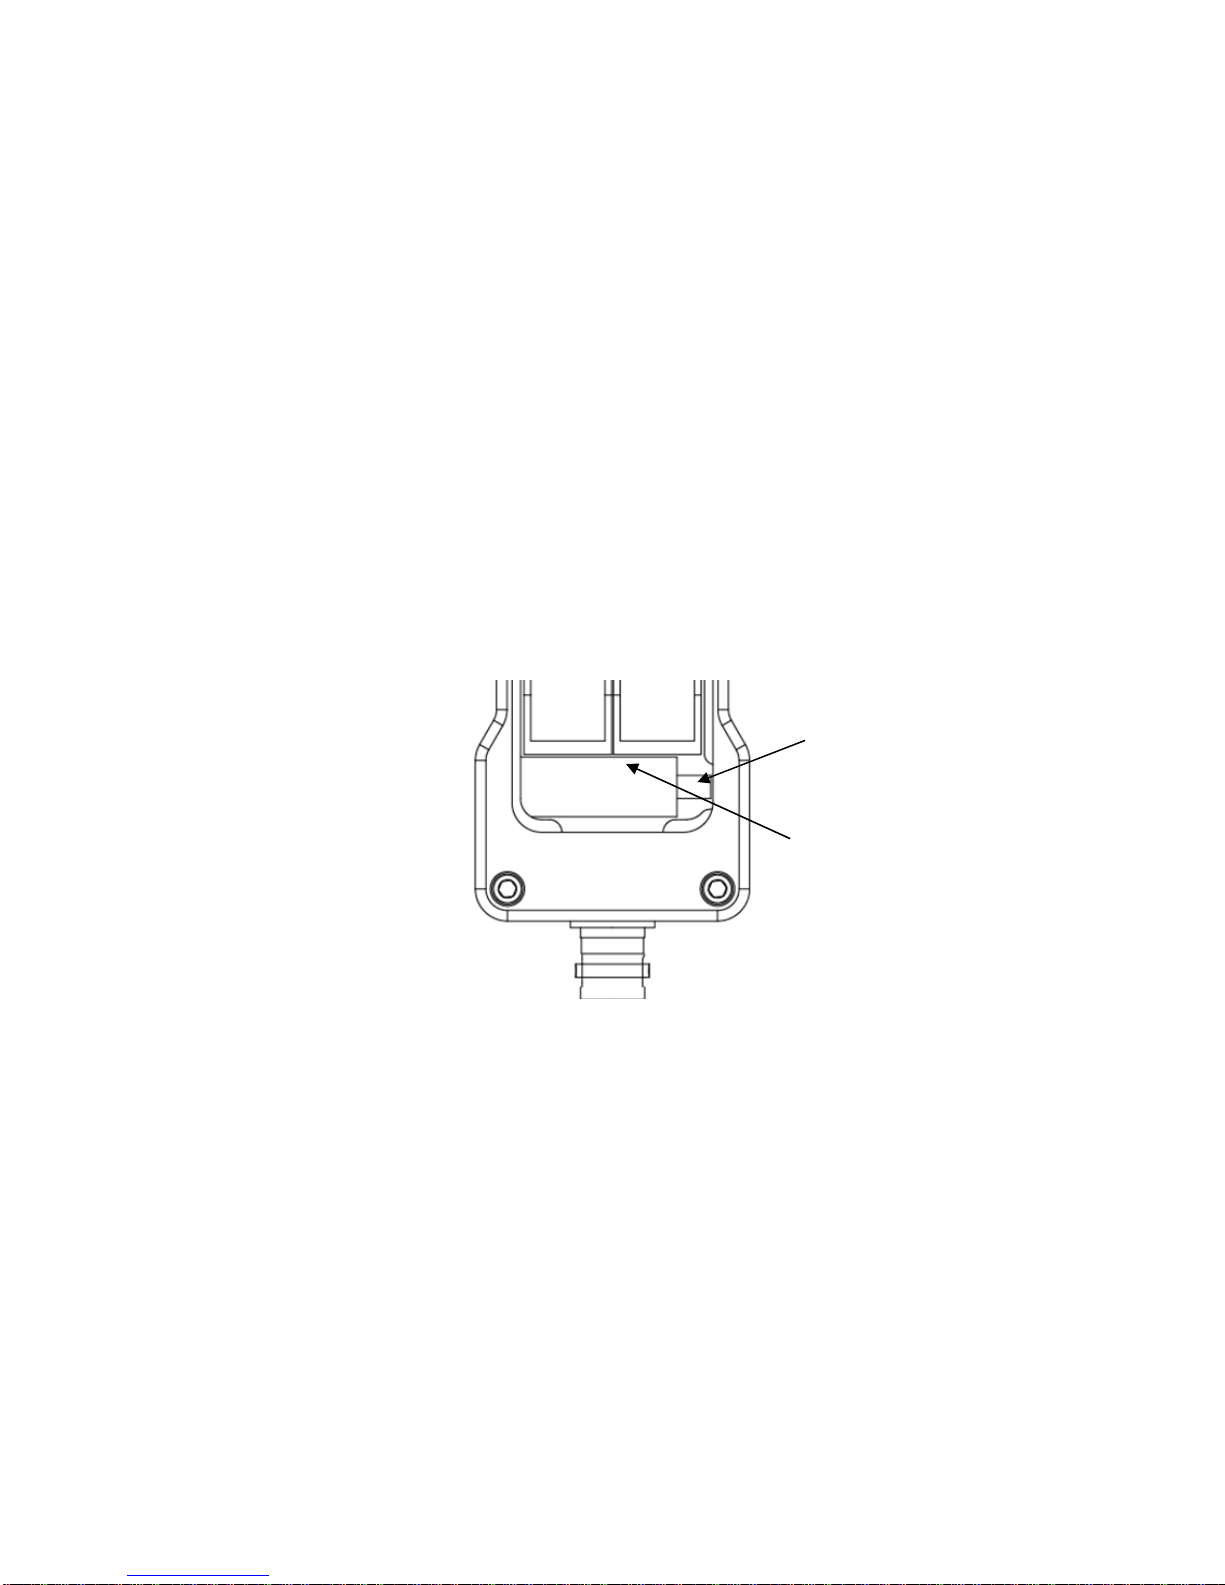
4.2 Resetting the circuit breaker
Figure 4
Figure 4 shows the circuit breaker located at the bottom of the meter just below
the battery housing.
Remove the battery cover. With a small thin screwdriver, carefully push the
small white tab of the circuit breaker to the right. A small click will sound when
the reset tab has been moved all the way to the right. The circuit breaker is now
reset.
The most probable reason for setting off the circuit breaker would be incorrectly
installed batteries.
Push white tab to the right
to reset circuit breaker
0.63 Amp Circuit Breaker

4.3 Powering up the meter
Figure 5
To power the meter on, move the Power Switch to the right as shown in Figure 5.
Note: Before taking measurements, wait approximately 1 minute after
powering up the meter. Waiting 1 minute allows the probe to come to full
charge.
4.4 Options menu (main menu)
The Options menu will appear on the LCD after powering up the meter as shown
in the upper left of Figure 5. The Options menu displays the batteries capacity and
three option selections: 1. Real time reading; 2. Averaged reading; and 3. Setup.
4.5 Battery capacity
The battery’s capacity is displayed in percent. As the battery decreases in
voltage, this value decreases. For NiMH batteries, this value will gradually drop
until about 40%. After this point, the NiMH batteries drop off quickly. With
continuous use, the meter will run approximately 5 hours.
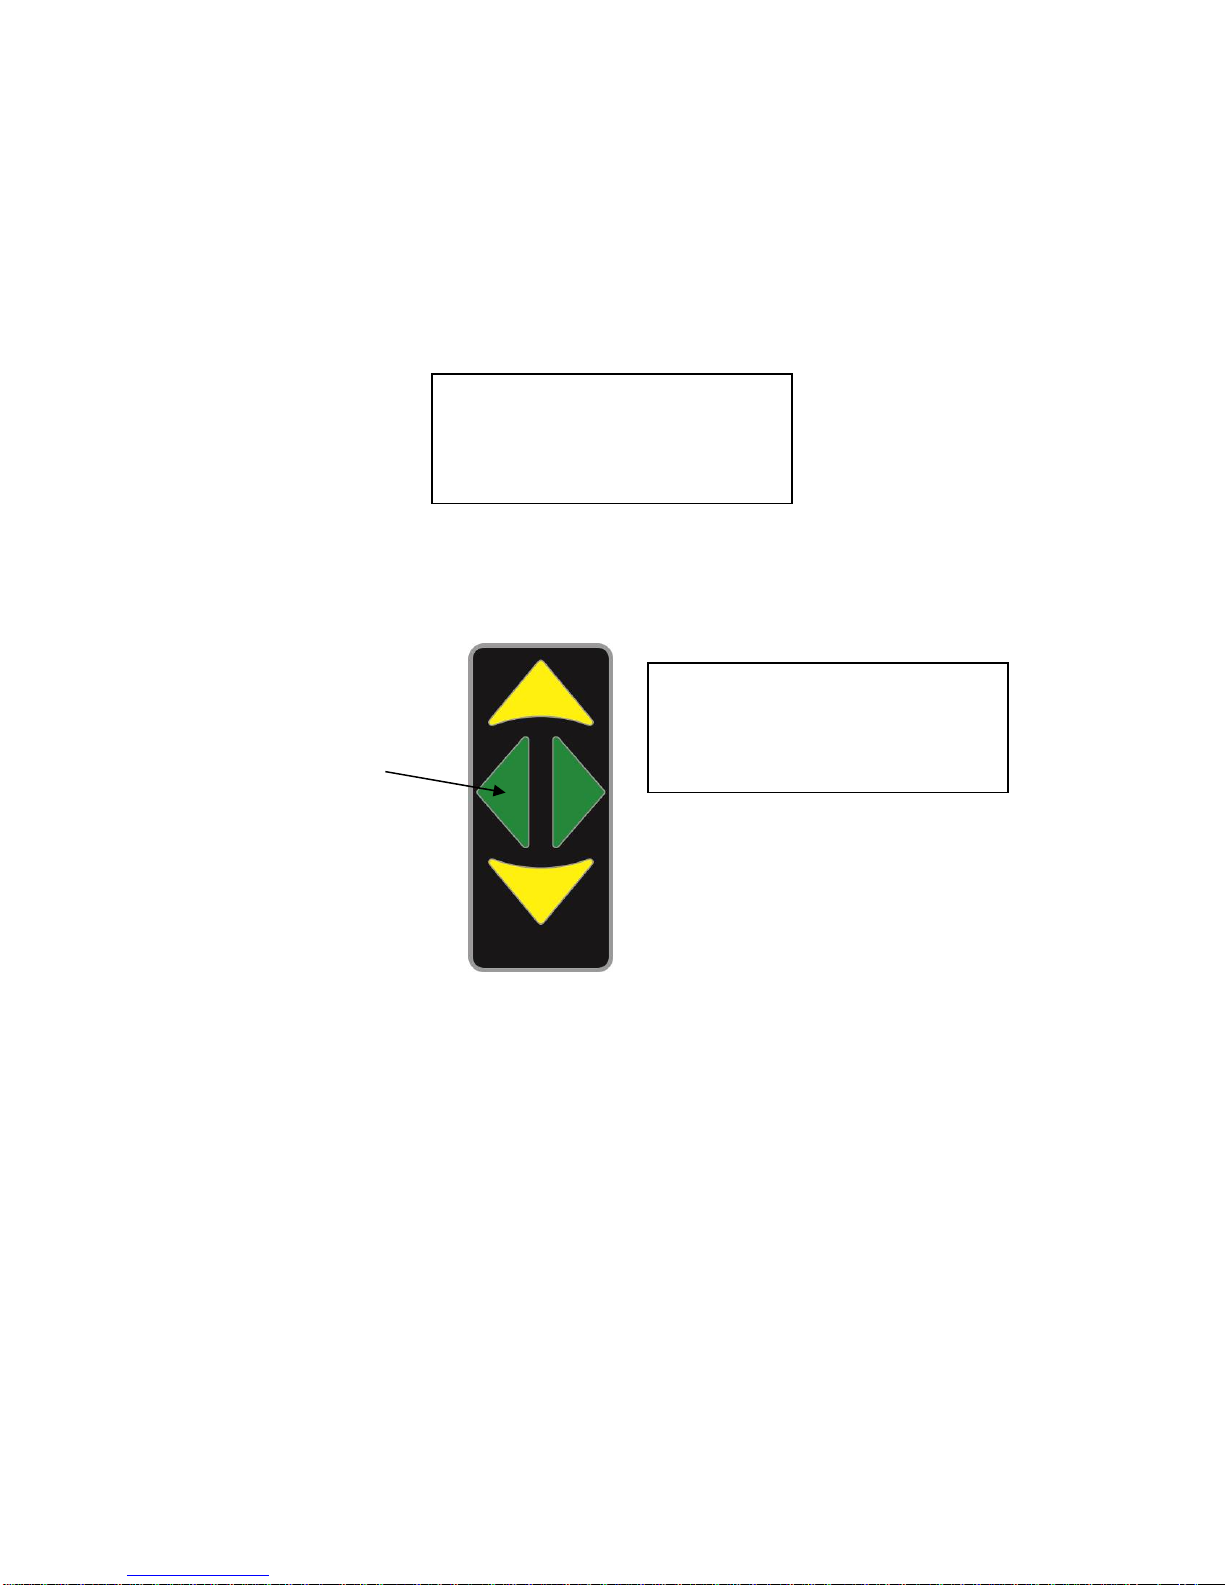
4.6 Real time reading
In Figure 5, the Options menu displays the selection arrow at the 1st position.
Note: the 1st position (Real time reading) is always the default position of the
selection arrow when entering the Options menu.
With the selection arrow still at the 1st position, press and release the Right Scroll
key as shown in Figure 6
Options: Batt.=100%
→1. Real time reading
2. Averaged reading
3. Setup
ON/OFF
Power Switch

Figure 6
The following screen will appear on the LCD as shown below in Figure 7.
Figure 7
The real time pressure (psi) is displayed along with the operator’s specified Low
and High range limits as shown above in Figure 7.
The Low and High range limits are input into the meter’s non-volatile memory at
the Setup stage, which will be explained in section 4.8 Setup.
The Low range limit indicator is a “<” symbol that is displayed in the upper left-
hand corner. Refer to Figure 8. This indicator appears when the pressure reading
is less than the acceptable Low range limit value XXX.XXpsi. At 0.00psi this
symbol is not displayed.
For example: If the Low range limit is <15.00psi and the actual pressure reading
=14.99psi, then the Low range limit indicator “<” will be displayed in the upper
left-hand corner of the LCD as shown below in Figure 8.
Figure 8
Pressure=###.##psi
Low <###.##psi
High >###.##psi
<Pressure= 14.99psi
Low <15.00psi
High >###.##psi
Scroll Righ
t
The High range limit indicator is a “>” symbol that is displayed in the upper right-
hand corner. Refer to Figure 9. This indicator appears when the pressure reading
is more than the acceptable High range limit value XXX.XXpsi.
For example: If the High range limit is >25.00psi and the actual pressure reading
equals 25.01psi, then the High range limit indicator “>” will be displayed in the
upper right-hand corner of the LCD as shown below in Figure 9.
Figure 9
Return back to the Options menu at anytime by pressing and releasing the Left
scroll key as shown below in Figure 10.
Figure 10
Options: Batt.=100%
→1. Real time reading
2. Averaged reading
3. Setu
p
Pressure= 25.01psi >
Low <###.##psi
High >25.00psi
Scroll Left
4.7 Averaged readings
Figure 11
At the Option menu, scroll down to 2nd position as shown above in Figure 11. If
the meter is not at the Option menu press and hold the Scroll Left key.
With the selection arrow at the 2nd position, press and release the Scroll Right key
to select the Averaged reading option. The following menu will appear as shown
below in Figure 12.
Figure 12
The first line displays the real time pressure. The real time pressure is displayed
so that the operator can position the probe in the cleaner before taking an
averaged reading. Below the real time pressure, the Averaged readings menu
displays three selections: 1. Begin readings; 2. Samples= XX; and 3.
Interval=XX.XXsec.
Selection 1 will initiate the averaging of the pressure based on the number of
pressure reading samples and the time interval. Selection 2 will allow the user to
select the number of samples. Selection 3 will allow the user to select the time
interval per sample.
Before taking an average reading of the pressure, selections 2 and 3 will need to
be setup.
Start by changing the Samples value. Press the yellow Scroll Down key once so
that the selection arrow is on 2. If you passed selection 2, you can either press
the yellow Scroll Up key or keep pressing the Scroll Down key until the selection
indicator is at selection 2 as shown below in Figure 13.
Options: Batt.=100%
1. Real time reading
→2. Averaged reading
3. Setu
p
Pressure=###.##psi
→1. Begin readings
2. Samples=##
3. Interval=##.##sec
Scroll Left
Scroll Down

Figure 13
With the selection indicator at the 2nd position, press and release the Scroll Right
key. An underscored flashing cursor will appear in the ones digit of the Samples
value as shown above in Figure 13.
The number of samples can range from 0 to 40.
With the cursor still in the ones digit, use the yellow Scroll Up or Scroll Down
buttons to change this number. When the desired ones digit is set, press and
release the Scroll Left key once. The underscored cursor will now be positioned
in the tens digit as shown below in Figure 14. Once again, use the Scroll Up or
Scroll Down keys to change this number.
Figure 14
When the desired number is set for the tens digit, press and release the Scroll Left
key once to return the selection arrow to the 2nd position. The value will
automatically be saved in non-volatile memory.
To set the time interval between sampling, scroll down to the 3rd position with
yellow Scroll Down key as shown below in Figure 15
Figure 15
With the selection indicator at the 3rd position, press and release the Scroll Right
key. An underscored flashing cursor will appear in the hundredths digit of the
Samples value as shown in above Figure 15.
Pressure=###.##psi
1. Begin readings
→2. Samples=#0
3. Interval=##.##sec
Pressure=###.##psi
1. Begin readings
→2. Samples=10
3. Interval=##.##sec
Pressure=###.##psi
1. Begin readings
2. Samples=10
→3. Interval=##.#8sec

The time interval between samples can range from 0.01 to 99.99 seconds.
Figure 16
With cursor still in the hundredths digit, use the yellow Scroll Up or Scroll Down
buttons to change this number. When the desired hundredths digit is set, press
and release the Scroll Left key once. The underscored cursor will now be
positioned in the tenths digit as shown above in Figure 16. Once again, use the
Scroll Up or Scroll Down keys to change this number. Repeat this step for the
ones and tens digits. When the desired number is set for the ones and tens digits,
press and release the Scroll Left key once to return to the selection arrow at the
3rd position. The value will automatically be saved in non-volatile memory.
When the number of samples and time interval parameters are set to the desired
values, scroll up to the 1st position (Begin readings) by pressing and releasing the
yellow Scroll Up key twice. To execute the averaging process, press and release
the Scroll Right key once. The following screen prompt will appear as shown
below in Figure 15. This screen will remain for the duration of the averaging.
The index (number of samples) of the average will count down each of the
readings and be displayed in the upper left-hand corner as shown below in Figure
17.
Figure 17
After the averaging process has been completed, the following screen will display
the average pressure value as shown in Figure 18.
Figure 18
To return to the averaging screen press the Scroll Left key once. To return to the
options screen, press the Scroll Left key again.
Pressure=###.##psi
1. Begin readings
2. Samples=10
→3. Interval=##.28sec
#
* Averaging Data *
Average = ###.##psi
←exit

4.8 Setup
From the Options menu, scroll down to the 3rd option as shown below in Figure
19.
Figure 19
With the selection indicator at the 3rd position, press and release the Scroll Right
key. The Setup menu will appear as shown below in Figure 20.
Figure 20
Options 1 and 2 are used for setting up the low and high range limits that were
explained in section 4.6. The low and high range limits are calculated as follows:
low range = median(value) – limits(value)
high range = median(value) + limits(value)
Example: median = 25, limits = +5. The low and high range limits will be 20 and
30 psi, respectively.
Now set the limits. With the selection indicator at the 1st position, press and
release the Scroll Right key.
The following limits setup screen will appear as shown below in Figure 21.
Figure 21
The cursor will appear underscored and flashing in the hundredths position of the
“New Value”. By using the yellow Scroll Up/Down keys, each digit can be
Options: Batt.=100%
1. Real time reading
2. Averaged reading
→3. Setu
p
Instrument Setup:
→1. Limits
2. Median
3. Probe Setu
p
Old value=XXX.XXpsi
Enter a new limit:
New value=XXX.XXpsi
To exit scroll left

changed. To move to the next digit use the Left Scroll key. The cursor can
always be moved to the previous digit by using the Right Scroll key. After the
last digit (hundreds) has been set, push the Left Scroll key once to return to the
Setup menu. Values are automatically saved.
Now set the median. At the Setup menu, with the selection indicator at the 2nd
position (Median), press and release the Scroll Right key.
The following median setup screen will appear as shown in below in Figure 22.
Figure 22
Use the same procedure to setup the median as was previously used for setting up
the limits.
Now set the probe sensitivity.
Each probe sold with each Sonic Meter®has a unique sensitivity value. Because
of this, the probe sensitivity value will have to be changed whenever the probe is
switched among meters or a probe has been replaced due to damage. If this is
not done, the accuracy of the measured value will change by a small amount. The
serial number of each probe is engraved at the top of the probe. The sensitivity
and serial number for each probe is recorded in the Calibration Sheet (packaged
with the meter). If more than two meters are used at the same location,
occasionally check to make sure the probes are matched with their corresponding
meters.
At the Setup menu, with the selection indicator at the 3rd position (Probe), press
and release the Scroll Right key.
The following median setup screen will appear as shown in below in Figure 23.
Figure 23
Old value=XXX.XXpsi
Enter a new median:
New value=XXX.XXpsi
To exit scroll left
Old value=XXX.XXpsi
Enter sensitivity:
New value=XXX.XXpsi
To exit scroll left

Use the same procedure to setup the probe sensitivity as was previously used for
setting up the limits and median. Refer to Appendix E for the probe’s sensitivity
value.
4.9 Powering off the meter
To power off the meter, simply move the ON/OFF switch to the left as shown in
Figure 24.
Figure 24
4.10 How to take measurements
Follow the manufacturer’s operating procedures before operating ultrasonic
cleaners: set the proper degas and temperature settings before taking any readings.
Quick real time pressure readings:
The real time reading mode allows for a quick estimate of the pressure at a
particular point. This is useful for checking pressure levels during the process of
cleaning.
Note: the pressure indicates the actual cleaning scrub-force at a particular
location.
Begin probing the tank with the meter in real time reading mode. Notice the
fluctuations in the readings. The readings usually fluctuate + 3 psi for most tanks,
but can fluctuate higher depending on your tank and the shape of the part sitting
inside of it.
ON/OFF
Power Switch

Average pressure:
For precise pressure readings, set the meter in averaged reading mode. Averaged
reading mode is useful for determining the pressure levels of a particular point or
the tanks overall output
For a good starting point, set the number of samples to 10, and the interval to 1
second. These settings will average 10 samples over a 10second period.
With the meter still in averaged reading mode, take 10 to 20 readings throughout
the tank (more readings for lager tanks). Make sure to hold the probe steady
while taking each average. Write down each reading. Then average these
readings to get an overall pressure value for the tank.
Note: The more readings taken, the more accurate will be the overall average of
the tank’s output. If mapped at different depths, a clear picture of the distribution
can be determined. Additional methods for increased repeatability involve
readings at tightly held locations using some sort of grid plate located over the
tank with locating holes. Also including multiple depths by using a lock collar
along the body of the probe tube is very helpful.
Factors that determine the tanks pressure output:
Pressure levels can vary by as much as +10psi each time a different set of
measurements is taken.
The factors that determine this variance are:
•Degas time
•Tank temperature
•Part geometry
•Probe position
Degas the tank according to the manufacturer’s specifications. The degas time is
usually 15-20 minutes
Some tanks have a heat setting so that temperature can be controlled. Follow the
manufacturer’s specifications. Usually by the time the tank is degassed, the
temperature has stabilized.
Part geometry: the shape of a part can cause a change in the pressure output. The
part’s shape can cause constructive and destructive interference.
Probe position is critical. Within only a few millimeters, the pressure can vary
significantly (this variance differs by tank type). This is due to nodes of high and
low pressure that develop within the liquid. For the highest level of precision, the
probe should be held in some type of fixture that allows for x, y and z positions.
Table of contents
Other Sonic Meter Measuring Instrument manuals


