Standa 11SOLO2 User manual
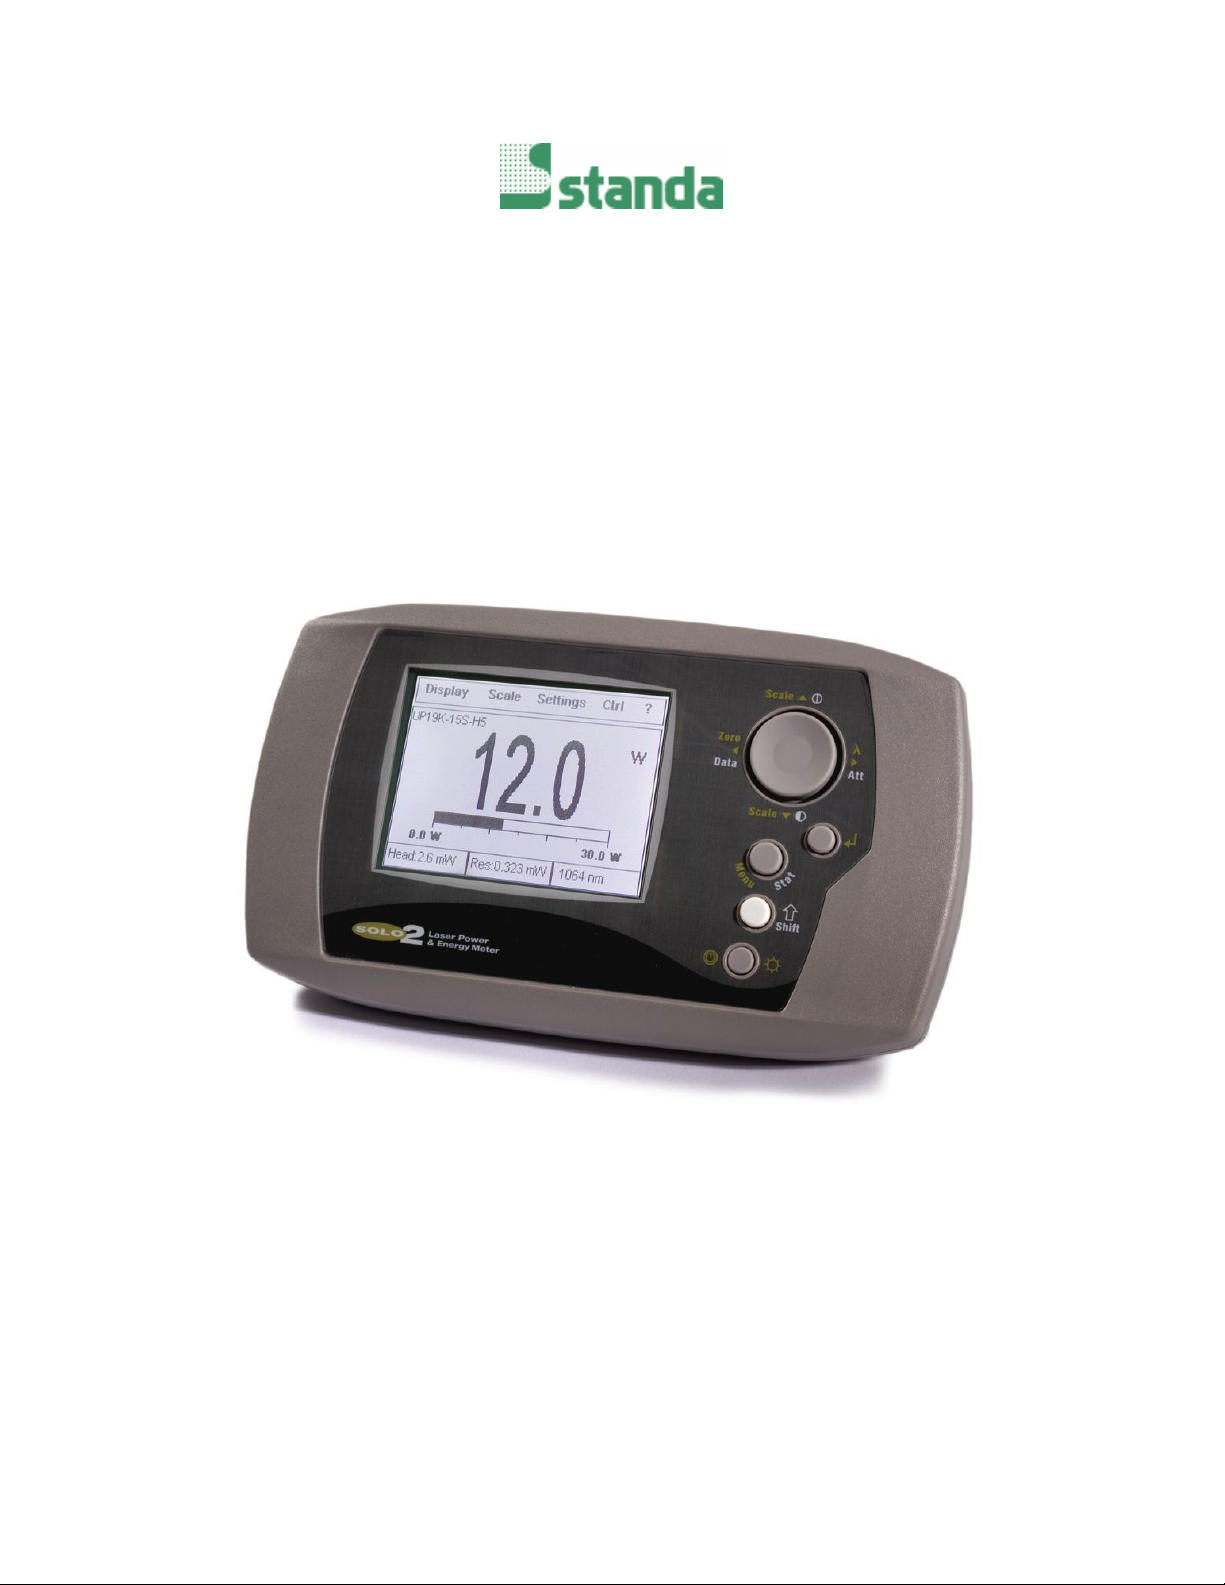
SINGLE CHANNEL LASER POWER/ENERGY METER
11SOLO2
INSTRUCTION MANUAL
Revision –0.9
June 2008

11SOLO2 User’s Manual Revision 0.9 1
WARRANTY
The Standa 11SOLO2 Single Channel Laser Power, Energy and Power/Energy Meter carries a one-year
warranty (from date of shipment) against material and/or workmanship defects, when used under normal
operating conditions. The warranty does not cover damages related to battery leakage or misuse.
|Standa will repair or replace, optionally, any 11SOLO2 that proves to be defective during the warranty
period, except in the case of product misuse.
Any attempt by an unauthorized person to alter or repair the product voids the warranty.
The manufacturer is not liable for consequential damages of any kind.
Customers must fill in and mail the warranty card in order to activate the warranty.
In case of malfunction, contact your local Standa distributor or nearest Standa office to obtain a return
authorization number. The material should be returned to:
STANDA
Švitrigailos 4-39
03222 Vilnius
Lithuania
Tel: +370-5-2651474
Fax: +370-5-2651483
e-mail: [email protected]
Website: www.standa.lt
CLAIMS
To obtain warranty service, contact your nearest Standa agent or send the product, with a description of
the problem, transportation and insurance prepaid, to the nearest Standa agent. Standa assumes no risk
for the damage in transit. Standa will, at its option, repair or replace the defective product free of charge
or refund your purchase price. However, if Standa determines that the failure is caused by misuse,
alterations, accident or abnormal condition of operation or handling, you will be billed for the repair and
the repaired product will be returned to you, transportation prepaid.
Standa Ltd. All rights reserved

11SOLO2 User’s Manual Revision 0.9 2
SAFETY INFORMATION
Do not use the 11SOLO2 if the device or the detector looks damaged, or if you suspect that the
11SOLO2 is not operating properly.
Appropriate installation must be done for water-cooled and fan-cooled detectors. Refer to the specific
instructions for more information. The user must wait for a while before handling these detectors after
power is applied. Surfaces of the detectors get very hot and there is a risk of injury if they are not allowed
to cool down.
Note: This equipment has been tested and found to comply with the limits for a Class B
digital device, pursuant to part 15 of the FCC Rules. These limits are designed to
provide reasonable protection against harmful interference in a residential installation.
This equipment generates, uses, and can radiate radio frequency energy and, if not
installed and used in accordance with the instructions, may cause harmful interference
to radio communications. However, there is no guarantee that interference will not
occur in a particular installation. If this equipment does cause harmful interference to
radio or television reception, which can be determined by turning the equipment off and
on, it is suggested to try to correct the interference by taking one or more of the
following steps:
• Reorient or relocate the receiving antenna.
• Increase the distance between the equipment and receiver.
• Connect the equipment to an outlet that is on a different circuit than the receiver.
• Consult the dealer or an experienced radio/TV technician for help.
Caution: Changes or modifications not expressly approved in writing by Standa may void the
user’s authority to operate this equipment.
SYMBOLS
The following international symbols are used in this manual:
Refer to the manual for specific Warning or Caution information to avoid any damage to
the product.
DC, Direct Current
Standa Ltd. All rights reserved

11SOLO2 User’s Manual Revision 0.9 3
1.1 INTRODUCTION.............................................................................................................................................6
1.2 SPECIFICATIONS ...........................................................................................................................................7
1.3 FRONT PANEL DESCRIPTION.........................................................................................................................9
1.4 TOP PANEL DESCRIPTION ...........................................................................................................................10
2.1 HOW TO USE THE KEYS TO ACCESS THE MENUS...........................................................................................12
2.2 QUICK POWER AND ENERGY MEASUREMENT PROCEDURE...........................................................................13
2.3 DESCRIPTION OF THE TOP LEVEL 11SOLO2 MENUS ...................................................................................16
2.3.1 Displays.............................................................................................................................................16
2.3.1.1 Real time display ...........................................................................................................................16
2.3.1.2 Histogram display..........................................................................................................................17
2.3.1.3 Line Plot display............................................................................................................................17
2.3.1.4 Statistics display ............................................................................................................................18
2.3.1.5 Peak Power Display.......................................................................................................................18
2.3.1.6 Status display.................................................................................................................................19
2.3.1.7 Avg Display...................................................................................................................................19
2.3.1.8 View File .......................................................................................................................................20
2.3.1.9 Fluence Display.............................................................................................................................20
2.3.1.10 Zoom..........................................................................................................................................20
2.3.1.11 Digital Tuning Needle display...................................................................................................21
2.3.2 Scale Menu ........................................................................................................................................21
2.3.3 Settings...............................................................................................................................................22
2.3.3.1 Wavelength Setting........................................................................................................................22
2.3.3.2 Corrections Setting ........................................................................................................................23
2.3.3.3 Data Sampling Settings..................................................................................................................24
2.3.3.4 Trig Level Setting..........................................................................................................................29
2.3.3.5 Period Multiplier............................................................................................................................29
2.3.3.6 Refer Values ..................................................................................................................................29
2.3.3.7 Save and Load User Settings.........................................................................................................30
2.3.3.8 Power Unit.....................................................................................................................................31
2.3.3.9 Communication..............................................................................................................................31
2.3.3.10 Fluence.......................................................................................................................................31
2.3.3.11 Peak Power ................................................................................................................................31
2.4 REAL-TIME CONTROLS AND ABOUT 11SOLO2..........................................................................................31
2.4.1 Control Functions in the Ctrl menu...................................................................................................32
2.4.1.1 Ctrl – Zero Offset...........................................................................................................................32
2.4.1.2 Ctrl - Acquire Data ........................................................................................................................32
2.4.1.3 Ctrl - Transfer File.........................................................................................................................32
2.4.1.4 Ctrl – Statistics Mode ....................................................................................................................33
2.4.1.5 Ctrl – Relative Mode .....................................................................................................................33
2.4.1.6 Ctrl – Energy Mode.......................................................................................................................34
2.4.1.7 Ctrl - Analog OUT.........................................................................................................................34
2.4.1.8 Ctrl - Anticipation..........................................................................................................................35
2.4.1.9 Ctrl – Display Hi Res.....................................................................................................................35
2.4.1.10 Ctrl – View Data........................................................................................................................35
2.4.2 “?”.....................................................................................................................................................35
2.5 SERVICE .....................................................................................................................................................35
3.1 INSTALLATION............................................................................................................................................36
3.1.1 Installation for Windows™: ..............................................................................................................36
3.2 SETTING UP COMMUNICATION TO THE 11SOLO2.......................................................................................36
3.2.1 Verify COM Port................................................................................................................................36
3.2.2 Connect to the 11SOLO2...................................................................................................................36
3.2.3 To echo commands ............................................................................................................................37
3.2.4 Test the connection............................................................................................................................37
3.2.5 HyperTerminal settings shortcut .......................................................................................................37
3.3 PCSOLO USER-FRIENDLY SERIAL DATA ACQUISITION SOFTWARE .............................................................37
3.4 TRADITIONAL COMMUNICATION SETTINGS................................................................................................38
Standa Ltd. All rights reserved

11SOLO2 User’s Manual Revision 0.9 4
3.4.1 Serial Command format.....................................................................................................................38
3.4.1.1 Serial Protocol Rules:....................................................................................................................38
3.4.1.2 Text mode rules:............................................................................................................................38
3.4.1.3 Binary Mode rules:........................................................................................................................39
3.4.2 Serial Command Directory................................................................................................................41
3.4.3 Serial commands................................................................................................................................42
3.4.4 ERROR MESSAGES..........................................................................................................................60
4.1 USB INSTALLATION FOR THE SOLO2 ........................................................................................................61
4.2 FREE SOFTWARE UPGRADE ........................................................................................................................61
4.3 BATTERY CHARGING..................................................................................................................................61
QEA AND QEAS............................................................................................................................ 62
5.1 QEA/12/25/50 AND QEAS/12/25/50 .........................................................................................................62
ATTENUATOR/DIFFUSER CALIBRATION PROCEDURE................................. 62
6APPENDIX B ..................................................................................................................................... 64
6.1 RECYCLING AND SEPARATION PROCEDURE.................................................................................................64
6.2 SEPARATION:..............................................................................................................................................64
6.3 DISMANTLING PROCEDURE:........................................................................................................................64
Standa Ltd. All rights reserved

11SOLO2 User’s Manual Revision 0.9 5
LIST OF ILLUSTRATIONS
FIG. 1-1 11SOLO2 FRONT PANEL................................................................................................................. 9
FIG. 1-2 11SOLO2 TOP PANEL................................................................................................................... 10
FIG. 2-1 THE MENU BAR............................................................................................................................... 13
FIG. 2-2 THE DIALOG BOX ............................................................................................................................ 13
FIG. 2-3 VIEW OF THE FIRST GROUP OF 11SOLO2 MENUS............................................................................ 16
FIG. 2-4 REAL TIME DISPLAY ....................................................................................................................... 17
FIG. 2-5 DISPLAY OPTIONS MENU ................................................................................................................ 17
FIG. 2-6 STATISTICS DISPLAY....................................................................................................................... 18
FIG. 2-7 STATUS DISPLAY ............................................................................................................................ 19
FIG. 2-8 WATTMETER DATA SAMPLING MENU ............................................................................................... 19
FIG. 2-9 VIEW FILE SCREEN......................................................................................................................... 20
FIG. 2-8 DIGITAL NEEDLE DISPLAY............................................................................................................... 21
FIG. 2-10 SCALE MENU................................................................................................................................21
FIG. 2-11 SETTINGS MENU........................................................................................................................... 22
FIG. 2.12 SETTING CORRECTION MENU ........................................................................................................ 23
FIG. 2-13 DATA SAMPLING PARAMETERS WINDOW........................................................................................ 26
FIG. 2-14 PASS/FAIL MENU......................................................................................................................... 30
FIG. 2-15 PULSE WIDTH SETTING FOR THE PEAK POWER MODE ................................................................... 31
FIG. 2-16 VIEW OF THE MENU STRUCTURE................................................................................................... 32
Standa Ltd. All rights reserved

11SOLO2 User’s Manual Revision 0.9 6
1 THE 11SOLO2 SINGLE CHANNEL LASER POWER/ENERGY METER
1.1 Introduction
To obtain the full performance from the 11SOLO2, we recommend that you read this manual carefully.
The 11SOLO2 is a microprocessor-based power and energy meter that uses the latest technology to
provide a multitude of options in a user-friendly environment. It is a complete power and energy meter.
The 11SOLO2 provide a statistical analysis of your measurements. It allows you to store data on the 1-
megabyte flash internal memory. Moreover, the 11SOLO2 can be updated over the internet by
connecting the USB or the RS-232 port to a personal computer.
The 11SOLO2 has enhanced network capabilities that take further advantage of the USB and RS-232
ports for data acquisition and remote control. It can transfer data files to a PC for more sophisticated data
analysis and respond to commands through the PC interface. You will find an easy-to-use
communications software to transform your PC screen into a virtual 11SOLO2 on our website.
There is no need to enter the head specifications when connecting the new Standa power or energy
detector heads, for heads version 4 and above. The 11SOLO2 is already internally set up to accept all
the Standa wattmeter and joulemeter heads with a DB-15 connector. When connecting a 11QE-xx-x-MT
or a 11XLE-4 the 11SOLO2 enters in the metallic mode to ensure proper measurements. The metallic
mode is available on all 11SOLO2. The new 11SOLO2 also has improved performance in joulemeter
mode that allows 2 additional lower scales.
Although the default parameter is Watt, you may also choose to measure in dBm.
dBm = Log (power in Watts/0.001W)
Unpacking
Each Standa 11SOLO2 is thoroughly tested and calibrated prior to shipment.
Visually inspect every 11SOLO2 unit after removing it from the shipping containers. If you see any
damage, retain all packaging materials and shipping receipts. Any damage claim should be made
promptly to the transportation company. Notify the nearest Standa representative concerning the claim,
so that any repair or replacement can be arranged as soon as possible.
Easy software upgrade
Keep in touch with the latest improvements to our user-friendly software. You can download the latest
software version anytime from our website www.standa.lt and install it on the 11SOLO2 with the serial
interface. You will find all the necessary information on downloading and upgrading in section 4.2.
Standa Ltd. All rights reserved

11SOLO2 User’s Manual Revision 0.9 7
1.2 Specifications
The following specifications are based on a one-year calibration cycle, an operating temperature of 18 to
28ºC (64 to 82ºF) and a relative humidity not exceeding 80%.
Table 1-1 List of Specifications
Power meter specifications 11SOLO2
Power Range 0.1 nW to 10 kW
Power Scales
(photo diode head)
3nW, 10nW, 30nW, 100nW, 300nW, 1µW, 3µW, 10µW, 30µW, 100µW,
300µW, 1mW, 3mW, 10mW, 30mW, 100mW, 300mW, 1W, 3W
Power Scales
(thermal head)
16 scales: 300uW, 1mW, 3mW, 10mW, 30mW, 100mW, 300mW, 1W,
3W, 10W, 30W, 100W, 300W, 1kW, 3kW, 10kW
Resolution (digital) Current scale/2048
Monitor Accuracy ±0.5 % 5 µV full scale1
Response Time
(accelerated)2
1 sec
Sampling Frequency 200 kHz
Statistics Current value, Max, Min, Average, Std Dev., RMS stability, PTP stability,
Time
Energy meter specifications 11SOLO2
Energy Range 0.1µJ to 20 kJ
Energy Scales 20 scales: 10uJ, 30uJ, 100µJ, 300µJ, 1mJ, 3mJ, 10mJ, 30mJ, 100mJ,
300mJ, 1J, 3J, 10J, 30J, 100J, 300J, 1kJ, 3kJ, 10kJ, 30kJ
Resolution (digital) 5 nJ
Accuracy31.0 %50 µV < 500 Hz
2.0 %50 µV 500 Hz to 1.2 kHz
3%50 µV 1.2 kHz to 6 kHz (MT mode)
6%50 µV 6kHz to 10 kHz (MT mode)
Default Trigger Level 2 %
Software Trigger
Level
0.1% to 99.9%, 0.1% resolution
Metallic mode: hardware set to 3%.
1The 5µV bias can introduce an error into low power measurements with low sensitivity detectors. It is
essential to use the Zero Offset to rezero the 11SOLO2 before making a measurement in these
conditions. It is always good practice to use the Zero Offset. See section 2.2.
2Varies with detector head.
3Including linearity, detector dependant.
Standa Ltd. All rights reserved

11SOLO2 User’s Manual Revision 0.9 8
Repetition Frequency 3 kHz in acquire data, no missing point
2 kHz in statistics mode, no missing point
3-10 kHz in acquire data, with data sampling at a pulse rate of 3 kHz4.
Statistics Current value, Max, Min, Average, Std Dev., RMS stability, PTP stability,
Pulse #, Repetition Rate, Avg Power.
Data Storage 225,000 points5
General Specifications 11SOLO2
Digital Display 76.78 x 57.58 mm LCD, 240 x 160 Pixels
Display Rate 3 Hz numeric display
15 Hz bar graph & needle display
Bar Graph 165 divisions
Data Displays Real time, Line plot, Histogram, Statistics, Digital tuning needle
User input correction
factors
2 multipliers and 2 offsets (7 digits floating point)
Analog Output 0 – 1 volt, full scale, ± 1%
Internet Upgrades USB and RS-2326
PC Serial Commands USB and RS-2325
High throughput
serial frequency
Up to 200Hz, with a 310 ms delay between burst for Metallic or XLE
joulemeters, whereas 45 to 78 ms for MB joulemeter and power heads.
Dimensions (without
stand)
210 mm(W) x 122 mm (H) x 44 mm (D)
Weight (with stand) 0.52 kg
Battery Pack 4 rechargeable 1.2 V Ni-MH AA
Battery life 11 hours, 6 hours with backlight
Battery charge time 6 hours
Universal External
Power Supply
Input: 100/240 VAC 50-60 Hz, Output 9 VDC 1.66 A.
4Above 3 kHz the monitor will sample points but no log every single point.
5Maximum if not using any advanced features that require memory.
6USB cable included. RS-232 cable must be purchased separately.
Standa Ltd. All rights reserved

11SOLO2 User’s Manual Revision 0.9 9
Fig. 1-1 11SOLO2 Front Panel
1.3 Front Panel Description
1- I/O and backlight control key.
The I/O key has two functions:
a. 11SOLO2 on and off
Pressing the I/O key quickly when the 11SOLO2 is OFF turns the 11SOLO2 ON (do not
hold the I/O key). To turn off the 11SOLO2, press and hold the I/O key a few seconds.
To prevent battery leakage and to increase battery life, we recommend switching off the
11SOLO2 when not in use.
b. Backlight control
With 11SOLO2 ON, pressing the I/O key very quickly switches the LCD screen Backlight
ON or OFF. If you are working without the external power supply, turn the backlight off
for longer battery life.
2- , , , Arrow keys.
a. The Arrow keys allow the user to browse through the menus. Press the Right Arrow
key until you reach your desired option. To go backwards, keep pressing the Left Arrow
key
b. When you are not in the Menu, the Arrow keys permits alternative function for quick
access button
UP key: Make a physique scale up and the auto-scale is disabled.
Down key: Make a physical scale down and the auto-scale is disabled.
Left key: Makes or remakes a zero offset.
Right key: Activate the custom wavelength keypad.
3- ENTER key.
The ENTER key selects the highlighted option.
4- Menu Key
The Menu key gives access to the MENU BAR.
5- LCD SCREEN
Standa Ltd. All rights reserved
11SOLO2 User’s Manual Revision 0.9 10
76.8 x 57.6 mm Liquid Crystal Display Screen, 160 X 240 pixels. Press the shift
ket and use the Up and Down arrow keys () to decrease and increase the LCD
screen contrast.
6- Shift key
The shift key gives access to more quick buttons.
Shift-key right: Activate the attenuator for photodiode heads.
Shift-key left: open the data sampling settings menu.
Shift-key up: decrease the contrast level.
Shift-key down: increase the contrast level.
Shift-key menu: open the statistic menu.
7- LCD SCREEN CONTRAST ADJUSTMENT
Press the shift key and use the Up and Down arrow keys () to decrease and
increase the LCD screen contrast.
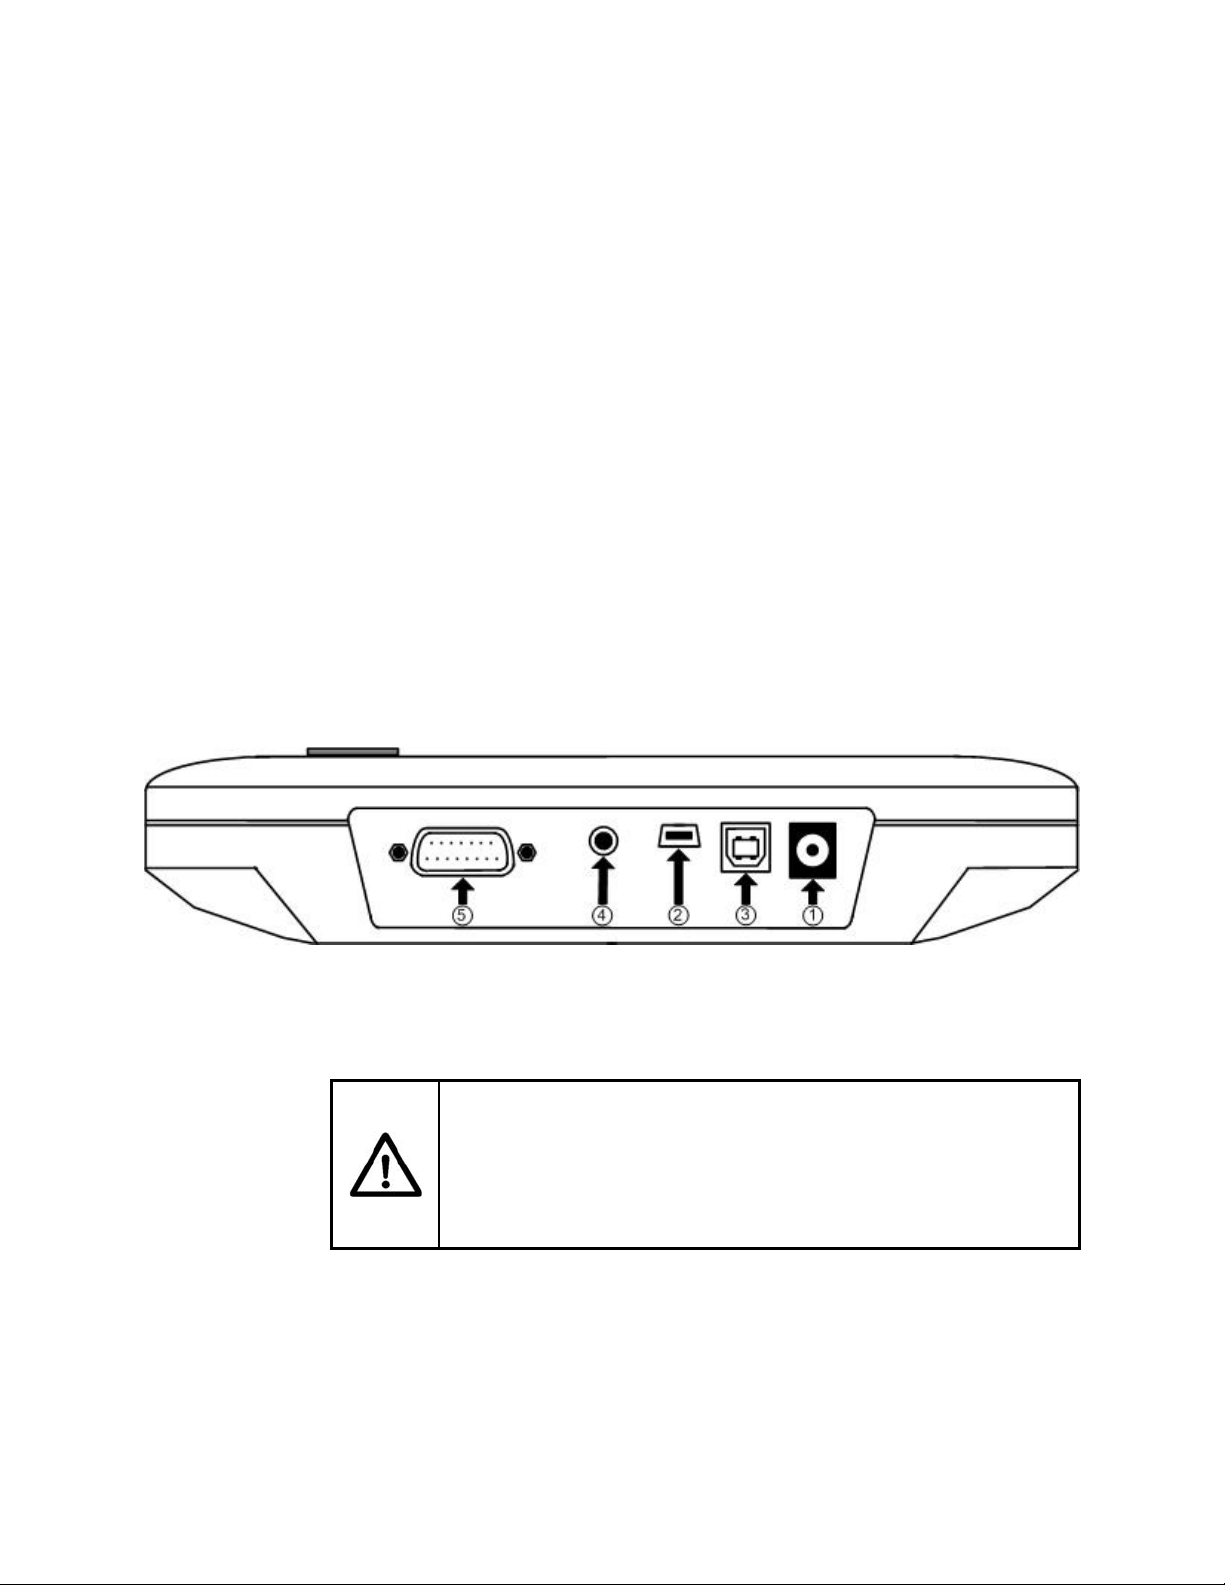
1.4 Top Panel Description
Fig. 1-2 11SOLO2 Top Panel
1- EXTERNAL POWER SUPPLY INPUT JACK:
CAUTION
Permanent damage may occur to the optical meter if an external
power supply other than the Standa P/N 200960A is used. Please
call Standa or your local distributor if extra power supplies are
needed.
Input voltage required: 9 VDC/800 mA. For an input of 11 to 15 volts the battery will not
charge, but the monitor will work. If input voltage is between 15 and 25 volts the monitor will
switch to USB power or battery power. If the input power is above 26 volts either the internal
fuse will blow or depending on voltage level and waveform it may damage the monitor.
2- USB INTERFACE CONNECTOR:
Standa Ltd. All rights reserved

11SOLO2 User’s Manual Revision 0.9 11
This interface allows remote control and data transfers between the 11SOLO2 and a
computer that has a USB communication port.
3- SERIAL INTERFACE CONNECTOR (RS 232):
This interface allows remote control and data transfers between the 11SOLO2 and a
computer, a terminal, or any device that has a serial communication port.
4- 0 to 1 VOLT ANALOG OUTPUT:
For monitoring laser average power or energy by using external equipment such as a chart
recorder, a computer with an analog interface, a voltmeter, etc.
The output signal represents the amplified and anticipated power detector response in the
case of a power measurement. In the case of an energy measurement, the output signal is a
DC voltage representing the pulse energy value.
The 1 V value corresponds to the full scale reading of the selected range. That provides the
best signal-to-noise ratio. The measured power or energy is then related to the output voltage
and to the selected range according to the following equations:
selectedRangeofMax
outputVPower
selectedRangeofMax
outputVEnergy
For example:
1.00 V corresponds to 10 Watt on the 10 W range
0.25 V corresponds to 2.5 Watt on the 10 W range
0.10 V corresponds to 30 milliwatts on the 300 mW range
Specifications:
Maximum output voltage: 1 V
Output impedance: 10 k
Connector type: Female 1/8” jack
5- PROBE INPUT JACK:
The 11SOLO2 uses a DB-15 female connector to mate with the detector heads (probes).
The 11SOLO2 works with all Standa detectors. It automatically recognizes every power
detector head, which ensures accurate auto-calibration. More importantly, it can take
advantage of our Personal wavelength correction™. It reads the memory in the Smart
Interface connector (version 5 and higher) to provide a wavelength correction that is based on
spectral data measured from that specific detector.
The 11SOLO2 may not recognize some of the earlier heads. These are identified as
“wattmeter.”
Energy detector heads prior to version 4 have a BNC connector. The user must use a
universal BNC/DB-15 adaptor to connect an energy detector head to the 11SOLO2. This
adaptor is compatible with all the Standa pyroelectric joulemeters except the EPD.
For these early energy detector heads, a pop-up menu asks the user to select the proper
detector model. This does not affect the reading and the measured value is still valid.
Power detectors of version V2 and higher and Energy detectors of version V4 and
higher are equipped with an “intelligent” DB-15 male connector that mates directly to the DB-
15 female connector. They do not require an adaptor.
Standa Ltd. All rights reserved

11SOLO2 User’s Manual Revision 0.9 12
WARNING: This DB-15 connector, though similar to that of the former TPM-310 and TPM-330
monitors, is incompatible with the power detector heads of PS-310 Series Version 1
and PS-330 Series Version 1. These heads used a different technology and do not
have the same pin-out configuration.
A V1 to V2 adaptor can be used in order to connect the power detector heads of PS-310
Series and PS-330 Series Version 1 and 2. Please contact your local Standa distributor or the
nearest Standa office for further information.
Any attempt to modify connectors of the early version heads to mate with the 11SOLO2 can
result in damage to the monitor.
2 Getting Started
This section contains important information concerning the installation and operation of the 11SOLO2.
The 11SOLO2 is delivered ready to use. Just insert a detector head in the Probe Input Jack (#5 in
Figure 1-2) and press the I/O key.
2.1 How to use the keys to access the menus
The powerful CPU of the 11SOLO2, combined with the WindowsCE operating system, provides easy
and intuitive access to all of its functions. This user-friendly Windows-based interface is controlled by
four Arrow keys, an key (Enter key) and a Menu key. For users familiar with Windows, it works as
any Windowsmenu, with the ALT key being replaced by the Fkey.
Pressing the Fkey (see Figure 2-1) provides access at any time to the menu bar and, from there, to the
five main menus. Use the Left and Right arrow keys to go from one menu to the next. The selected
menu drops down to show its options. Use the Up and Down arrow keys to select the desired item from
the menu. Once the desired item is highlighted, press the Enter key to activate the function. When a
menu option has an arrow “X” at the end, pressing Enter or the Right Arrow Key “t”opens a
submenu where you can select the function. For example, in the case of the Setting menu, first select
Corrections with the Down Arrow key, followed by the Enter or the Right Arrow key “t” to access
the submenu. Move to the desired option with the arrow keys and press the Enter key to activate.
Standa Ltd. All rights reserved
11SOLO2 User’s Manual Revision 0.9 13
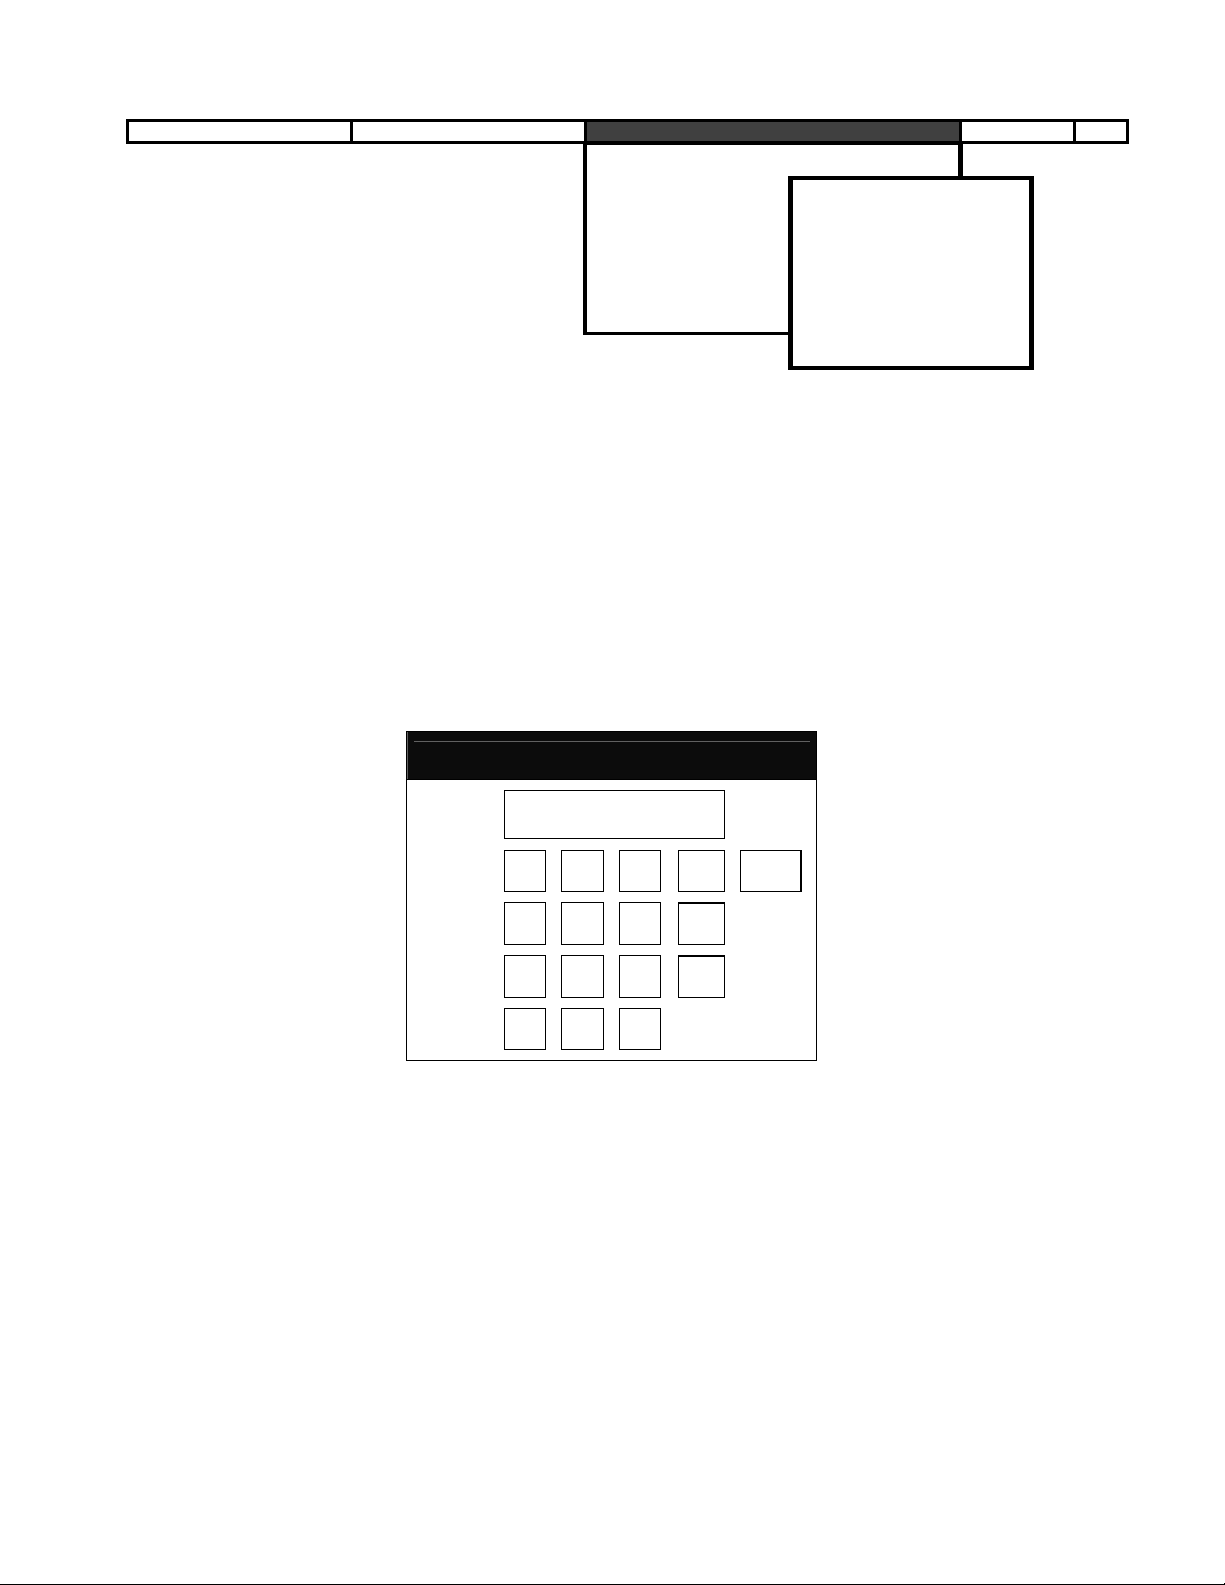
Display Scale Settings Ctrl ?
Wavelength Save Settings
Corrections None
Data Sampling Multiplier#1 (0.1200000)
Period Multiplier Offset #1
Trig Level (2%) Multiplier #2
Refer Values Offset #2
Fig. 2-1 The menu bar
Some menu options require additional information to be activated properly. In this case, a dialog box
(see Figure 2-2) appears. There you enter the setting values of your choice. Use the Arrow keys to
highlight a number and press the Enter key to select it. The selected number will appear in the upper
box. Repeat the operation until the desired number has been fully entered. Then go to “OK” and press
Enter to validate your number. You can correct a mistake by selecting the Back button () located in
the bottom right of the dialog menu. Use the Decimal button (.) to enter decimals. The Percent button
(%) gives you the flexibility to enter a value as a percent rather than a fraction. For example, you can
enter the same multiplier as 0.925 or 92.5%.
Sensitivity (V/J)
200.00
7 8 9
OK X
4 5 6 %
1 2 3 +/-
0
.
Fig. 2-2 The dialog box
2.2 Quick power and energy measurement procedure
This section applies to all 11SOLO2 versions. It will show you the fastest way of making a laser power
and energy measurement with the 11SOLO2 and a Standa power or energy detector.
The monitor automatically recognizes all the Standa power heads and energy heads of version 4 or
higher. All custom technical data required for optimum operation of the detector will be automatically
downloaded from the EEPROM in the DB-15 connector. This data includes sensitivity, model, serial
number, version, wavelength correction factors, and time response. The 11SOLO2 doesn’t support
energy detectors before version 4.
Standa Ltd. All rights reserved

11SOLO2 User’s Manual Revision 0.9 14
Version 7 energy heads
These heads have been calibrated with and without the attenuator at a chosen wavelength. When the
connector is attached, a message appears, asking you if the attenuator is in place. If the attenuator is in
place, the wavelength menu disappears. If no attenuator is in place, the wavelength menu appears. The
attenuator switch is a toggle switch. Select Ctrl / Attenuator to turn it on or off. See Appendix A for more
details.
Quick power and energy measurement procedure:
1- Install the power or energy detector head on its optical stand.
2- First, slide the connector latch to the right to unlock the connector.
3- Turn the 11SOLO2 off and connect a version 5 (or higher) power or energy detector head to
the 11SOLO2 using the PROBE INPUT JACK (see Fig. 1-2). It is recommended to turn the
11SOLO2 off before connecting a new head in order to prevent any lost of information from the
detector head EEPROM.
4- Slide the latch to the left to lock the connector into place.
5- Switch the 11SOLO2 ON using the I/O key.
6- Power heads will default the 11SOLO2 to power measurement; energy heads will default the
11SOLO2 to energy measurement. The monitor will default to autoscale. If you have a
photodiode, to obtain measurements in dBm, select Settings / Power Unit / dBm.
7- Remove the head’s protective cover.
Put the detector head into the laser beam path. Leave it there for a few minutes, until the
detector has reach an equilibrium temperature. The entire laser beam must be within the
sensor aperture. Do not exceed maximum specified densities, energies or powers. For the
most accurate measurement, spread the beam across 60% to 80% of the sensor area.
Attention: Power heads can be used with both CW and pulsed lasers.
- Energy heads can only be used with pulsed lasers.
For power heads, go to step 8. For energy heads, go to step 11.
Adjusting the zero (steps 8 to 10)
8- Block off laser radiation to the detector.
The power read by the 11SOLO2 when no laser beam is incident on the detector may not be
exactly zero. This is due to the fact that the detector is not thermally stabilized OR there is a
heat source in the field of view of the detector when you turned on the 11SOLO2.
9- To reset the zero, wait until the reading has stabilized and select Zero Offset in the
Ctrl (Control) menu. Then select Rezero. You are now ready to make an accurate
measurement. To turn the Zero Offset off, select Off, to reselect the previous offset, select
Undo.
10- To set the diode to zero, select Ctrl / Set Diode Zero, and press the Enter key. A message
appears requesting you to put the black cover on your photodiode and press the Enter key
after you have done so. The 11SOLO2 passes through all the scales to determine the zero
diode for each scale. The message “Diode Zero Done” appears when the 11SOLO2 has
determined the zero diode.
Notes:
Standa Ltd. All rights reserved

11SOLO2 User’s Manual Revision 0.9 15
• Refer to specific power detector documentation for complete installation and operating
instructions.
• The power detectors are thermal sensors sensitive to temperature variations.
For high-precision measurements, it is recommended to:
• Allow the power detector temperature to stabilize before zeroing the 11SOLO2.
• Do not touch the detector head when handling the power detector. Touch only the stand.
• Avoid forced airflow or drafts around the detector.
11- Apply the laser beam to the detector head.
12- The laser beam average power or energy will be displayed in three ways for your
convenience:
a. Digitally for real time measure.
b. On a digital needle for an easy visualization of the laser beam power variation
during laser fine-tuning.
c. On a histogram to allow the laser beam’s long-term stability to be evaluated.
Standa Ltd. All rights reserved
11SOLO2 User’s Manual Revision 0.9 16
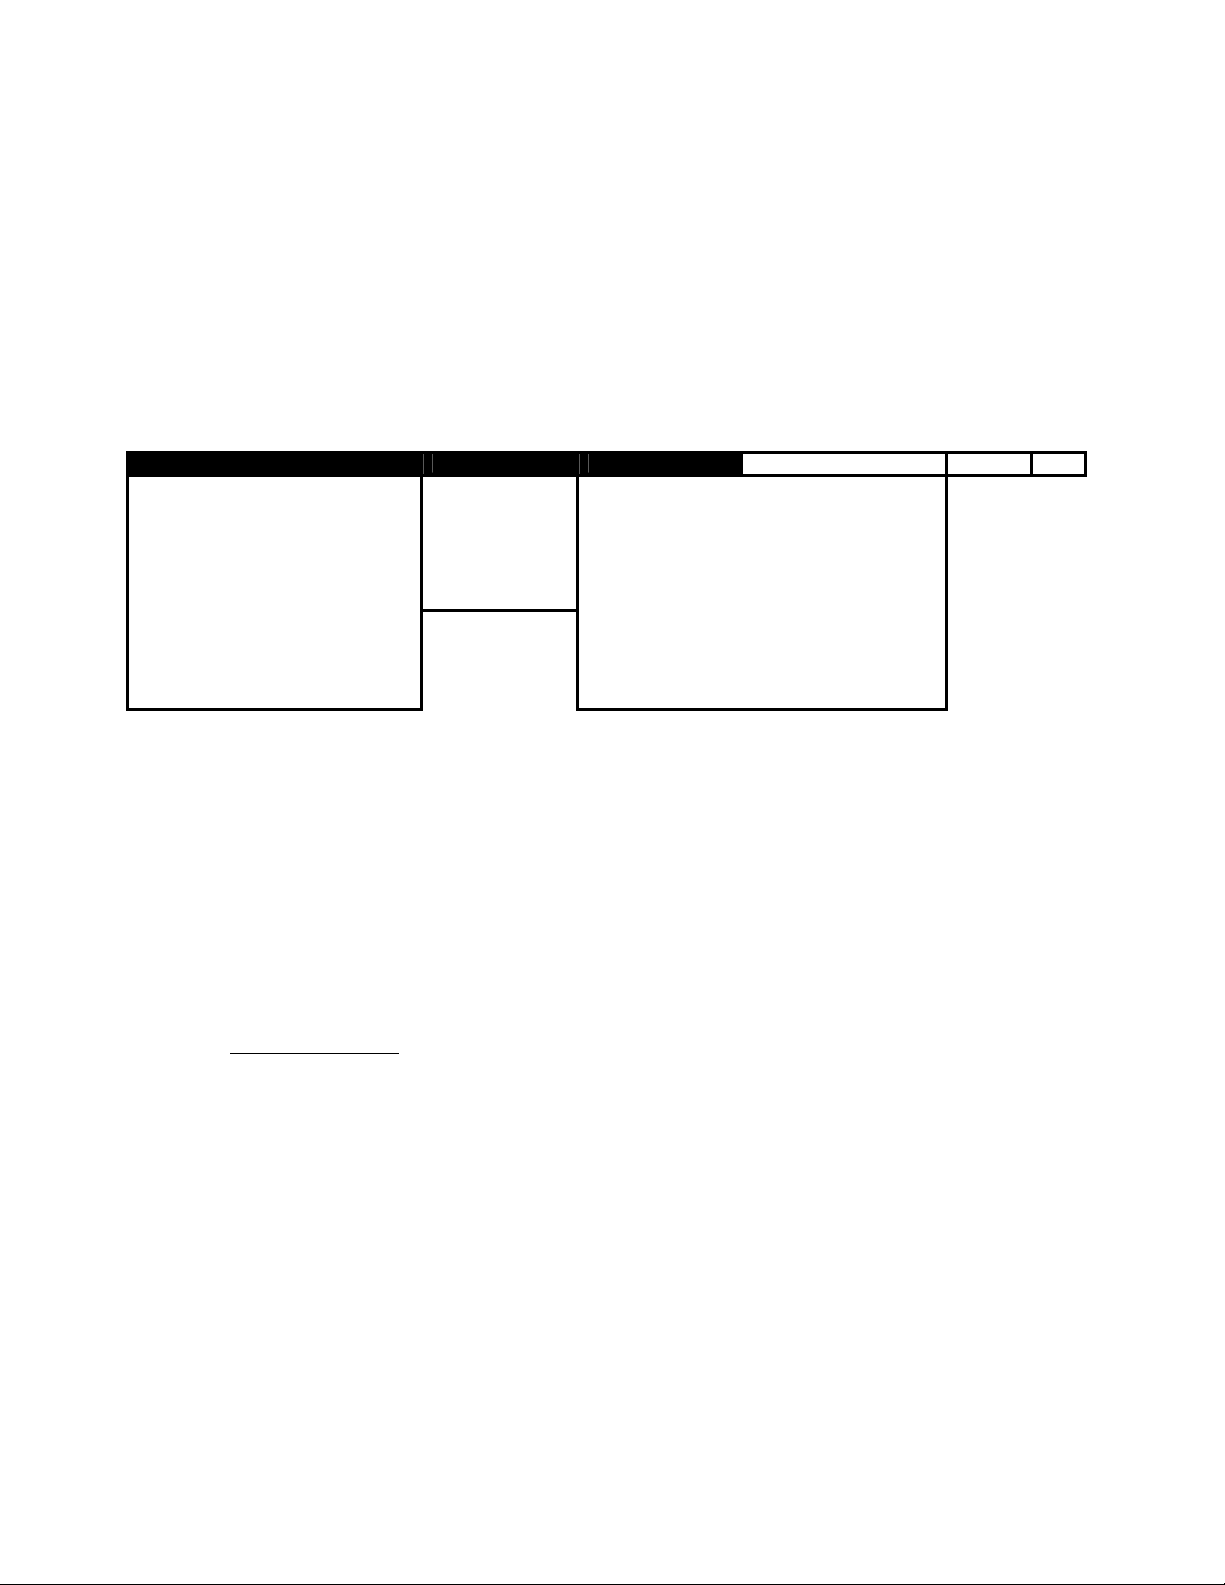
2.3 Description of the top level 11SOLO2 menus
This section describes in detail the first group of menus essential to the 11SOLO2 operation. Refer to
Figure 2-3 for a schematic view of the menu structure. The menus differ depending on the type of head
that is plugged in. The display menu lets you view your measurement in various ways. The scale menu
allows you to fix a specific measurement scale instead of autoscaling. Use the settings menu during
setup to set the best parameters for the measurement task at hand. They provide the flexibility to
accommodate a wide variety of measurement conditions. The more active controls you are likely to use
during your measurements are in the CTRL menu. They are described in Section 2.4.
Fig. 2-3 View of the first group of 11SOLO2 menus
2.3.1 Displays
The various displays offered by the 11SOLO2 allow you to quickly view your measurement in several
different ways. You will appreciate the easy-to-view high resolution 58x38 mm graphic, the LCD display
and the backlight for use in poor ambient light conditions. The display menu includes five options, (see
Figure 2-3) that allow you to select the best way to display the measurement according to your specific
needs. You can switch from one option to another without interfering with the measurements.
2.3.1.1 Real time display
This display is automatically selected when a head is connected to the 11SOLO2. The top and bottom of
the screen shows important settings so you see the conditions as well as the measurement. (see Figure
2-4). The Power or Energy Digital display is presented in giant format for easy reading in all conditions.
Directly below, the Bargraph display, as wide as the screen, presents the measurement in an analog
format, very useful for rapidly varying values. On the upper left part of the screen, you can read the Type
of Head and, under the Bargraph, the current Scale. At the bottom of the screen the leftmost box
contains the actual power or energy received by the head before any correction factors are applied. The
center box gives the resolution and the rightmost box displays the wavelength. The resolution is the
smallest increment that the current value may change on a given scale. The wavelength value tells you
what NIST-based calibration factor is active. You can find the factors on the Calibration and the Personal
wavelength correction™ certificates that are shipped with your detector.
Display Scale Settings Ctrl ?
Real Time View File Auto Wavelength Save Settings
Histogram Fluence Zoom In Corrections Load Settings
Line Plot Avg Power Zoom Out Data Sampling Power Unit
Statistics Zoom… Period Multiplier Communication
Peak Power Tuning Needle Trig Level (2.0%) Fluence
Status Scale Refer Values Peak Power
Standa Ltd. All rights reserved

11SOLO2 User’s Manual Revision 0.9 17
Display Scale Settings Ctrl ?
UP19K-H5-15S
0.00 mW 30.0 mW
15.20 mW
Head:15.20 mW Res:14.65 μW @ 1064 nm
Fig. 2-4 Real time display
With a 11SOLO2, you can also choose either the high resolution mode for the most significant digits
available or the standard resolution to filter out unimportant fluctuations in measurement. This is a setting
in the control (Ctrl) menu of the 11SOLO2.
2.3.1.2 Histogram display
The histogram option gives a quick look at the laser beam’s long-term stability and trends. The histogram
adds new data points at a rate of 3 Hz and is dynamically scrolled to the left for each new point as soon
as it reaches the right side of the screen.
Display Scale Settings Ctrl ?
Real Time View File
Histogram Fluence
Line Plot Avg Power
Statistics Zoom…
Peak Power Tuning Needle
Status
Fig. 2-5 Display options menu
2.3.1.3 Line Plot display
The line plot also shows the trends in your data. Actual values are sometimes easier to read than with
the Histogram.
Standa Ltd. All rights reserved
11SOLO2 User’s Manual Revision 0.9 18
2.3.1.4 Statistics display
In Statistics display mode, the statistical analysis screen pops-up on top of the Main display. This screen
(Figure 2-6) gives a complete statistical analysis of the measured data. See section 2.3.3.3 for a detailed
description of each item. Select the Start button to start or restart the data sampling and statistical
calculations. Use the Stop button to stop the data sampling and statistics before you reach the end of
the selected sampling time. (See Data Sampling section 2.3.3.3.) The last statistical values calculated
remain on screen so you can view them later, even if you close and reopen the Statistics window. To set
the data to zero, select Reset. To restart the data sampling, select Start. The Close button closes the
statistics window so you can see the Main display again but does not interfere with the statistics being
computed. The data sampling and statistical calculations continue with this window closed or open, and
no matter what display you select. You can open and close the statistics display window to check on the
statistics as often as you like.
The values in this display provide an additional digit of resolution to allow you to benefit from the
improved precision of large samples. You must understand your sample size well enough to know if this
additional digit is significant.
Statistics
Current Value: 0.9512 W Close
Maximum Value: 0.9519 W Start
Minimum Value: 0.9505 W Stop
Average Value: 0.95118 W Reset
Std deviation: 0.9135 mW Cancel
RMS Stability: 0.096% period
PTP Stability: 0.147%
Time: 4/10 Sec
Fig. 2-6 Statistics display
2.3.1.5 Peak Power Display
In Peak Power display mode, the pulse energy measurement of the energy mode is converted to its peak
power (watts) and is inversely proportional to the pulse length. This function is active only in energy
mode. The user must enter the pulse width, in picosecond to millisecond units using Settings/Peak
Power in the Settings menu.
Standa Ltd. All rights reserved

11SOLO2 User’s Manual Revision 0.9 19
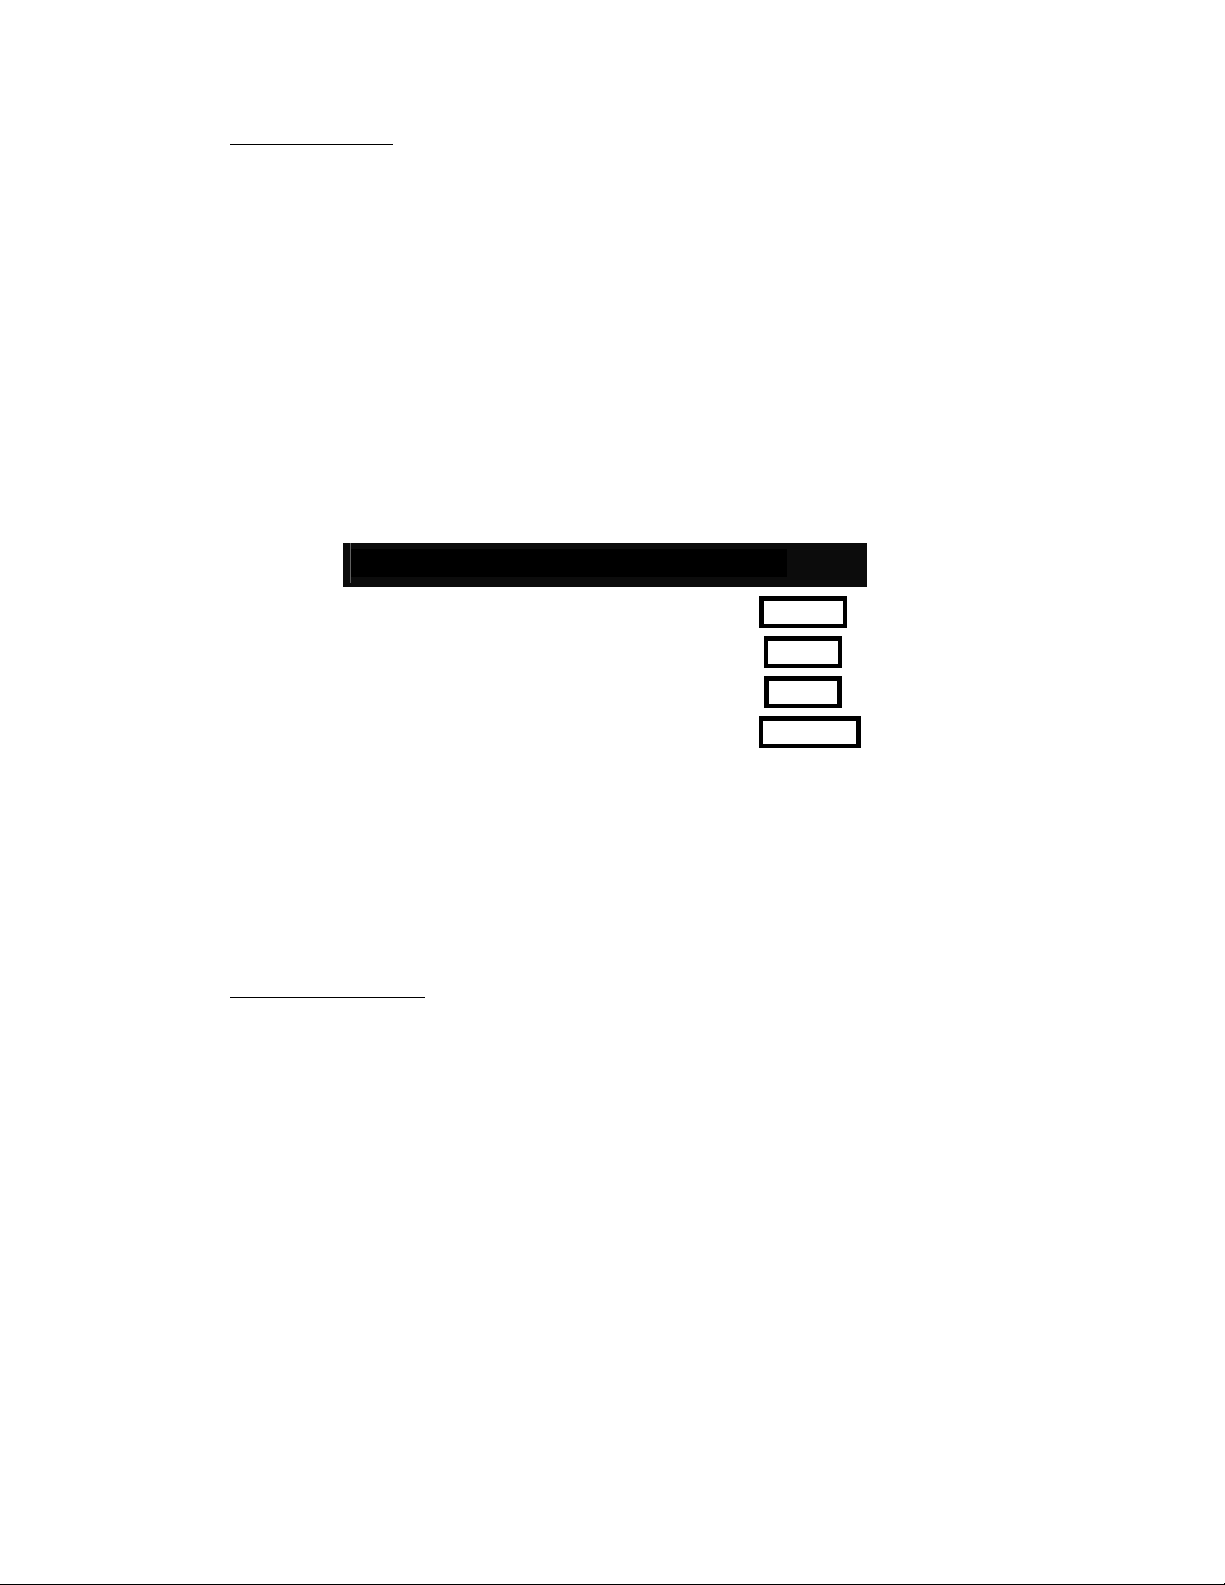
2.3.1.6 Status display
The status display mode shows all the major adjustable parameters currently active for the detector head
in one convenient place, (see Figure 2-7).
Fig. 2-7 Status display
2.3.1.7 Avg Display
Fig. 2-8 Wattmeter data sampling menu
For Power Detectors:
In the Avg display mode, the power measurement is the average value defined in the data
sampling menu. You can change your data sampling to your desired average time parameters.
Statistics always run in the background in this mode. This mode is a real time average of a group
of data defined in the data sampling setting. For optimum averaging, when measuring the
average power of a pulsing laser, it is preferable to use a sample period that is a multiple of your
laser repetition rate. For instance, if you are running at 1 Hz, use a sample period of 1,2,3 etc…
seconds. If it is at 1.5 Hz, use 3, 6, 9 etc… seconds, as the sample period. You don’t need to
change the sample Rate of 10 Hz in this mode. Set the scale higher then your maximum
unfiltered measurement because. Take note that if one data point is out of the current scale, the
resulting period average will be OUT.
Standa Ltd. All rights reserved
Table of contents
Other Standa Measuring Instrument manuals

Popular Measuring Instrument manuals by other brands

Powerfix
Powerfix KH 3322 operating instructions

PRECISION DIGITAL
PRECISION DIGITAL Protex Pro PD6801 instruction manual

ITT Controls
ITT Controls 002-099-4116 Instruciton manual

Interscience
Interscience COMPACTGC instruction manual

Veris Industries
Veris Industries E30 Series installation guide

DHC
DHC BT1000 HD owner's manual


