Time domain PulsON 440 User manual


2DRAFT P440 Data Sheet / User Guide
Copyright
All rights reserved. Time Domain®2001-2015. All rights reserved.
Trademarks
Time Domain®, PulsON®, and “PulsON Triangle” logo are registered trademarks of Time Domain. Microsoft®and
Windows Vista®, Windows 7®, Windows 8®, and Windows 10® are registered trademarks of Microsoft Corporation.
MATLAB® is a registered trademark of MathWorks, Inc. Any trademarks, trade names, service marks or service names
owned or registered by any other company and used in this manual are the property of its respective company.
Rights
Rights to use this documentation are set forth in the PulsON Products Terms and Conditions of Sale.
Document Information
Time Domain reserves the right to change product specifications without notice. Any changes to the functionality or
specifications will be issued as specific errata sheets or will be incorporated in new versions of this document. The latest
version of this document and future documents can be found on the Time Domain website. The name/number and date of
this document can be found on the left side of the cover page.
Regulatory Approvals
The P440, as supplied by Time Domain, has not yet been certified for use in any particular geographic region by the
appropriate regulatory body governing radio emissions in that region. However, other members of the P400 series of
devices have received such certification for use in the United States and the P440 is currently in the process of being tested
for certification in the US. This certification is expected to be received later in 2015. This will be followed by a similar
effort in Europe in 2016.
All final products developed by the user which incorporate the P440 must be approved by the relevant authority governing
radio emissions for the target market country(s). The User bears all responsibility for obtaining such approval(s).

P440 Data Sheet / User Guide DRAFT 3
Table of Contents
1SUMMARY................................................................................................................... 5
2 P440 SOFTWARE ....................................................................................................... 7
2.1 P440 Embedded Software.......................................................................................................7
2.2 Application Programming Interfaces (APIs).........................................................................7
2.3 Graphical User Interfaces (GUIs) and Sample Code............................................................8
2.4 APIs and GUIs as Development Tools ..................................................................................9
2.4.1 Ranging Measurement with RangeNet................................................................................................9
2.4.2 Networking with RangeNet ................................................................................................................13
2.4.3 Monostatic Radar with MRM RET......................................................................................................16
2.4.4 Bistatic Radar and Propagation with CAT (Channel Analysis Tool)...................................................19
2.5 Networking: RangeNet vs. RangeNet Lite...........................................................................20
2.6 Software Support...................................................................................................................21
3HARDWARE BLOCK DIAGRAM................................................................................22
4ELECTRICAL INTERFACES......................................................................................24
4.1 Connecting to the P440.........................................................................................................25
4.2 Connector Pinouts ................................................................................................................25
4.3 Powering and Grounding the Unit .......................................................................................29
4.3.1 Powering the P440 through the USB Power jack vs Locking & Mezzanine connectors.....................29
4.3.2 Reverse polarity protection ................................................................................................................29
4.3.3 Two means of powering the P440......................................................................................................29
4.3.4 Chassis Ground.................................................................................................................................30
4.3.5 Fused_Ground and Digital_Ground...................................................................................................30
4.3.6 P440 Power requirements .................................................................................................................30
4.4 Host to P440 Interface Options ............................................................................................31
4.4.1 USB 2.0 High Speed Device..............................................................................................................32
4.4.2 User Serial.........................................................................................................................................32
4.4.3 SPI.....................................................................................................................................................32
4.4.4 Ethernet and IP Addressing...............................................................................................................35
4.4.5 CAN...................................................................................................................................................35
4.5 GPIO........................................................................................................................................35
4.6 Antenna Ports........................................................................................................................36
4.7 RF Transmit and Receive Characteristics ..........................................................................37

4DRAFT P440 Data Sheet / User Guide
4.8 Optional Power Amplifier..................................................................................................... 37
4.9 Indicator Lights ..................................................................................................................... 38
4.10 Heat Management ................................................................................................................. 39
4.11Accessories........................................................................................................................... 39
4.11.1 Enclosure ......................................................................................................................................40
4.11.2 Power Supply/Charger with Battery and cables. ...........................................................................40
5MECHANICAL INTERFACE.......................................................................................43
6 TECHNICAL SPECIFICATIONS.................................................................................47
6.1 Summary of Key Performance Parameters........................................................................ 47
6.2 Maximum Operating Range of a P440 Radio ..................................................................... 50
6.3 Range Measurement Rate.................................................................................................... 52
6.4 Precision Range Measurement Precision, Accuracy, and Bias....................................... 52
6.4.1 Precision and Accuracy in LOS conditions.........................................................................................52
6.4.2 Precision and Accuracy in NLOS conditions......................................................................................53
6.4.3 Bias and Calibration...........................................................................................................................53
6.5 CRE Range Measurement Precision and Accuracy .......................................................... 54
6.6 Data Communications Rate and Throughput .................................................................... 54
6.7 Operating Range of P440 Radar.......................................................................................... 55
6.8 P440 Version Differences..................................................................................................... 55
7BROADSPEC ANTENNA...........................................................................................56
8 REGULATORY COMPLIANCE ..................................................................................57
8.1 Compliance with the U.S. FCC regulations ........................................................................ 57
8.2 Compliance with the EU ETSI standards............................................................................ 59
9IMPORT/EXPORT CONSIDERATIONS.....................................................................60
10 CONFIGURATION AND ORDERING INFORMATION...............................................61

P440 Data Sheet / User Guide DRAFT 5
1 Summary
The PulsON 440 (P440) module is an Ultra Wideband (UWB) radio transceiver operating between
3.1 and 4.8 GHz and provides the following functions:
It uses Two-Way Time-of-Flight (TW-TOF) ranging to measure the distance between two or
more P440s. These measurements have an accuracy of 2 cm and are provided at rates up to
125 Hz.
It communicates data between two or more P440s.
It can operate as a monostatic, bistatic, or multistatic radar.
It can provide all four functions (range determination, data transfer, monostatic radar, and
multistatic radar) simultaneously.
Operates with very low power transmissions (~50uW)
It is provided with a network optimized for TW-TOF measurement. This network can be
operated using either the ALOHA (randomized) or TDMA (Time Division Multiple Access)
protocols.
It supports 11 independent communications channels thus allowing operation as a CDMA
(Code Division Multiple Access) network. Many more channels can be added.
It is interoperable with Time Domain’s earlier generation equipment (P400, P410, and P412).
The hardware is designed to operate over the full industrial temperature range (-40°C to
+85°C) as well as operate in high shock and high vibration environments.
The RF emissions are compliant with both the United States Federal Communications
Commission (FCC) Part 15 regulations and the European Union ETSI EN 302 065 standard
mask.
The P440, like all of the members of the P400 family, is a coherent radio transceiver. This means that
the energy in each transmitted pulse can be summed to increase the Signal-to-Noise Ratio (SNR) of
received transmissions. Each time the number of pulses sent is doubled, the SNR of the received
signal will double (increase by 3 dB). This comes at the cost of doubling the amount of time required
to complete a full transmission. The transmission strength is not increased, rather more energy is
summed to improve reception. This applies to all transmissions regardless of whether the
transmission is intended for ranging, radar, or communications.
The user controls and monitors the P440 through an Application Programming Interface (API) over
USB, Serial, SPI, Ethernet or CAN connections. USB driver support is provided for Windows Vista
32/64, Windows 7 32/64, Windows 8 32/64, and Windows 10 operating systems. Unix and OS X
systems do not need a special driver for USB. The P440 automatically appears as a serial device.
The API provides all the commands and capabilities required by a user to design a network tailored
for operating multiple P440s as ranging radios or radar sensors.
To assist the user in demonstrating the performance of the P440, either as a ranging radio or as a radar
sensor, Time Domain also provides PC-based Graphical User Interfaces (GUIs) which exercise all of
the API commands and offer the following capabilities:
They provide programmers with a visual example of a host application which interfaces to
the P440 through the API.
They allow users to evaluate ranging and communications performance.

6DRAFT P440 Data Sheet / User Guide
They allow users to evaluate the radar performance through use of a sample Motion Filter,
sample Detection Processor, and a graphical display of raw and processed radar scans.
They allow system analysts to visualize, collect, and log raw ranging and radar data such that
it is possible to develop algorithms/strategies optimized for the chosen product application.
They allow users to operate multiple P440s to form a network of ranging radios.
Time Domain also provides sample C and MATLAB code for demonstrating the interface and
performance of the hardware.
The objective of providing the GUIs, sample C and sample MATLAB code is to supply programmers
with several example interfaces and implementations which the user may then replace or tailor with
custom code optimized for their particular needs and applications.
This technology has been used in a wide variety of applications. For example, it has been used:
To report safe distances between rail vehicles
To allow robots to follow leaders at a safe distance
To provide robots with location knowledge
To guide drones as they fly
To precisely locate vehicles in tunnels and mines
To maintain safe distances between construction vehicles
To measure the respiration rate of patients
To locate and track people as they move through an area
To precisely measure the length of long structures
To precisely measure the location of specific features in buildings
To track forklifts as they move through an area
For various doctoral and post-doctoral research projects
To teach university undergraduates about RF, radar, and signal processing
This document describes the P440 hardware and software. This discussion is subdivided into the
following subsections.
Section 2 P440 Software
Section 3 Hardware Block Diagram
Section 4 Electrical Interfaces
Section 5 Mechanical Interface
Section 6 Technical Specifications
Section 7 Broadspec Antenna
Section 8 Regulatory Compliance
Section 9 Import/Export Considerations
Section 10 Configuration and Ordering Information
Additional information including all of the documents referenced in this section can be found on the
web at www.timedomain.com. This includes: the API, software manuals, application notes, white
papers, examples, published papers, sample C code, sample MATLAB code, and more.

P440 Data Sheet / User Guide DRAFT 7
2 P440 Software
The P440 software consists of five elements:
Embedded software operating on the P440 module
The Application Programming Interface (API) which defines the interface between the P440
and a Host processor
GUIs provided to (1) illustrate operation of the P440 and (2) provide an analytical tool for
characterizing performance
Sample C and MATLAB code to assist the user in developing custom applications
Network support to enable systems of P440s to range and communicate efficiently
In addition, Time Domain is committed to periodically adding new features and capabilities through
software upgrades.
2.1 P440 Embedded Software
The P440 is a microprocessor-based UWB platform. The onboard processor has three principal
functions:
It is responsible for transmitting and receiving UWB pulses.
It handles all communications with the user’s Host processor (typically a PC or single-board
computer). The format of these communications is defined by a set of three APIs, each
tailored to a specific application. The user has a choice of communicating with the P440 over
5 different physical interfaces: Ethernet, USB, SPI, Serial, and CAN.
When instructed to act as a network, the onboard processor:
oAssumes all responsibilities for scheduling communications and range requests
oProvides the Host with status update information
oHandles supervisory commands sent by the Host
This increases the ranging update rate and significantly offloads the Host processor.
For details on interfaces, refer to:
320-087 Using the USB and Serial Interfaces
2.2 Application Programming Interfaces (APIs)
There are three different APIs:
Range measurement and network commands are defined in the document
320-0313 RangeNet API Specification

8DRAFT P440 Data Sheet / User Guide
Monostatic Radar commands are defined in the document
320-0298 Monostatic Radar API Specification
Bistatic radar and communications channel modeling commands are defined in the document
330-0305 Channel Analysis Tool API Specification
While useful, this separation is artificial in that the embedded software in the P440 can handle all
three APIs. If the embedded code in the P440 is updated, then all three APIs will be updated as well.
Furthermore, the user is free to develop applications that incorporate commands from any or all of
these APIs. For example, this ability allows the user to create ranging measurement networks that
incorporate bistatic and multistatic radar and also communicate data.
The high-level features of the APIs are discussed in Section 2.4 –APIs and GUIs as Development
Tools.
2.3 Graphical User Interfaces (GUIs) and Sample Code
Mastering all of the commands in an API (or in this case, a set of three APIs) can be a time-
consuming task, especially when the APIs have a rich command set. To accelerate this learning
process, Time Domain provides three example Graphical User Interfaces (GUIs). These GUIs
operate on a PC and exercise all of the API commands. They also display received data and allow the
user to log all received data or API messages sent or received by the Host. Each GUI focuses on one
particular API:
RangeNet RET is used to demonstrate simple point-to-point ranging and communications
under the control of a host processor as well as operation as a full ranging network under
control of the P440.
MRM RET is used to demonstrate monostatic radar.
Channel Analysis Tool (CAT) is used to demonstrate either (a) bistatic and multistatic radar
or (b) communications channel propagation analysis.
In addition, Time Domain also provides sample C and sample MATLAB code for each application
area. The sample C code enables embedded programmers to quickly interface to the P440. The
sample MATLAB code enables system analysts to quickly construct experiments to investigate and
evaluate performance. The sample code also includes parsers for extracting information from the
logfiles.
The sample code includes the following:
Ranging and Network (RangeNet)
150-0117 –RangeNet Sample C Applications
150-0123 –RangeNet Localization Demo (MATLAB-based executable)
150-0124 –Localization Demo (command line based executable)
150-0118 –RangeNet Sample MATLAB Applications
150-0103 –Ranging Sample C Applications
150-0104 –Ranging Sample MATLAB Applications

P440 Data Sheet / User Guide DRAFT 9
Monostatic Radar
150-0107 MRM Sample C Application
150-0108 MRM Sample MATLAB Applications
Channel Propagation Analysis
CATCIR Delivery Files
Each of the GUIs is provided with a User Guide and a Quick Start Guide that illustrate operation of
the equipment. Within 30 minutes of receiving the equipment, the user will be able to measure range,
operate a network, operate as a monostatic radar, or capture bistatic radar scans and RF
communications channel waveforms. A list of the User Guide and Quick Start Guide documentation
is provided below:
Ranging and Network (RangeNet):
o320-0314 RangeNet Quick Start Guide
o320-0320 RangeNet User Guide
Monostatic Radar:
o320-0301 MRM Quick Start Guide
o320-0300 MRM User Guide
Bistatic / Multistatic Radar and Channel Analysis:
o320-0304 CAT Quick Start Guide
o320-0303 CAT User Guide
2.4 APIs and GUIs as Development Tools
This section provides a high level summary of the APIs and discusses how the GUIs can be used as a
development tool.
In general, the GUIs perform as one would expect. They allow the user to configure the P440s,
initiate range and radar requests, move in and out of a network, move to and from different sleep
states, measure the P440 temperature, display status, hardware and software version numbers as well
as other useful information. In addition, they allow the user to display and log collected data as well
as all communications between the Host and the P440. The radar GUI also bandpasses the received
data and provides motion filter and detection filter processing.
2.4.1 Ranging Measurement with RangeNet
The RangeNet API allows the user to configure the P440 and take range measurements. In fact, it
supports three different forms of range measurements, all of which will be described in this section.
But the types of range measurements taken are less important than the technique used to take the
underlying data. The P440 uses a bank of receivers to digitize the received signal such that it is
possible to produce an image of the received waveform. This image is produced with a resolution of
61 ps, which is twice the Nyquist rate. (An example is shown in Figure 1.)
10 DRAFT P440 Data Sheet / User Guide
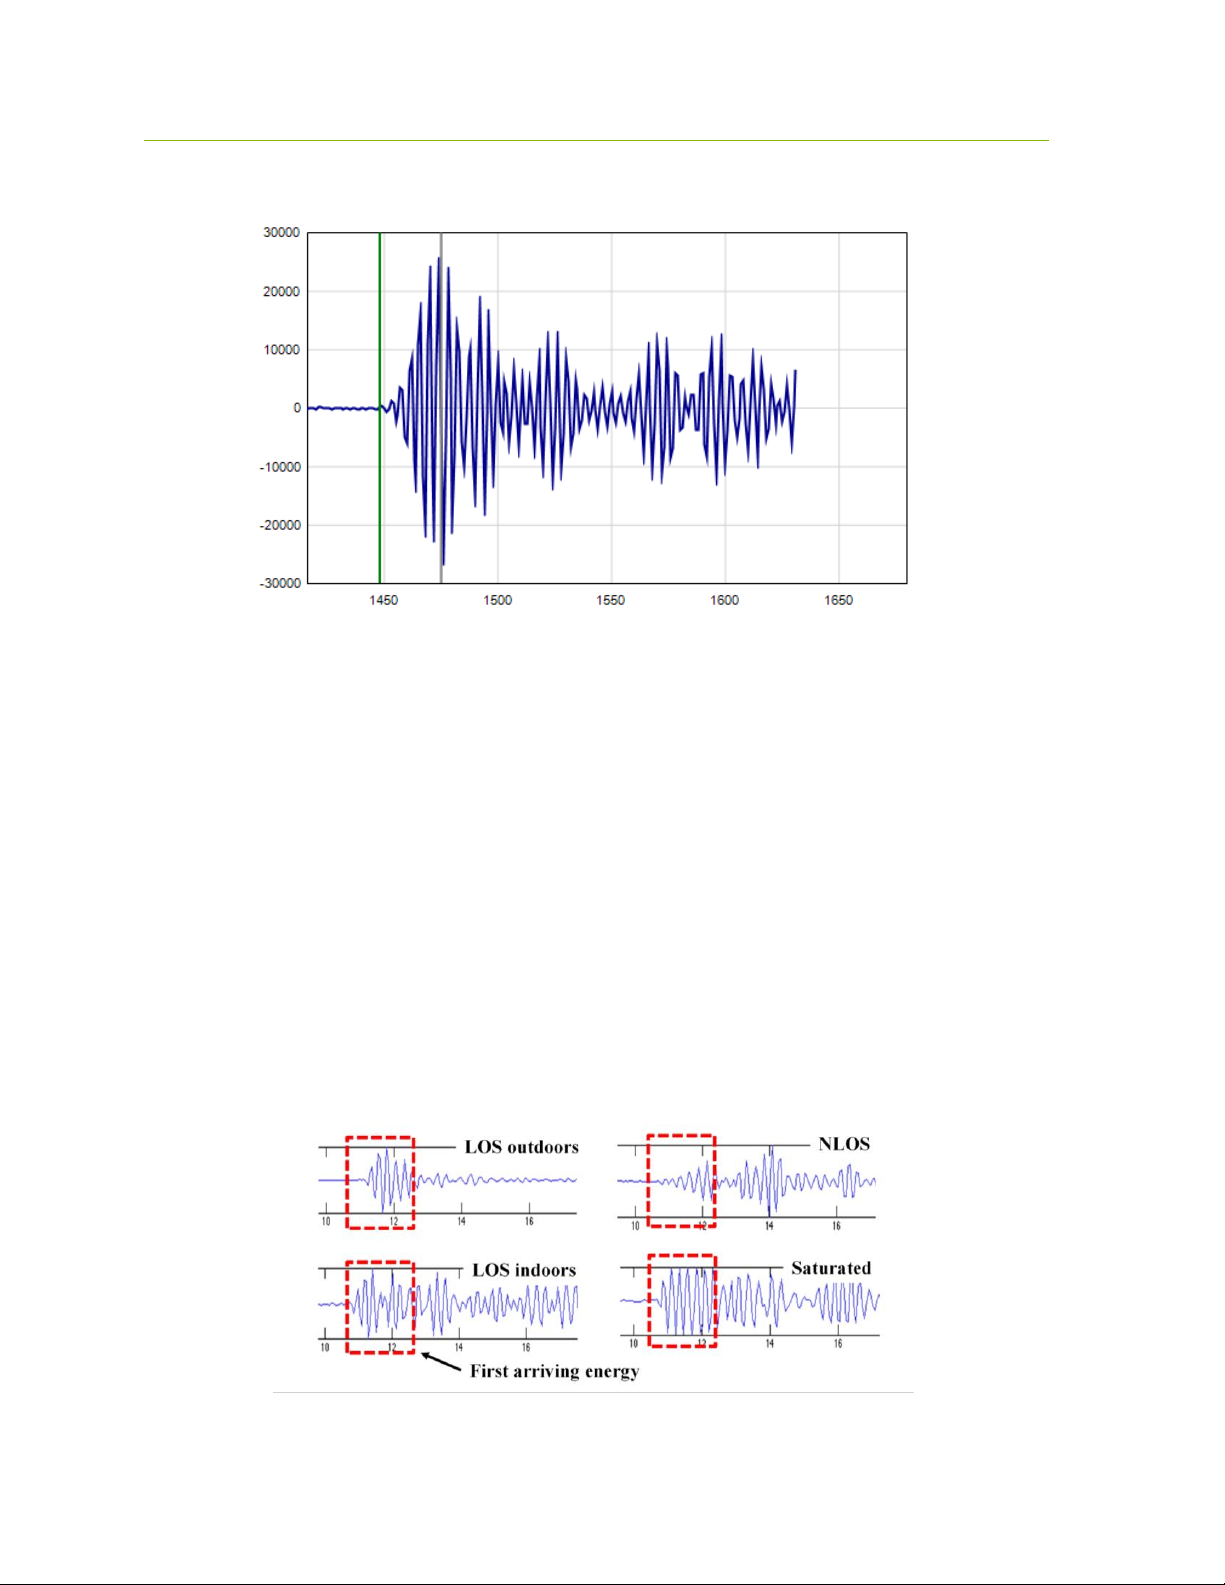
Fig.1: A typical received waveform: signal magnitude (relative strength) vs time (increments of
61ps)
This is a powerful capability for several reasons:
Oversampling enables correlation processing, thereby producing reliable sub-centimeter
range estimates.
By analyzing the shape of the received waveform it is possible to determine importation
characteristics of the channel such as (a) whether or not the signal is clear or non-line-of -
sight (NLOS), (b) determine if the signal is in compression, and (c) whether or not the signal
is corrupted by multipath or Fresnel effects. This is illustrated in Figure 2.
It is possible to measure the signal strength of the first arriving pulse as opposed to the
strength of the largest multipath signal.
It is possible to measure the background noise level. That, in conjunction with the signal
strength measurement, allows the measurement of the received SNR.
It is possible to characterize the received waveform and produce an error estimate of the
range measurement estimate.
Fig.2: Received waveforms captured at 61ps intervals (2x Nyquist) in a variety of
environments

P440 Data Sheet / User Guide DRAFT 11
This underlying capability allows the generation of the following three different types of range
measurements:
Precision Range Measurements (PRM) are taken using the TW-TOF ranging technique. These
readings typically have high accuracy and are provided with estimates of range error as well as flags
that warn of possible errors. The user can use these range error estimates to drive a Kalman Filter.
The flags can be used to disregard inaccurate readings.
Coarse Range Estimates (CRE) are analogous to RSSI (received signal strength indication) range
estimates produced by continuous wave RF ranging systems in that they relate the strength of the
received signal to range. They are different in two important ways. First, the signal strength reported
is based on the strength of the first arriving energy and not on the strongest overall energy. This
ensures that large signals produced by constructive multipath do not introduce false readings.
Second, the signal strength reported is automatically calibrated based on the last successful Precision
Range Measurement.
Echo Last Range (ELR) measurements are Precision Range Measurements which have been taken
between two other radios in the system. In other words, any time a unit takes a PRM it will broadcast
the last range measurement to any other radios in the area. For example, if Unit A measures the
distance between Unit A and Unit B, it will broadcast this range measurement to Units C, D, E, etc.,
whenever it next initiates a range measurement. This is an alternate way of automatically distributing
range information through a system.
Finally, the P440 uses the API to make the range measurements, error flags, range error estimates,
signal strength measurements, measurements of background noise, and waveform measurements
available to the Host processor.
The RangeNet GUI exercises each of the API commands, thereby allowing the user to configure the
unit and take range measurements. But the GUI adds an extra level of system software in that it will
allow the user to:
Capture, display to the screen, and log waveforms to disk. Figure 3 illustrates a
representative waveform as displayed by the GUI.
Request a single range measurement, a fixed number of measurements, or a continuous series
of range measurements.
Display the signal strength, noise, and SNR of the received signal.
Display quality metrics that provide a warning if the reading is suspect.
Calculate performance statistics. For example, if the user requests a finite number of ranges,
the GUI will compute the range success rate, the average range, the standard deviation of the
range measurements, the average SNR of the readings, and the standard deviation of the
SNR. These statistics are valuable for determining the quality of service the user can expect.
The system will also filter the received readings using the quality metrics and provide the
same statistics.
Determine if there are interference sources in the area.
Recalibrate a given link such that the bias or offset inherent in a range measurement can be
compensated.
Allow the user to easily enter and transmit data.
Allow the user to receive and display data.
Log all messages exchanged between the host and connected P440.

12 DRAFT P440 Data Sheet / User Guide
Display range measurements taken between other units in the area for which the connected
P440 is not a direct participant.
Fig. 3: Typical waveform as displayed by the GUI
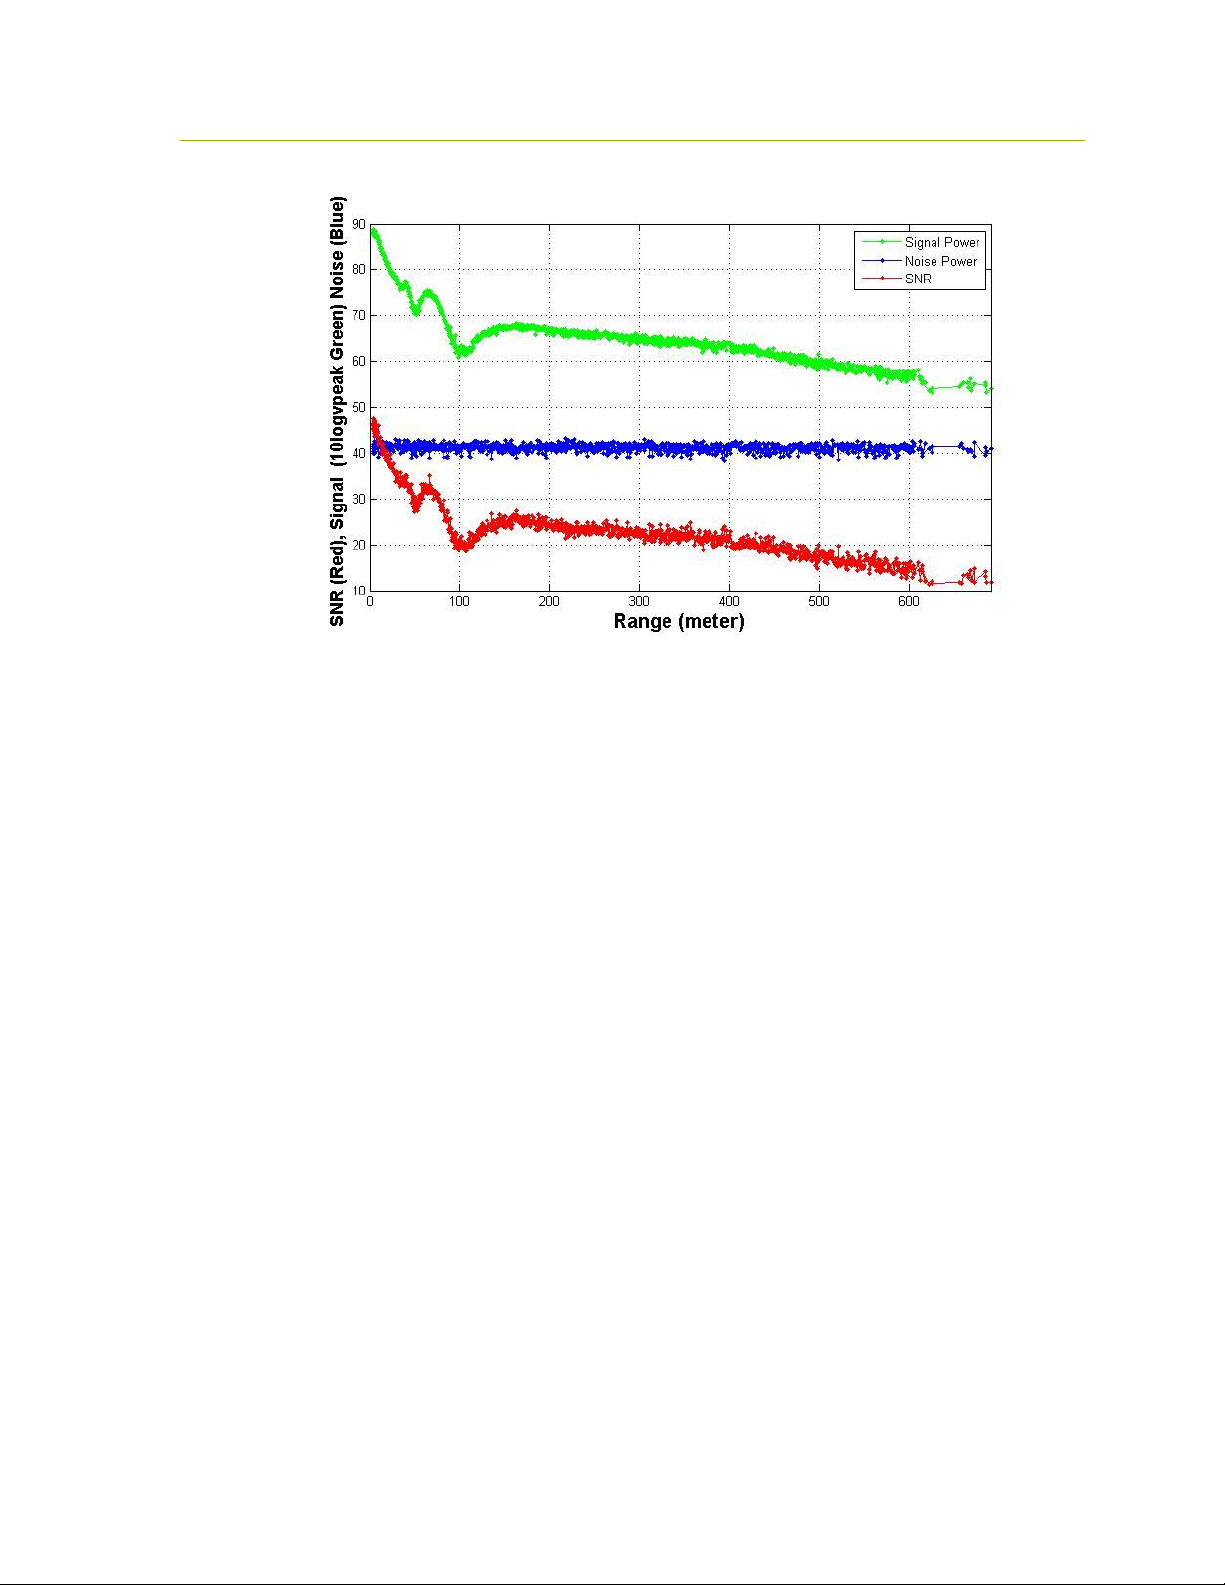
The ability to log data also allows the user to plot performance as a function of range. This is an
excellent tool for evaluating signal propagation in a given area. For example, the information shown
in Figure 4 was collected as the distance between two units was increased. Basically, one unit was
stationary while the second unit was slowly driven away. Figure 4 shows a plot of the Signal, Noise,
and SNR as a function of separation distance. In this figure one can observe several items of note:
There is a Fresnel cancellation at 40, 60, and 100 meters.
There is a Fresnel enhancement at ranges greater than 120 meters.
The noise floor is constant; therefore there are no significant interference sources in the
vicinity.
P440 Data Sheet / User Guide DRAFT 13
Fig. 4: Signal (green), Noise (blue), and SNR (red) of a link as function of separation distance.
(Note the Fresnel cancellation and enhancement.)
2.4.2 Networking with RangeNet
Operating a system that consists of only two units is very simple. Operating with more than two units
starts to introduce significant complexity. For example:
The number of radios in the system may vary with time. Units that enter the system need to
be discovered. Units that exit the system need to be removed from the network.
There needs to be a way to prevent units from interfering with each other.
Not all units need to behave the same way. Some units might initiate and respond to range
measurement requests. Some might only initiate requests. Some might only respond. Some
units might only communicate with a subset of the system.
The RangeNet API allows the user to define a network and to define the behavior of the radios in the
system. Operation of the network is controlled by the P440. In particular, the P440 is responsible for
scheduling range requests, maintaining all of the neighbors in a database, and passing data between
the Host and the network. The Host computer function is thereby limited to monitoring and
supervision, thus significantly offloading its responsibilities.
The RangeNet API provides the user with tools to define and monitor the network. For example:
A network can be defined using two different time-sharing protocols: ALOHA (randomized)
or TDMA (Time Division Multiple Access).
If the ALOHA protocol is used, then the average interval and the random variation of that
interval can both be defined. The average interval can be manually or automatically throttled
based on the number of units in the system. Radio behavior can be limited on a per unit basis
such that some units initiate and respond to range requests, while others initiate-only or
respond-only. In addition, some units can be instructed to limit their interactions to a subset
of the network members. While most ALOHA networks have an efficiency of 19%, the
14 DRAFT P440 Data Sheet / User Guide
efficiency of this ALOHA network is approximately 38%, making it equivalent to the
performance of a Slotted ALOHA system.
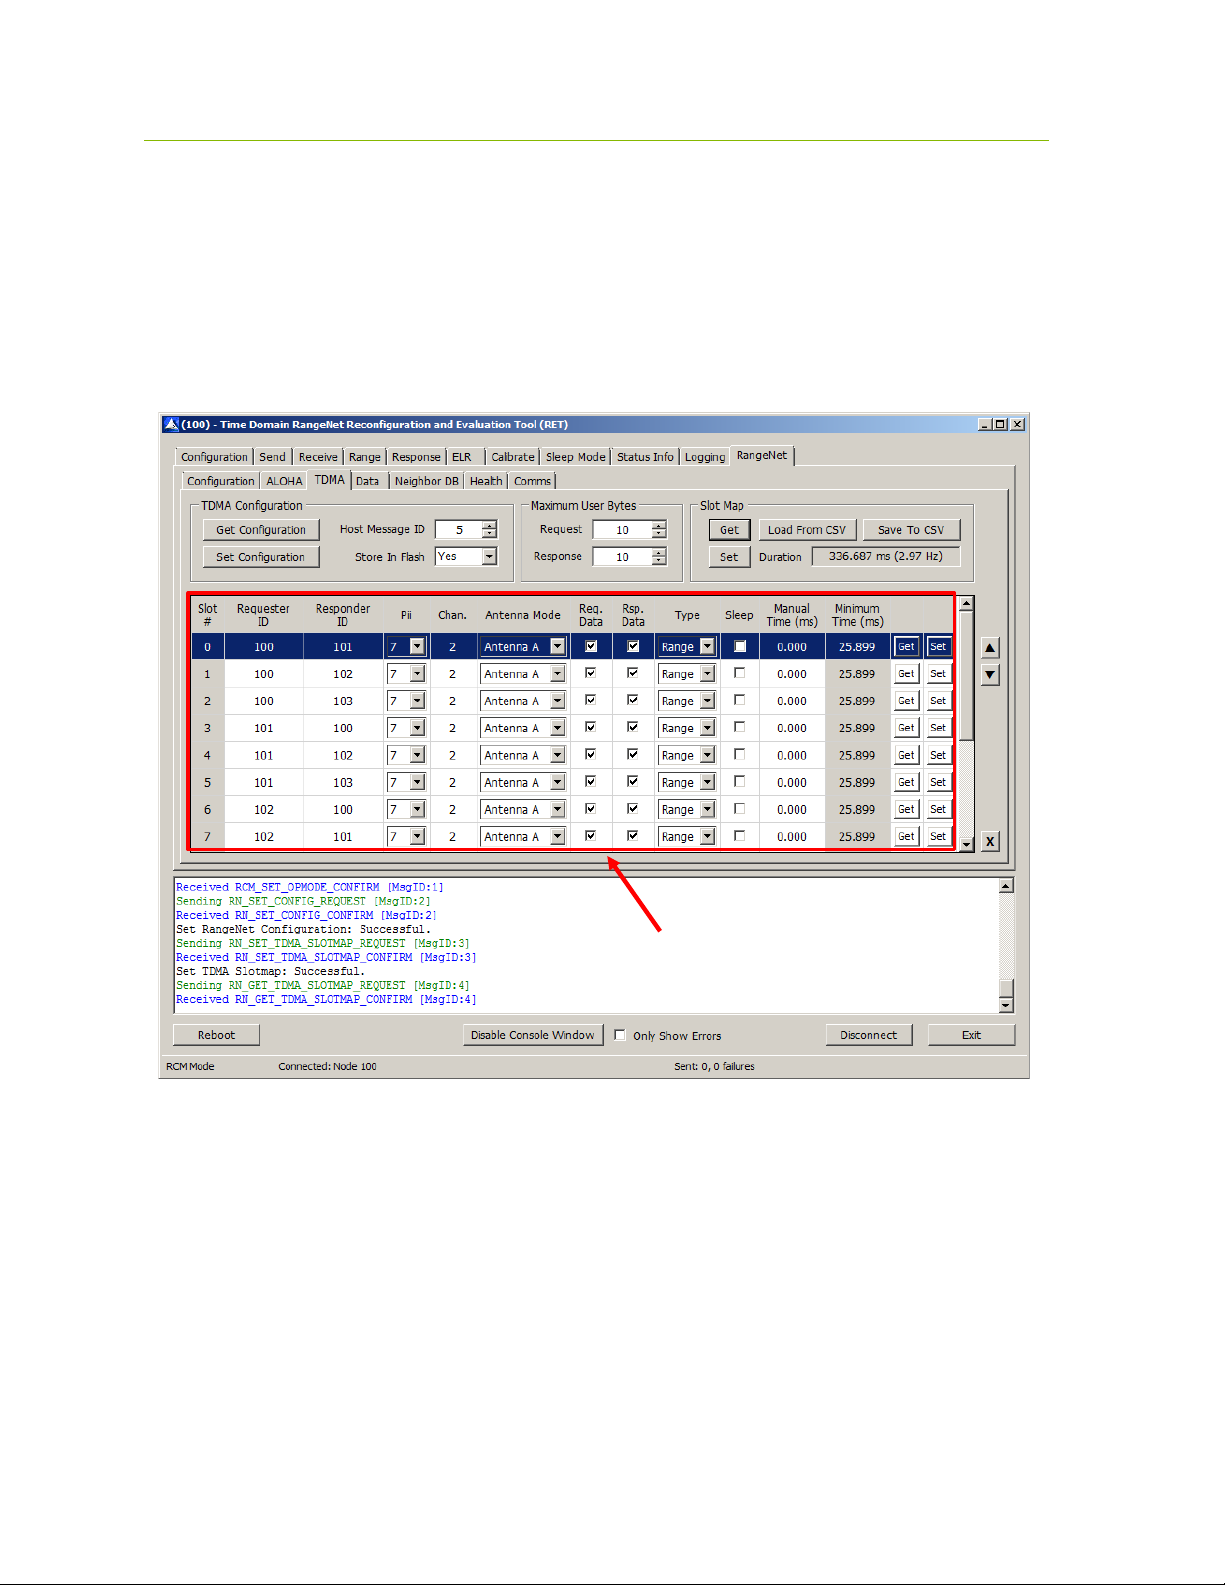
If the TDMA protocol is used, then the user can define a slot map that provides each radio
with an indication of when and to whom and with what parameters it should communicate.
An example slot map is shown below in Figure 5. The slot map shown is for a system of 4
nodes (100, 101, 102, and 103) in which 100 and 101 range to each of the other three and 102
ranges to 100 and 101.
Fig. 5: Representative RangeNet slot map
Maintaining system synchronization is the responsibility of the P440 processor and it does so
with an accuracy of 1 μs.
Because the P440 supports multiple communications channels, it is possible to operate either
the ALOHA or TDMA protocol with a CDMA overlay.
Because the P440 network schedules range requests, it avoids the overhead of Host to P440
communications and can therefore run at a higher ranging rate.
The P440 network maintains a neighbor database. Besides noting all of the members of the
network and their ranges, this database also contains a large body of statistics and other
useful information. For example, the database includes SNR, approach velocity, effective
ranging rate, and signal quality.
TDMA Slotmap

P440 Data Sheet / User Guide DRAFT 15
The network also takes advantage of two features available with simple ranging applications,
Echo Last Range (ELR) and Coarse Range Estimate (CRE), but which find special utility
when used in a network. ELR takes advantage of the fact that all units can receive any
transmission. Whenever a unit requests a range from a particular unit, it also transmits the
last successful range measurement and node number of the corresponding unit. This
information is effectively broadcast to all units in the area. This mechanism therefore
distributes network range information throughout the units in the system.
CREs take similar advantage of the broadcast nature of transmission. When a unit receives a
transmission it will automatically generate a waveform scan and measure the strength of the
first arriving energy. This yields a number similar to RSSI, but which is different in two
ways. First, the strength measured is proportional to the strength of the first arriving energy
and not, as in the case of RSSI, the peak strength of any signal. Second, while RSSI is rarely
if ever calibrated, the CREs are calibrated based on the last time the unit successfully
completed a TW-TOF range measurement with the target unit. While the accuracy of a CRE
does not compare with the accuracy of the TW-TOF measurement, its level of accuracy is
frequently good enough to be useful and it has the added benefit of expanding the network
knowledge without incurring any cost.
While these are all powerful network tools, the complexity inherent in this richness can make it
difficult to visualize and operate through just the API. The RangeNet GUI fills this gap. Not only
does it allow the user to configure the system, but it also provides a means for easily maintaining
different configurations, monitoring results, evaluating the performance of individual links in the
network, and monitoring the neighbor database. For example, RangeNet allows the user to:
Define all types of configuration information (including TDMA slot map, ranging
configuration details, ALOHA setup information, neighbor database characteristics),
download it to the P440, store that configuration to disk, and recover from disk any given
configuration.
Monitor the database at whatever update rate the user finds useful. Figure 6 illustrates the
database from a 4-node system. Note the extent and volume of statistics maintained in the
database. (For details on the meaning of specific fields, refer to the RangeNet User Guide.)
Send, receive, and display data.
Display waveform scans associated with a particular link.

16 DRAFT P440 Data Sheet / User Guide
Fig. 6: Representative neighbor database of a 4-node system
2.4.3 Monostatic Radar with MRM RET
The Monostatic Radar API allows the user to configure the radar parameters, transmit pulses, and
measure radar returns. Configuration parameters include the following:
Communication channel
Transmit antenna configuration
Transmit power
The number of pulses that will be integrated to form a measurement
The desired duration of the received RF scan
This final parameter warrants discussion. The user can define what portion of the radar return should
be measured and reported. Furthermore, that portion does not need to be continuous or taken at the
same integration. For example, it is possible to measure the radar return corresponding to the
distance:
From the antenna to 10 meters
From 10 to 20 meters from the antenna
From 10 to 20 meters, from 30 to 40 meters, and from 50 to 55 meters
From 10 to 20 meters with integration of 256:1 and 40 to 50 meters with integration of
2048:1
The API also allows the user to define a rate at which the radar returns are generated. Furthermore,
these scans are coherent both in radar fast time and in radar slow time. With the use of a Hilbert
transform the radar returns can be post-processed to generate I and Q data streams.

P440 Data Sheet / User Guide DRAFT 17
The MRM RET GUI allows the user to:
Define all of the configuration parameters, download them to the P440, and save and retrieve
configurations from disk
Initiate radar transmissions
Collect, display, and log received data to disk
Furthermore, the MRM RET GUI has an associated task which will also:
Bandpass the received data
Motion filter the data
Detection filter the data
Report detections as well as the first arriving detection
This filtering task provides basic motion filter functionality and allows the user to tune the filter
constants. If desired, the user can also log all of this information with the raw data.
It should be noted that these filters are very general in nature and are not optimized for any particular
application. They are offered to the system developer as an example and the source code for the
filters can be found in the MRM RET User Guide.
The MRM RET GUI and associated sample code allow the user to exercise the P440 in a number of
important ways. Consider the following three examples:
Example 1 - I/Q Doppler processing: MATLAB Sample Application #3 allows the user to exercise
several radar modes. One mode of operation involves measuring the radar return from a moving
target and then using I/Q Doppler processing to produce a plot of a Range vs. Doppler shift. An
example plot is shown in Figure 7.
Fig. 7: Range vs Doppler shift from an approaching target
2
5
-30
-40
4
3
Range (m)
20
-20 -10 30
0
Doppler Shift (Hz)
10

18 DRAFT P440 Data Sheet / User Guide
Example 2 - SAR imaging: Undergraduates at the University of Alabama in Huntsville (UAH) used
the radar and a stepper motor to create a synthetic aperture radar (SAR) image of a collection of
aluminum soda cans arranged to form the initials of the university. The results are shown in Figure
8:
Fig. 8: SAR image of soda cans arranged to form the letters UAH
A copy of their project can be found on the Time Domain website at the following link:
http://www.timedomain.com/UAH%20Senior%20Project%20-%20Final%20Presentation%20V4.pdf
Example 3 –ISAR imaging: a team at the University of Texas (Austin) used the radar to build an
inverse synthetic aperture radar (ISAR) image of windmill blades. These results are shown in Figure
9:
Fig. 9: ISAR image of rotating windmill blades –(a) test setup (b) windmill blades (c)
blades as modelled (d) blades as imaged by the ISAR
a) b)
c) d)

P440 Data Sheet / User Guide DRAFT 19
A copy of their paper can be found on the Time Domain website at the following link:
http://www.timedomain.com/white-papers/Univ%20Texas%20Austin%20-
%20SAR%20Imaging%20of%20a%20Windmill.pdf
2.4.4 Bistatic Radar and Propagation with CAT (Channel Analysis Tool)
The CAT API and GUI allow the user to operate the P440 as either a bistatic radar or as a
communications propagation tool. This is easy because both applications are simply different ways
of viewing the same thing. Consider the waveform shown in Figure 10. A communications engineer
would look at this scan, point out the first arriving energy and comment that the multipath is due to
other reflectors in the channel. He might then use this waveform to compute the delay spread of the
channel and evaluate the impact of multipath on inter-symbol interference. A radar engineer would
look at this very same scan, point out the first arriving energy and comment that the multipath
reflections are due to a mix of fixed clutter and targets operating in the area. He might then use
Doppler processing or motion filters to separate the clutter from the targets.
Fig. 10: Captured waveforms can be used by either communications or radar engineers
Given this, it is best to ignore the application differences and focus on the functions provided by the
CAT API and GUI.
The API allows the user to transmit an arbitrary number of packets at a user-selectable
communications channel, over the antenna of choice, at a selected integration rate, at a selected
transmit power, and to receive packets from another unit. The receiver would then measure and
report the part of the waveform which the user is interested in evaluating. For example, the user
could request that the recorded waveform start 50 ns before the beginning of the pulse and end 145 ns
after the pulse (as shown in Figure 10). Note that this waveform was taken with a 61 ps resolution.
The CAT API also allows the user to specify other resolutions. For example, it is possible to take
waveforms at 4 ps intervals. Shown below in Figure 11 and Figure 12 are two waveforms. The only
difference between the two waveforms is that in one case the resolution was at 61 ps while the other
was taken at 4 ps.

20 DRAFT P440 Data Sheet / User Guide
Fig. 11: Waveform scan captured at 61 ps resolution
Fig. 12: Waveform scan captured at 4 ps resolution
Because transmissions will be received by any radio in the area, the system can have one transmitter
and many receivers. Depending on your point of view, this is either a spatially distributed multistatic
radar array or an excellent way to quickly collect data for an RF propagation model.
The API also has two final capabilities: (1) the user can send a fixed data pattern with a length of up
to 1000 bytes, and (2) the P440 will report the SNR of the signal.
The GUI allows the user to configure the units, initiate transmission, and then collect, display, and log
the data. The GUI will also report and log various statistics including packet error rate, bit error rate,
packets sent, bits sent, and SNR (Eb/No).
2.5 Networking: RangeNet vs. RangeNet Lite
RangeNet Lite is a node-limited version of RangeNet and is intended to allow users to evaluate and
test before considering licensing or purchasing the unrestricted version. RangeNet Lite is provided
with all Ranging and Localization Development Kits, as well as the PulsON Lab and MegaLab
Table of contents


