Trio CS-1560AII User manual

TRIGGEREDSWEEPOSCILLOSCOPE
HIGH
STABILITY
CS-1560AII
DUAL
TRACEOSCILLOSCOPE
INSTRUCTION
MANUAL
TRIO

CONTENTS
Page
FEATURES
2
SPECIFICATIONS
2
CONTROLSONPANELS4
FrontPanel4
Rear
Panel4
OPERATION7
Preliminary
operation
7
Operating
Procedures7
APPLICATIONS8
Dual-traceApplications8
Single-channelApplications17
FM
Receiver
Adjustments19
X-Y
Applications20
AmplifierSquare
Wave
Test
21
SCHEMATIC
DIAGRAM
29

FEATURES
*
Vertical
axis
oflow
inputcapacitance
(22
±3pF)
for2-
channeloperationprovideshighsensitivity
and
wide
band-width(10mV/div,15MHz).
*
Highsensitivity
CRT
withexcellentbeampermeability
has
sufficientbrightness
for
measurements
of
fastspeed
pulses
of
highfrequencies.
*
Thehighvoltagepower
for
CRTaswellasthepower
for
othercircuitsisfullystabilizedbecause
of
theuse
ofDC-
DCconverter,thus
the
sensitivity
and
brightness
are
completelyfreefromeffects
of
voltagevariations.
*X-Y
operation
is
possiblewith
CH2
amplifierused
asX
axis.
The
horizontal
axis
sensitivity
isas
high
as
10mV/div,
permittingaccuratecalibrations.
*
TimebaseswitchallowschangeoverbetweenCHOPand
ALT
andbetweenV(vertical)andH(horizontal)
of
TVsync
separatorcircuit,automatically
and
electronically.
*CH1andCH2
can
be
individuallysynchronized(internal
syncronization).
*At
AUTOposition
of
TRIG
LEVEL,
itis
possible
to
check
thebrightness
at
no-signaltime
andto
adjusttriggering
level
of
inputwaveforms.
*
Mode
selectorswitch
is
provided
for
measurements
of
sum
and
differencebetween
2
channels.
*Low
powerconsumption
(23W)for
cooloperation.
*All
componentparts
are
cleverly
mounted
on
circuit
boards
for
improvedreliability.
*
Tracerotationsystem
for
easyadjustment
of
horisontal
trace.
*The
adoption
ofIC's
throughout
circuitryassureshigh
performance
and
improvedreliability.
SPECIFICATIONS
2
CathodeRayTube
Type:
130BXB31orC535P31B
Accelerating
voltage:
2kV
Scale:
8
div
x
10div(1
div= 1 cm)
Vertical
Amplifiers
(CH1
andCH2)
DeflectionFactor:10
mV/div~20V/div,
1-2-5sequence
(1
div=1
cm)
Precisely
adjustablebetween
all
ranges.
Sensitivity
errorbetween
rangesis±5%.
Input
Impedance:
1
MO±5%
Input
Capacitance:
22pF
±3pF
FrequencyResponse:DCDC-
15MHz
(less
than
-3dB)
AC2Hz
-
15MHz
(less
than
-3dB)
Rising
Time:
Less
than
23
nsec.
Over-shoot:
Less
than3%
(at
100kHzsquarewave)
Cross-talk:
Betterthan70dB
at
1
kHz
OperatingModes:CH1
Channel
1
only
CH2Channel
2
only
DUALDualtrace(CHOPand
ALT
areautomatically
selected
by
SWEEP
TIME/DIV)0.5Ms/div
~0.5ms/div
ALT
(alternatesweep)
1
ms/div~0.5s/div.
CHOP(200kHz
switching)
ADDAlgebraicsum
of
CH1
andCH2.
SUB
Algebraicdifference
ofCH
1
andCH2.
CHOPFrequency:
200kHz
±20%
Maximum
Input
Voltage:600Vp-p
or
300V
(DC+ AC
peak)
SweepCircuit(CommontoCH1andCH2)
SweepSystem:
Triggered
and
automatic.
In
automatic
mode,
sweep
isob-
tainedwithoutinputsignal.
SweepTime:
0.5/zs/div
~
0.5s/div
±5%and
"X-Y",
1-2-5
sequenceFine
adjustmentbetweenall19ranges
SweepMagnification:
Obtained
by
enlargingtheabove
sweep
5
times
(±5%)
from
center.
Linearity:
Less
than
3%
(2yus/div
~
0.5s/div)
Less
than
5%
(0.5(us/div
~
1/us/div)
Triggering
Source:
CH
1.
CH2andEXT
Slope:
NORM
-
positive
and
negative
TV-
positive
and
negative
(TVH
and
TVV
are
automatically
switched
by
SWEEPTIME/DIV)
TVH
(TV-
Line):
0.5jus/div
~
50Ms/div
TVV
(TV-
Field):
0.1ms/div
~
0.5s/div
TriggeringVoltage:
CH
1
andCH2
Amplitude
on
CRT
screen,morethan0.5div
EXT
More
than
1Vp-p
TriggeringRange:
20Hz
~
1
5MHz

3
HorizontalAmplifier(Horizontalinput
thru
CH2
input)
X-Y
Operation:
With
SWEEPTIME/DIV
switch
in
X-Yposition,theCH
1
input
becomesthe
Y
input
(vertical)
andtheCH2inputbecomesthe
X
input(horizontal).TheCH2
positioncontrolbecomesthe
horizontalpositioncontrol.
DefiectionFactor:SameasCH2
(10mV/div~20V/div±5%)
Frequency
Response:
DCDC-
1
MHz
(less
than
-3dB)
AC2Hz-1MHz
(less
than
-3dB)
Input
Impedance:
SameasCH2(1
Mfi
±5%)
Input
Capacitance:
SameasCH2(22pF
±3pF)
CalibratingVoltage:
WP-p
±5%
(1kHzsquarewave)
Intensity
Modulation
Input
Voltage:
More
than20Vp-p
Input
impedance:
470kfi±20%
Trace
Rotation:
More
than20Vp-p
Input
Impedance:
470kfl±20%
Trace
Rotation:
Trace
angleisadjustable
by
pan-
el
surface
adjustor.
PowerRequirements
PowerSupplyVoltage:AC
100/117/220/240V
±
10%,
50/60Hz
PowerConsumption:23W
Dimensionsand
Weight
Width:
260mm(277mm)
Height:
190mm(204mm)
Depth:
384mm(449mm)
Figures
in
( )
showmaximum
sizes.
Weight:
9.3
kg
Accessory
Probe:
PC-27
2
Damping
1/10
Inputimpedance
10Mfi
Input
capacitance
less
than18pF
Pin-plug:
Shortingtype
1
Non-shortingtype
1
Replacement
Fuse:
0.3A2
0.7A
2
InstructionManual:
1 copy

4
CONTROLS
ON
PANELS
FRONT
PANEL
REAR
PANEL

1.
J POSITION
This
controladjustsverticalpositionduring
CH1
operation
andY
positionduring
X-Y
operation.
Waveformscan
be
set
to
anydesiredverticalposition.
Arightturn
of
thecontrol
will
shiftwaveformupward,
andviceversa.
2.
DCBAL
Vertical
DC
balanceadjustment
for
CH1(or
Y).
Adjustment
is
made
so
thatwaveformposition
isnot
shifted
when
the
gaincontrolVARIABLES)
forthe
vertical
amplifier
is
rotated.
3.INPUT
Vertical
inputterminal
for
CH1,
orY
inputterminal
duringX-Yoperation.
4.
AC-GND-DC
Vertical
inputselector
for
CH1,
orforY
inputselector
during
X-Y
operation.
AC:
The
DC
component
of
inputsignalisblocked
bycapacitor.
GND:
Theinputterminalopensandtheinput
of
in-
ternal
amplifier
is
grounded.
DC:
The
inputterminal
is
directlyconnected
to
theamplifier
andall
components
of
input
signal
are
amplified.
5.VOLTS/DIV
Vertical
attenuator
for
CH1
orforY
duringX-Yopera-
tion.
The
scale
is
graduated
in
voltage
per
"div"(
=
cm)
ofCRT
screenarea.Calibratedvoltage
isin-
dicated
whenVARIABLE
(6)
isturnedfullyclockwise.
Set
thiscontrol
for
properwaveformaccording
to
the
inputvoltageused.Selectable
in11
rangesfrom
10mV/div
to
20V/div.
6.VARIABLE
Vertical
attenuator
for
thecontrol
of
vertical
sensitivity
of
CH1orY
during
X-Y
operation.
It
continuously
controlsbetween
11
ranges
of
VOLT/DIV(5).
Inthe
extreme
clockwise
(CAL)
position,
the
vertical
attenuator
is
calibrated.
7.MODEICH1,CH2,DUAL,ADD,SUB)
CH1:
Only
the
inputsignal
to
CH1
is
displayed
asa
single
trace.
CH2:Only
the
inputsignal
toCH2is
displayed
asa
single
trace.
DUAL:Inthe
range
of
0.5s/div
to
1
ms/div,
the
input
signals
to
both
channelsareswitched
by
about
200
kHz
signal(CHOPoperation).
In
therange
of
0.5ms/div
to
0.5^s/div,theinput
signals
to
both
channelsarealternately
switch-
ed
for
eachsweep(ALToperation).
ADD:The
waveformsfrom
both
channelinputs
are
algebraically
added
and
thesumisdisplayed
as
a
singletrace.
SUB:Theinput
of
reversepolarity
toCH2is
added
to
theinput
toCH1andthe
algebraicdifference
obtainedbetweenCH1
andCH2is
displayed
as
a
singletrace.
If
CH1hasno
input
oritis
grounded,
the
waveform
of
reversepolarityfrom
CH2
input
is
displayed.
8.VOLTS/DIV
Vertical
attenuator
for
CH2.
It
hasthesamefunction
as
V0LT/DIV(5),
butis
alsousedas
X
attenuator
du-
ring
X-Y
operation.
9.VARIABLE
Vertical
attenuatoradjustmentprovidesfinecontrol
of
vertical
sensitivity
of
CH2.
It
hastthesamefunction
as
VARIABLE(6),
butis
alsousedas
X
fineadjuster.
10.AC-GND-DC
Vertical
inputselector
for
CH2.
It
hasthesamefunc-
tion
as
AC-GND-DC(4),
butis
alsoused
asX
input
selector.
11.
INPUT
Vertical
inputterminal
for
CH2
orX
inputterminal
dur-
ing
X-Y
operation.
12.* POSITION,X-Y«*
Vertical
positionadjuster
forCH2.It
functions
the
same
as*
POSITIONO),
butis
alsousedas
X
posi-
tionadjusterduring
X-Y
operation.
13.DCBAL
Vertical
DC
balanceadjustment
for
CH2(orX).
It
has
thesamefunction
asDC
BAL(2).
14.LEDPilotLamp
This
lamplights
asthe
powerswitchILLUM(15)
is
turned
on.
15.POWER/SCALEILLUM
Poweristurned
off
attheextremeleftturnposition.
Arightturn
will
set
the
power
toONand
illuminate
thedial
scale.
16.INTENSITY
Adjusts
the
brightness
of
spots
and
waveforms
for
easy
viewing.
A
leftturn
will
allow
the
waveform
to
disappear.
17.
TRACE
ROTATION
This
isused
to
eliminateinclination
of
horizontaltrace.
18.ASTIG
Astigmatismadjustmentprovides
optimum
spot
roundness
and
brightnesswhenusedwith
FOCUS09).Once
itis
adjusted,
no
further
ad-
justments
are
required.
5

19.FOCUS
Spotfocuscontrol
to
obtain
optimum
waveform
according
to
brightness.
20.EXTTRIG
External
triggeringterminal.
For
externaltriggering,
external
triggeringvoltage(morethan
1Vp-p)
should
beapplied,withSOURCEswitch
(21)settoEXT.
21.
SOURCE
Three-positionswitch
to
selecttriggeringvoltages
for
CH1,
CH2and
EXT.
CH1:
Sweep
is
triggered
byCH1
vertical
input
waveform.
Bothsweeps
are
triggered
bythe
samesource
in
dual(2-channel)traceoperation.
CH2:Sweep
is
triggered
byCH2
vertical
input
waveform.
Bothsweeps
are
triggered
bythe
samesource
in
dual(2-channel)traceoperation.
EXT:
Sweep
is
triggered
byan
externalsignalapplied
toEXTTRIG
(20)
terminal.
22.
SYNC
Sync
separator
switch.
It
picks
up
syncsignal
component
inTV
videosignal
and
applied
to
trigger
circuit
for
completesynchronization
of
videosignal
be-
ingviewed.
NORM
±:
Used
for
viewinggeneralwaveforms.
In
this
position,
TV
syncseparatorcircuit
isnot
connected.
At
"-)-"
polarity,sweepiseffected
by
"-)-"
slope
and,
at" —"
polarity,
by" —"
slope.
TV
±:
Used
for
viewingwaveformswith
TV
video
signal
synchronizedwithsyncsignal.
TVVand
TVH
are
automaticallyselected
for
sweeptimes
of0.5sto0.1msand
50MS
to
0.5MS
ofSWEEP
TIME/DIVrotary
switch,
respectively,
andare
synchronizedwithvertical
and
horizontalsync
signals.
Polarity
should
besetto
matchthat
of
video
signal
as
shown
inthe
illustration.
SYNC
SWITQH
TV
(+)
SYNCSWITCH
TV
(-)
23.
LEVEL
Triggeringlevelcontroladjustssyncphase
to
deter-
mine
the
starting
point
of
sweep
onthe
slope
of
triggersignalwaveform.
PULL
AUTO:
By
pulling
LEVEL
VR
toward
you,
auto-sweep
is
effected;
the
sweep
issetin
free-runningstateeven
when
no
trigger
input
signal
is
applied,withfly-back
line
displayed
onCRT.
With
triggersignal,trigger-sweep
is
effectedwhere
sync
level
is
adjustable.
When
the
synclevelexceeds
thelimit,
the
sweep
issetin
free-runningstate.
24.<>POSITION,PULLX5MAG
Horizontalpositionadjuster
to
shiftwaveform
toany
desiredhorizontalposition.
A
rightturn
of
theadjuster
will
shift
the
waveform
to
right,
and
viceversa,
pull
X 5 MAG.
Sweep
magnifier
switch.
By
pulling
the
knob
toward
you,waveform
is
magnified
to5
times
in
left
and
right
directions.
Brightness
is
slightlydecreased.
25.SWEEP
TIME/DIV
Horizontalsweeptimeselector.
It
selects
sweep
times
of
0.5MS
to0.5sin19
steps.
X-Y
operation
is
possible
by
turning
the
knob
fullyclockwise.
ChangeoverbetweenCHOP,
ALT,TVVandTVHis
also
accomplishedautomatically
by
thisselector.
When
VARIABLE
(26)is
turnedfullyclockwise,
calibrated
reading
is
obtainedwhichisthesweeptime
per"div".
26.VARIABLE
Used
for
fineadjustment
of
sweeptime.Continuous
adjustmentbetween
19
steps
of
SWEEPTIME/DIV
(25)
is
possible.Sweeptime
is
calibrated
attheex-
tremeclockwiseposition(CAL).
27.CAL
Calibrationvoltageterminal.Calibrationvoltage
is
1Vp-p
of
about
1kHz
squarewave.
28.ACVOLTAGESELECTOR
The
CS-1560A
IImaybe
operated
from
100V,120V,
220V,240V,putting
theAC
VOLTAGESELECTOR
in
theplaceofanother.
29.FUSEHOLDER
For
100<~
120Voperation
a 0.7
amperefuseshould
beused.
For
220~
240Voperation
a 0.3
amperefuseshould
beused.
30.POWERCONNECTOR
For
connection
of
thesupplied
AC
powercord.
31.
Z AXIS
INPUT
Intensity
(brightness)
modulation
terminal.Intensity
is
modulated
at
voltages
of
20Vp-p
or
higher.
When
modulation
isnot
needed,
the
suppliedshorting
pin
must
be
plugged
in.
32.CORD
REEL
Wind
powercordwhen
the
oscilloscope
istobe
carried
or
stored.Theyalsoserveas
a
standwhen
the
oscilloscope
is
used
in
upright
position.
Fig.1
6

OPERATION
PRELIMINARY
OPERATION
When
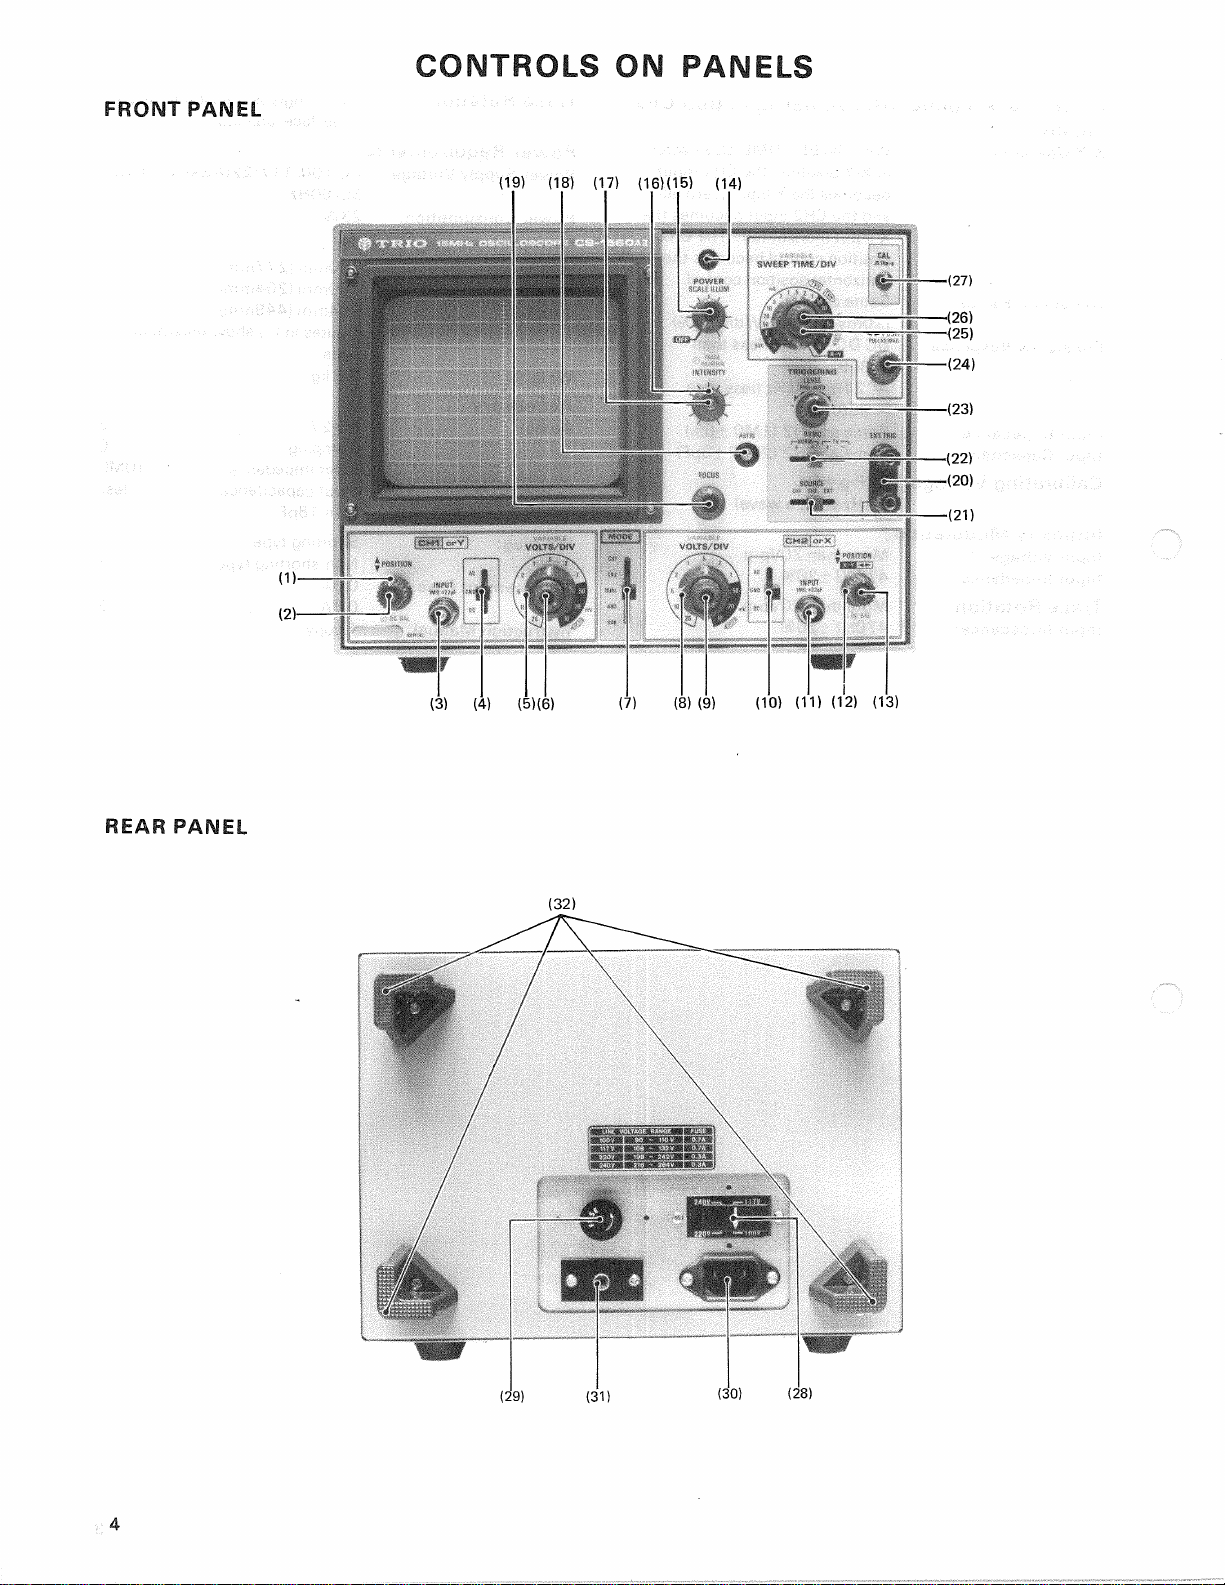
operatingthisoscilloscope,refertopanelcontrolsand
OPERATING
PROCEDURES
(1)
Insertthesuppliedpowercordtothepowerconnec-
tor.Then,
select
thepositionofthepowervoltagese-
lector
plug
asindicatedbythearrowmarks.
(2)
TurnPOWER(15)
clockwise.
Thepoweristurnedto
ONandLEDpilotlamp(14)lights.
(3)
Horizontal
axis
will
bedisplayed.
When
fly-backline
doesnotappearatthecenterofthescreen,adjust
POSITION(1)andPOSITIONPULLx5MAG(24).
AdjustbrightnesswithINTENSITY(16).Iffly-back
line
isunclear,adjustFOCUS(19).
(4)
Theoscilloscopeisnowreadyformeasurement.For
measurement,proceedasfollows:
ApplysignalvoltagestotheInputterminals(3),(11).
ThenturnVOLT/DIV(5)clockwiseuntilthewaveform
is
correctlydisplayedonthescope.Bysetting
MODE
(7)
andSOURCE(21)toCH1,theCH1inputsignalto
theInputterminal(3)
will
appear.Similarly,bysetting
MODE
andSOURCEtoCH2,thentheinputsignalto
theCH2terminal(11)
will
appear.
When
MODE
(7)is
set
toDUAL,twowaveforms(CH1andCH2)
will
ap-
pearonthescope.
With
SOURCE(21)settoCH
1,
the
CH
1
inputsignalfromtheInputterminal(3)isfedto
thesynchrocircuitwheretheCH1signalissynchro-
nized.Similarly,whenSOURCEissettoCH2,the
CH2signalissynchronized.Useeither
method
for
easier
observation.
When
MODE
issettoADD,theCH
1
signalisalge-
braicly
addedtotheCH2signal;andwhenitissetto
SUB,
theCH2signalinreversepolarityisaddedtothe
CH
1
signalandtheabgebraicdifferencebetweenCH1
andCH2isdisplayed.
(5)
When
thesignalvoltageismorethan10mVand
waveform
fails
toappearonthescreen,theos-
cilloscope
maybecheckedbyfeedinginputfrom
CAL
1
Vp-p(27).Sincecalibrationvoltageis
1
Vp-p,the
waveformbecomes5divhighatthe0.2V/divposition,
tion.
(6)Bypushing
LEVEL
(23),thefree-runningautofunction
is
released.Thewaveformdisappearswhentheknob
is
turned
clockwise,
andappearsagainattheap-
proximatemidpositionofit.Syncphaseisalsoad-
justable
inthis
case.
Thewaveform
will
againdis-
appearwhentheknobisturnedcounterclockwise
fromthemidposition.
(7)
When
DCcomponentismeasured,set
AC-GND-DC
to
DCposition.If,inthis
case,
theDCcomponentcon-
7
their
functions(seepage4).
When
startingthisoscilloscopesetinitially,settheoperating
controlsasfollowsandthesetmaybeturnedonsafely.

tains
plus
"+"
potential,thewaveformmovesupward
and
if
it
containsminus
"—"
potential,thewaveform
movesdownward.
The
referencepoint
of
"0"
potential
is
checked
at
GNDposition.
APPLICATIONS
DUAL-TRACEAPPLICATIONS
Introduction:
The
mostobvious
andyetthe
mostusefulfeature
of
the
dual-trace
oscilloscope
is
that
it
has
the
capability
for
simultaneouslyviewingtwowaveformsthatarefrequency-
orphase-related,
or
that
a
common
synchronizingvoltage,
such
as
in
digitalcircuitry.Simultaneousviewing
of
input
andits
output
isaninvaluableaid
to
thecircuitdesigner
or
therepairman.Severalpossibleapplications
ofthe
dual-trace
oscilloscope
will
be
reviewed
in
detail
to
familiarize
theuserfurther
in
thebasicoperation
of
thisos-
cilloscope.
Frequency
DividerWaveformsViewing:
Fig.
3
illustrates
the
waveforminvolved
ina
basic
divide-by-two
circuit.
Fig.
A
indicatesthereference
or
clock
pulsetrain.Fig.
B
andFig.
C
indicatethepossibleoutputs
of
thedivide-by-twocircuitry.Fig.
3
alsoindicatesthesettings
ofspecificoscilloscopecontrols
for
viewingthese
waveforms.
In
addition
to
thesebasiccontrolsettings,
the
TRIGGERING
LEVEL
control,aswellastheCH1andCH2
vertical
positioncontrolsshould
besetas
required
to
producesuitabledisplays.
In
the
drawing
of
Fig.
3,
the
waveformlevels
of2 cm
are
indicated.
If
exact
voltage
measurements
of
CH1
and
CH2aredesired,theCH1
and
CH2VARIABLEcontrolsmust
be
placed
intheCAL
position.TheCH2waveformmaybeeitherthatindicated
in
Fig.
3Bor
Fig.
3C.
In
Fig.
3C,the
divide-by-two
output
waveformisshownwhichoccursduringthefallingtime
of
pulses.
In
this
case,
the
putput
waveform
is
shiftedwith
respect
totheleadingedgeofthereferencefrequencypulse
by
a
timeintervalcorresponding
to
the
pulsewidth.
Divide-by-8Circuit
Waveforms:
Fig.
2
indicateswaveformrelationships
fora
basic
divide-by-eight
circuit.
The
oscilloscopesettings
are
identical
tothoseused
in
Fig.
4.
Thereferencefrequency
of
Fig.
3A
issuppliedtotheCH1input,andthedivide-by-eight
output
isappliedtotheCH2input.Fig.
2
indicatesthetime
relationshipbetween
the
inputpulsesand
output
pulses.
In
anapplicationwherethelogiccircuitryisoperating
at
ornearitsmaximumdesignfrequency,theaccumulated
rise
timeeffects
of
the
consecutivestagesproduce
a
built-in
timepropagationdelaywhichmust
be
compensated
for.
Fig.
2C
indicatesthepossibletimedelaywhichmay
bein-
troducedinto
a
frequencydivider
circuit.
Useofthe
dualtrace
oscilloscope,theinputand
output
waveformscan
besuperimposed
(ADD
or
SUB)
to
measure
the
exact
amount
of
propagationdelaythatoccurs.
CH-1
WAVEFORM
CH-2
WAVEFORM
CH
1
A.REFERENCEFREQUENCYPULSETRAIN
(1000
PULSESPER
SECOND)
CH
2
B.
DIVIDE-BY-TWOOUTPUTSYNCHRONIZED
TO
LEADINGEDGE
OF
REFERENCEPULSE
CH
2
C.DIVIDE-BY-TWOOUTPUTSYNCHRONIZED
TO
TRAILINGEDGE
OF
REFERENCEPULSE
WAVEFORM
2
WAVEFORM
1
Fig.3.
Waveformsindivide-by-twocircuit
Fig.
2.
Waveformsindivide-by-eightcircuit
LEADINGEDGES
MAYNOTBE
VISIBLE
AT
FASTSWEEPRATES
WAVEFORM
1
HEIGHT
WAVEFORM
2
HEIGHT
8

PropagationDelayTimeMeasurement:
Anexample
of
propagation
delay
ina
divide-by-eight
circuit
wasgiven
in
the
previousparagraph.Significant
propagation
delay
may
occur
inany
circuit.
This
os-
cilloscope
has
featureswhichsimplifymeasurement
of
propagation
delay.
Fig.
5
shows
the
resultantwaveforms
whenthedual-tracepresentationiscombinedinto
a
single-
trace
presentation
by
selectingthe
ADDor
SUBposition
of
the
MODE
switch.
In
the
ADD
positionthetwoinputsare
algebraically
added
ina
single-tracedisplay.Similarly,inthe
SUB
position
thetwo
inputs
are
algebraicallysubtracted.
Either
positionprovides
a
precisedisplay
of
the
propagation
time(Tp).Usingthecalibratedtimebase(CAL),
Tp
can
be
measured.
A
more
precisemeasurementcan
be
obtained
if
the
Tp
portion
of
thewaveform
is
expandedhorizontally
by
pullingthe
5XMAG
control.Italsomaybepossibletoview
thedesired
portion
of
thewaveformata fastersweepspeed.
CH
1
CH
2
EXPANDTHISPORTION
FOR
MORE
PRECISE
TIMEMEASUREMENT
Fig.4.
UsingADD
or
SUB
modesforpropagationtimemeasurement
Digital
Circuit
TimeDelayMeasurement:
Since
a
dual-traceoscilloscope
hasthe
capability
of
comparing
the
timing
of
one
waveformwithanother,
itis
necessary
in
designing,manufacturingandservicingdigital
equipment.
In
digital
equipment,
many
of
the
circuits
are
frequencydividers
as
previouslydescribed,
but
waveforms
are
oftentime-related
in
manyothercombinations.Fig.
5
shows
a
typicaldigitalcircuit
and
identifiesseveral
of
the
points
at
whichwaveformmeasurementsareappropriate.
Under
the
operatingcondition,waveforms
will
varyaccor-
ding
to
the
input
or
operating
mode.
Fig.
6
shows
the
relationshipbetweenthenormalwaveforms
tobe
expected
at
each
of
thesepointsandtheirtiming.
If
thecorrecttime
relationshipwithrespect
to
otherwaveform
is
unknown,
measurement
of
individualwaveformsmeansnothing.
The
dual-trace
oscilloscopeallowsthiscomparison
tobe
made.
In
an
application,waveform
No.
3
would
be
displayed
on
CH1andwaveform
No.
4
thru
No.
8
and
No.10
would
be
displayed
on
CH2.
Waveforms
No.11
through
No.13
would
probably
be
displayed
on
CH2
in
relationship
to
waveform
No.
8
orNo.
4
on
CH
1.
No.
8
or
No.
10
isanex-
cellent
syncsource
for
viewing
all
of
thewaveforms.
With
No.
8
orNo.10
usedasexternalsyncsource,any
ofthewaveformsmay
be
displayedwithoutreadjustment
of
theTRIG
LEVEL
control.Waveforms
No.
4
through
No.
7
should
notbe
usedasthesyncsourcebecausethey
donot
contain
a
triggeringpulseatthestart
of
theframe.Itwould
not
be
necessary
to
viewtheentirewaveformsasshown
in
Fig.
6 in
all
cases.
In
fact,
there
are
manytimeswhen
a
closer
examination
ofa
portion
of
thewaveformswould
be
appropriate.
In
such
cases,
it
isrecommendedthatthesync
remainunchangedwhilethesweepspeed
be
increased
or
X5
MAG
controlused
to
expand
the
waveformdisplay.
ADD
SUB
9

Fig.5.
Typical
digital
circuit
using
several
time-relatedwaveforms
10

ANY
INDIVIDUAL
ADDRESS
OR
FUNCTION
DATA
BITMAY
BEPOSITIVE
OR
NEGATIVE
DEPENDINGUPONTHECODED
INPUT
Fig.
6.
Family
of
time-related
waveformsfromtypicaldigitalcircuitin
Fig.
5
DistortionMeasurement:
Distortion
of
anamplifiermaybemeasuredwiththisos-
cilloscope.
Thismeasurement
is
especiallyvariablewhen
the
slope
ofa
waveformmust
be
faithfullyreproduced
byan
amplifier.
Fig.
7
shows
the
testing
ofa
circuitusing
a
triangular
wave,such
asis
found
inthe
limitercircuit
of
a
transmitter
modulator.Themeasurementmay
be
madeus-
ing
any
type
of
signal;merely
usethe
type
of
signal
for
testing
that
is
normallyapplied
tothe
amplifierduring
nor-
mal
operation.
The
procedure
for
distortiontesting
isas
follows:
ADJUST
POSITIONCONTROLS
TOSUPERIMPOSEWAVEFORMS
DIRECTLY
OVEREACHOTHER
SUB=DISTORTION
Fig.
7.Distortion
measurement
11
ADJUST
SO
BOTH
WAVEFORMS
ARE
SAMEAMPLITUDE
AMPL
No.1 AMPL
No.
2

1.
Apply
the
type
of
signalnormallyencountered
inthe
amplifierundertest.
2.
ConnectCH1
probe
tothe
input
of
theamplifier
and
CH2
probe
tothe
output
ofthe
amplifier.
Itis
preferable
ifthetwo
signals
arenot
inverted
in
with
respect
to
eachother,butinvertedsignalscan
be
used.
3.
Set
CH1
andCH2
DC-GND-AC
switches
toAC.
4.
Setthe
MODE
switch
to
DUAL.
5.
Set
SYNCSLOPEswitch
to
CH1
and
adjustcontrols
as
described
inthe
procedure
for
synchronizing
waveforms.
6.AdjustCH1
andCH2
POSITIONcontrols
to
superim-
pose
the
waveformsdirectlyovereachother.
7.Adjust
CH1andCH2
verticalsensitivitycontrols
(VOLTS/DIV
and
VARIABLE)
so
that
the
waveforms
are
aslargeaspossiblewithoutexceedingthelimits
of
the
scale,
and
so
that
both
waveformsareexactlythe
same
height.
8.
Now.setthe
MODE
switch
to
SUBposition
(ifone
waveform
is
invertedwithrespecttotheother,usethe
ADDposition).
Adjust
the
fineverticalsensitivitycontrol
(CH2
VARIABLE)
forthe
minimum
remainingwaveform;
if
the
two
waveforms
are
exactly
the
sameamplitude
andsamewaveform
and
there
isno
distortion,
the
waveforms
will
cancelandthere
will
be
only
a
straight
horizontalline
will
remain
onthe
screen.
GatedRingingCircuit(burstcircuit):
Fig.
8
shows
a
burstcircuit.Thebasicsettings
of
con-
trolknobsarethesameasthose
in
Fig.
4.
Thewaveform
A
is
the
referencewaveform
andis
applied
to
CH1input.
All
otherwaveformsaresampled
at
CH2
and
compared
tothe
reference
waveform
of
CH1.
The
burstsignal
canbeex-
amined
more
closelyeither
by
increasingthesweeptime
or
bypulling
the< •
POSITIONcontrol
to
obtain
5
times
magnification.
Delay
LineTest:
The
dual-tracefeature
ofthe
oscilloscopecanalso
be
used
to
determinethedelaytimes
of
transmissiontypedelay
lines
as
well
as
ultrasonictypedelaylines.The
output
of
delaylines
is
observed
onCH2
while
being
synchronized
with
the
input
pulse
of
CH1.
The
intervalbetweenpulses
should
be
largecompared
to
thedelaytime
tobe
observed.
In
addition,
to
determiningdelaytime,
the
pulsedistortion
inherent
in
thedelaylinecan
be
determined
by
examination
of
the
delaypulseobserved
onCH2
waveformdisplay.
Fig.
9
shows
the
typicaloscilloscopesettings
as
well
as
thebasictestcircuit.Typical
input
and
output
waveforms
are
shown
onthe
oscilloscopedisplay.Thisdelayline
checking
method
may
also
be
used
for
color
TV
receivers.
Fig.
10
shows
the
oscilloscopesettings
and
typicalcircuit
connections
to
check
the"Y"
delayline
employed
inthe
videoamplifiersection.
The
input
waveform
and
output
Fig.
8.
Gatedringingcircuitandwaveforms
PULSE
GEN
ACDUAL
AC
INPUT
ULTRA
SONIC
DELAY
LINE
(5/jSec)
5000PPS
lfiSec
PULSE
WIDTH
Fig.
9.
Delaylinemeasurements
12
OUTPUT

waveformarecompared
for
delaytime,usingthehorizontal
sync
pulse
of
thecompositevideosignal
for
reference.
The
indicateddelay
is
approximately
one
microsecond.
In
addi-
tion
to
determining
the
delaycharacteristics
of
theline,
the
output
waveformreveals
any
distortionthat
maybein-
troducedfrom
an
impedancemismatch.
TOHORIZONTALAMPLIFIER.
NOTE:
NO
ELECTRICAL
CON-
NECTION;
PLACE
CLIP
ON
NSULATION
OF
PLATE
CAP
LEAD
ORIN
CLOSEPROX-
IMITY
OF
HORIZONTALAMP-
LIFIER
TUBE.
VIDEO
AMPLIFIER
SET
BOTHPROBES
FOR
10:1
ATTENUATION
DELAY
LINE
'NOTE:
SETTING
OF
VERTICAL
ATTENUATORS
SHOULD
BE
THE
SAME,BUT
MAY
VARYWIDELY,
DEPENDING
ON
CIRCUIT
TYPE.
Fig.
10.Checking
"Y"
delaylineincolortelevisionreceivers
Stereo
Amplifier
Servicing:
Anotherconvenientusefora dual-traceoscilloscopeisin
troubleshootingstereoamplifiers.
If
identicalamplifiersare
used
andthe
output
of
oneis
weak,distorted
or
otherwise
abnormal,thedual-traceoscilloscopecan
be
efficientlyused
tolocalizethedefect.
With
an
identicalsignalapplied
to
the
inputs
of
both
amplifiers,
a
side-by-sidecomparison
of
both
unitscan
be
made
by
progressivelysamplingidenticalsignal
points
in
both
amplifiers.
When
the
defective
or
malfunc-
tioningstage
has
beenlocated,
itcanbe
immediately
observed
and
analyzed.
Improving
the
Ratio
of
Desired
to
Undesired
Signals:
In
someapplications,
the
desiredsignal
may
be
riding
on
a
largeundesiredsignalcomponentsuch
as
60Hz.
Itis
possible
to
minimize
orfor
practicalpurposeeliminate
the
undesiredcomponent.Fig.
11
shows
the
oscilloscope
set-
tings
for
such
an
application.
The
waveformdisplay
of
CH1indicates
the
desiredsignal
andthe
dottedline
in-
dicates
theaverageamplitudevariationcorresponding
to
the
undesired
60Hz
component.
TheCH2
displayindicates
a
waveform
of
equalamplitude
and
identicalphase
tothe
average
of
theCH1wavejorm.
With
the
MODE
switchset
toSUB,
and
by
adjusting
theCH2
verticalattenuatorcon-
trol,
the
60
Hz
component
of
theCH
1
signalcan
be
cancell-
ed
bytheCH2
input
andthe
desiredwaveform
can
be
observed.
ADJUST
FORONE
COMPLETE
CYCLE
AT
60Hz
Fig.
11.Improving
desired-to-undesired
signal
ratio
13
TOVIDEO
OUTPUT
AMPLIFIER
START
WITH
DUAL
CHANGE
TO
SUB

AmplifierPhaseShiftMeasurements:
In
the
squarewavetestingsection
of
thismanual,
squarewavedistortionisexplained
in
terms
of
phaseshift
of
thesignalcomponentswhichcomprise
the
squarewave.
These
phaseshifts
can
be
verifieddirectly
by
providing
a
s\newave
input
signal
to
the
amplifier
and
observing
the
phase
of
output
signalwithrespect
to
the
input
signal.
In
allamplifiers,
a
phaseshift
is
alwaysassociatedwith
a
change
in
amplituderesponse.Forexample,
at
the—3dB
response
point,
a
phaseshift
of45°
occurs.Fig.
11
il-
lustrates
a
method
of
determiningamplifierphaseshift
directly.
In
this
case,
the
measurements
are
being
made
at
approximately5000Hz.
The
input
signal
is
used
asa
reference
and
is
applied
to
theCH1
input
jack.
The
VARIABLEcontrol
is
adjusted
as
required
to
provide
a
complete
cycle
of
the
input
waveformdisplayed
on
8
div
horizontally,whilethewaveformheightisset
to
2
div.
The
8
div
displayrepresents
360°
at
thedisplayedfrequen-
cy
andare
centimeterrepresents
45°of
the
waveform.
The
verticalattenuatorcontrols
of
CH2areadjustedas
required
to
produce
a
peak-to-peakwaveform
of2
div.
The
CH2POSITIONcontrol
is
thenadjusted
so
that
the
CH2
waveform
is
displayed
on
the
samehorizontal
axis
asthe
CH1waveform.
The
distancebetween
thetwo
waveforms
thenrepresents
the
phaseshiftbetween
thetwo
waveforms.
In
this
case,
the
zerocrossoverpoints
of
the
twowaveforms
are
compared.
The
illustrationshows
a
phasedifference
of
1
div
whichmeans
a
phaseshift
of45°.
ADJUST
AS
REQUIRED
FORCOMPLETECYCLE
IN8cm
AF
SIGNAL
GENERATOR 4r INPUT
AUDIO
AMPLI
FIER
OUTPUT
LOAD
Fig.
12.Measuringamplifier
phase
shift
Television
Servicing:
Many
televisionservicingprocedurescan
be
performed
usingsingle-traceoperation.Theseareoutlinedlater
inthe
applicationsectioncoveringsingle-traceoperation.
One
of
these
procedures,viewing
the
multi-burstsignal
in
theVITS
(vertical
intervaltestsignal),
canbe
accomplished
more
effectively
using
a
dual-traceoscilloscope.TheVITSsignal
is
specificallyused
for
characteristic
checks
of
thetransmis-
sionsystem
ofa
broadcaststation
ora
networkincluding
repeaterstations
or
for
changeover
of
transmissionsystem.
In
many
cases,
thissignaldoes
not
appear
in
the
normal
videosignal.Evenwhen
itis
included
inthe
signal,
the
method
of
insertingtheinformationdiffers
depending
on
the
broadcaststation.Also,theVITSinformation
in
Field
1 (1st
interlaced
scanning)
and
Field
2
(2nd
interlacedscanning)
are
different
in
many
cases.
Examples
of
VITSsignals
are
shown
in
Fig.
13.
Because
the
oscilloscopesweep
is
synchronized
to
the
vertical
blankingsignal,
the
waveform
of
Field
1
cannot
be
distinguished
from
that
of
Field
2.
Thiscauses
the
VITS
signals
to
be
superimposed
onto
eachother,resulting
in
dif-
ficulty
in
viewing.
With
dual-traceoperationusingthesame
input,
the
waveform
canbe
viewedseparatelywithout
overlappingbecause
ofthe
effects
ofthe
oscilloscope's
alternate
sweepoperation
and
interlacedscanning
ofTV
signal.
The
possibility
of
viewingVITSsignalprovides
anim-
portantrole
in
servicing
TV
sets.
ThisVITSsignals
can
localize
trouble
in
the
antenna,tuner,
IFor
videosections
andshowswhenrealignmentmay
be
required.Thefollow-
ingproceduresshow
howto
analyze
and
interprete
os-
cilloscope
displays
of
the
VITS.
The
VITS
is
transmitted
during
the
verticalblanking
in-
terval.
On
thetelevisionset,
it
can
be
seenas
a
bright
white
line
above
thetop
of
the
picture,when
the
verticallinearity
orheightisadjusted
to
viewtheverticalblankinginterval
(on
TV
sets
withinternalretraceblanking
circuits,
the
blanking
circuits
must
be
disabled
to
seethe
VITS).
14

ThetransmittedVITS
has
a
specificfrequency,
amplitude
and
waveform
as
shown
in
Fig.
14.
Television
networksusepreciesignals
for
adjustment
and
checking
of
networktransmission
equipment,
butthe
multi-burstsignal
inVITS
can
also
be
used
for
checking
the
operating
condition
of
TV
sets.
The
firstframe
of
VITS
atthe
"B"
section
(line
18)
in
Fig.
14
beginswith
a
whitereference
sig-
nal,
followed
by
sinewavefrequencies
of
0.5MHz,
1
.OMHz,
2MHz,3MHz,
4.0MHz
and
3.58MHz.
Thissequence
of
frequencies
is
called
a
"multi-burst"which
is
veryuseful.
FIELD
1
(MULTI-BURST)
FIELD
2
FIELD
1&2
Fig.
13.
VITS
signal,Fields
1
and2
TheVITSotherthan
the
multi-burstsignal
is
different
depending
on
broadcaststation.VITSstaircasewaveform
containing
a
3.58MHz
burstsignal
is
valuable
to
the
network,
but
has
less
value
tothe
servicetechnician.
As
Field
1
is
interlacedwithField
2,
line
17
is
followed
by
line
279
and
line
18
is
followed
by
line
280.The
entireVITS
appears
at
the
bottom
of
theverticalblankingpulseandjust
before
the
firstline
of
the
video
signal.
Each
of
the
multi-burstfrequencies
is
transmitted
at
equalstrength.
By
observing
the
comparativestrengths
of
these
frequenciesafter
the
signal
is
processed
through
the
televisionreceiver,thefrequencyresponse
of
thesetcan
be
checked.
All
multi-burstfrequencies
are
transmitted
atthe
samelevel,
but
will
appear
as
shown
in
Fig.
14
even
on
a
good
colortelevisionset,
dueto
itsresponsecurve;showing
theallowable
amount
of
attenuation
for
eachmulti-burst
frequency.Rememberthat
—
6dBequalshalfthereference
voltage
(the
2.0MHz
modulation
should
be
used
for
reference).
15
NO.18
-HORIZ.SYNC.PULSE
VERTICAL
BLANKINGINTERVAL
(NO
1
~
N021)
LINE
NO.17
3,58MHZ
NO
279
NO
280
•VERTICAL
BLANKINGINTERVAL
(NO263
~
NO
282)
(MULTI-BURST)
0,5
1
2
3
3,58
4,2
MHZ
NO
17
NO
279
N018
NO
280
RESPONSE-dB
FREQUENCY—MHz
Fig.
14.
ColorTVIFamplifier
response
curve

Tolocalizetrouble,start
by
observingtheVITS
at
the
videodetector.This
will
localizetrouble
toa
point
either
before
or
afterthedetector.
If
thepicturequality
of
each
channel
is
different,thetrouble
isin
thetuner
or
antenna
system.
Ifthepicturequalityisthesameforallchannelsbut
themulti-burstisabnormal,thenthetroublemaybe
in
the
IF
stage.
As
anotherexample,letusassumethatwehave
a
set
on
the
benchwith
a
very
poor
picture.
Our
oscilloscope
shows
theVITSatthevideodetectortobe
about
normalex-
cept
thattheburst
at
2.0MHz
is
lowcompared
to
other
burstsignals.ThissuggeststheIFtrapisdetunedintothe
passband,
chopping
outfrequencies
about
2MHz
belowthe
picture
carrierfrequency.Switchtoanotherchannel.Ifthe
amplifierrequiresrealignment.
If
thepicturequalityisthe
same,
thenourreasoningisright,andifthepicturequalityof
anotherchannelisnormal,theFMtrapatthetuner
input
is
misadjusted.
Fig.15showsthe
method
ofviewingtheVITS
waveforms.
VIDEO
START
WITH
2mS
See
text)
PICTURE
TUBE
Fig.
15.
Set-up
forviewingfields1 and2 of
VITS
information
1.
Seta
color
TV
receiver
tothe
stationtransmitting
colorsignalscontaining
VITS.
2.
The
method
shown
in
Fig.16isusedtoobtainField
2
vertical
signal
on
CH1.
3.
Settheoscilloscopeandthereceiver
for
operation.
ConnecttheCH
1
probe
(setat10
:
1)tothetest
point
ofvideodetector
or
otherdesiredtest
point
inthe
videosection
of
thetelevisionreceiver.
4.
SettheSYNCswitchasfollows:
A.
If
thesyncandblankingpulses
of
theobserved
videosignal
are
positive,use
theTV+
switch
position.
B.
If
thesyncandblankingpulsesarenegative,use
theTV—switchposition.
5.
AdjustthesweeptimeVARIABLEcontrol
so
that
2
vertical
fieldsaredisplayedontheoscilloscopescreen.
6.ConnecttheCH2
probe
(setto10
:
1)tothesametest
point
asdoestheCH1
probe.
7.Setthe
MODE
switch
to
DUALposition.
8.PlacethesweeptimeVARIABLEintheCALposition.
9.
Setthe
SWEEPTIME/DIVcontrol
tothe
0.1ms
position
to
expandthedisplay.TheVITSinformation
will
appeartowardtherighthand
portion
of
theex-
panded
waveformdisplays.Thewaveforminforma-
tion
on
eachtracemayappearasshown
in
Fig.
13.
Because
thereisnoprovisionforsynchronizingtheos-
cilloscope
display
to
either
ofthe
twofieldswhich
comprise
a
completeverticalframe,
it
cannot
be
predictedwhichfielddisplay
will
appear
on
CH1
or
CH2.
10.
Pull
the
<>POSITION
controloutward
to
obtain
an
additional
X 5
magnification.Rotatethecontrol
mov-
ingthetracetotheleftuntiltheexpandedVITSinfor-
mationappearsasshown
in
Fig.
13.
Because
of
the
lowrepetitionrateand
the
high
sweepspeedcom-
bination,thebrightnesslevelofthesignaldisplays
will
bereduced.
11.
OncetheCH1andCH2displayshavebeenidentified
16
VERTICAL
SYNC
PULSE
VERTICAL
BLANKING
l
F
AMP VIDEO
DETECTOR
VI
DEO
AMP VIDEO
AMP
SOUND
IF
COLOR'
I
F
TELEVISION
SET

as
being
eitherField
1 or
Field
2
VITSinformation,the
probe
corresponding
tothe
waveformdisplaycan
be
used
for
signal-tracing
and
troubleshooting,
andthe
remaining
probe
should
be
left
atthe
videodetector
test
point
to
ensurethat
the
syncsignal
isnotin-
terrupted.
Ifthe
syncsignal
is
interrupted,
the
waveformdisplays
maybe
reversedbecause,
as
previouslyexplained,there
isno
provision
intheos-
cilloscope
to
identifyeither
ofthetwo
verticalfields
which
comprise
a
completeframe.
SINGLE-CHANNEL
APPLICATIONS
Introduction:
In
addition
to
thedual-traceapplicationspreviouslyout-
lined,
thereare,
of
course,manyservicing
and
laboratory
applicationswhereonlysingle-trace
or
single-channel
operation
ofthe
oscilloscope
is
required.
By
setting
the
MODE
switch
toCH2and
using
theCH2
amplifier,many
flexible
operations
will
be
achieved;and,
in
addition,
by
plac-
ing
the
MODE
switch
to
SUBposition(with
the
CH
1
DC-
GND-AC
switch
in
the
GND
position),whateverwaveform
is
obtained
canbe
inverted
in
polarity
if
desired
bythe
operator.
TelevisionServicing:
Atriggeredsweeposcilloscope
is
advantageous
in
ser-
vicing
and
aligningtelevisionreceivers.Thisoscilloscope
also
includesseveralfeaturesthatwereincorporated
to
maketelevisionservicingeasierobservation
and
more
com-
prehensive.
*
With
the
SYNCswitch
settoTV
position,
the
SWEEP
TIME/DIVcontrolautomatically
selects
theTV
vertical
sync
at
sweepspeedsappropriateforviewingframesand
TV
horizontalsync
at
sweepspeedsappropriate
for
view-
inglines.
*
Wide
bandwidth
for
high
resolutionvideoand
high
speed
pulsepresentation.
Single-traceOperationandPeak-to-Peak
VoltageReadings:
For
generaltroubleshooting
and
isolation
of
troubles
in
television
receivers,
the
oscilloscope
isan
indispensable
in-
strument.
It
provides
a
visualdisplay
ofthe
absence
or
presence
of
normalsignals.This
method
(signal-tracing)
may
be
used
to
trace
a
signal
by
measuringseveralpoints
in
thesignalpath.
As
measurementsproceedalongthesignal
path,
a
point
maybe
found
where
the
signaldisappears.
When
thishappens,thesource
of
troublehasbeenlocated.
However,
the
oscilloscopeshowsmuch
more
than
the
merepresence
or
absence
of
signals
. It
provides
a
peak-to-
peakvoltagemeasurement
of
thesignalaswellaspresenta-
tion
of
waveforms.
The
schematicdiagram
or
accom-
panyingservicedata
on
the
equipment
being
servicedusual-
ly
includeswaveformdiagram.Thiswaveformdiagram
includes
the
requiredsweeptime
andthe
normal
peak-to-peakvoltage.Compare
the
peak-to-peakvoltage
readings
onthe
oscilloscopewiththoseshown
onthe
waveformdiagram.
CompositeVideo
Waveform
Analysis:
Probablythemostimportantwaveformintelevisionser-
vicing
isthe
compositewaveformconsisting
ofthe
video
signal,
theblankingpedestalsignalandthesyncpulses.
Fig.
17
andFig.18
showtypicaloscilloscopetraceswhen
observingcompositevideosignalssynchronizedwith
horizontalsyncpulses
and
verticalblankingpulses.Com-
positevideosignalscan
be
observedatvariousstages
of
the
television
receiver
to
determinewhethercircuitsareperfor-
ming
normally.Knowledge
of
waveformmakeup,
the
apperance
ofa
normalwaveform,
and
thecauses
of
various
abnormalwaveformshelp
the
technicianlocate
and
correct
manyproblems.
The
technicianshouldstudysuch
waveforms
ina
televisionreceiverknown
tobein
good
operatingcondition,
noting
the
waveform
at
variouspoints
in
the
videoamplifier.
TELEVISION
SET
Fig.16.
Set-up
for
viewing
horizontal
fields
of
composite
video
signal
17
HORIZONTAL
SYNC
PULSE
HORIZONTAL
BLANKING
PULSE
IF
AMP VIDEO
DETECTOR
VIDEO
AMP VIDEO
AMP
PICTURE
TUBE
SOUND
IF
COLOR
IF
I

VIDEO
VIDEO
DETECTOR
TELEVISION
SET
VIDEO
AMP
SOUND
IF
PICTURE
TUBE
COLOR
IF
Fig.
17.Set-upfor
viewingvertical fields
ofcompositevideo
signal
13.
Push
in
theTRIGGERING
LEVEL
controlandrotate
to
a
positionthatprovides
a
wellsynchronizeddisplay.
14.
Adjust
the
INTENSITY
and
FOCUScontrols
for
the
desiredbrightnessandbestfocus.
15.
To
view
a
specific
portion
of
thewaveform,such
as
thecolorburst,pullthe
^
•POSITIONcontrol
forX5
magnification.Rotatethesamecontrolleft
or
rightto
select
thedesired
portion
of
thewaveform
to
beview-
ed.
16.
Thepolarity
of
theobservedwaveformmayberevers-
edwhen
moving
from
one
monitoring
point
to
another;therefore,
it
maybenecessary
to
reversethe
polarity
of
theSYNC
switch.
Sync
Pulse
Analysis:
The
IF
response
ofa
televisionreceiver
canbe
evaluated
to
someextent
by
carefulobservation
of
the
horizontalsyncpulsewaveform.
The
appearance
Of
the
sync
pulsewaveformisaffectedbytheIFamplifierbandpass
characteristics.
Sometypicalwaveformsymptomsandtheir
relation
toIF
amplifierresponse
are
indicated
in
Fig.
18.
Sync
pulsewaveformdistortions
produced
by
positive
or
negativelimiting
in
IFoverloadconditionsareshown
in
Fig.
19.
18
VERTICAL
SYNC
PULSE
VERTICAL
BLANKING
IF
AMP VIDEO
AMP
Toset
up
theoscilloscope
for
viewingcompositevideo
waveforms,usethefollowingprocedures:
1.
Tune
the
televisionset
toa
localchannel.
2.
Setthe
MODE
switch
to
CH2position.
3.
SettheSWEEPTIME/DIVswitchtothe10/usposition
forobservingTVhorizontallinesortothe2msposition
forobserving
TV
verticalframes.
4.
SettheSYNCswitch
to
the
TV+
position.
5.
SettheSOURCEswitch
to
theCH2position.
6.
Setthe
TRIGGERING
LEVEL
control
to
the
AUTO
position.
7.SettheCH2
AC-GND-DC
switch
to
the
AC
position.
8.Connect
a
probe
cable
tothe
CH2
INPUT
jack.
Connectthe
ground
clip
of
the
probe
to
thetelevision
set
chassis.
With
the
probe
set
to10
: 1
attenuation,connectthe
tip
of
the
probe
to
the
videodetector
output
of
the
television
set.
9.
SettheCH2VOLTS/DIVswitchforthelargestvertical
deflectionpossiblewithout
going
off-scale.
10.
RotatetheTRIGGERING
LEVEL
control
toa
position
thatprovides
a
synchronizeddisplay.
11.
AdjustthesweeptimeVARIABLEfortwohorizontal
lines
ortwo
vertical
frames
of
compositevideodisplay.
12.
If
thesyncandblankingpulses
of
thedisplayedvideo
signals
arepositive,settheSYNCswitch
to
theTV-f-
position;
if
thesyncandblankingpulsesarenegative,
use
theTV—position.

Fig.
18.
Analysis
ofsyncpulsedistortion
FM
RECEIVER
ADJUSTMENTS
1.
Connect
a
sweepgenerator
to
themixerinput
of
the
FMreceiver.Setthesweepgeneratorfor
a
10.7MHz
center
sweep.
2.
Connect
the
sweepvoltageoutput
ofthe
sweep
generator
to
theCH2input
jack
of
theoscilloscope
andsettheoscilloscopecontrolsforexternalhorizon-
tal
sweep(SWEEPTIME/DIV
to
X-Y).
3.
Connecttheverticalinputprobe
to
thedemodulator
input
of
the
FM
receiver.
4.
Adjust
the
oscilloscopevertical
and
horizontalgain
controlsfordisplaysimilartothatshown
in
Fig.20A.
5.
Setthemarkergeneratorprecisely
to
10.7MHz.
The
marker"pip"shouldbeinthecenter
of
thebandpass.
NORMAL
SYNC
PULSE
SYNC
PULSE
COMPRESS
ION
CAUSED
BY
L
IMITING
"WHITE"
SATURAT
ION
CAUSED
BY
L
IMITING
6.AligntheIFamplifiersaccordingtothemanufacturer's
specifications.
7.
Move
theprobe
to
thedemodulatoroutput.The"S"
curve
should
be
displayed,and
the
10.7MHz
"pip"
shouldappear
in
thecenter(seeFig.20B).
Adjust
the
demodulatoraccording
tothe
manufac-
turer's
instructionssothemarkermovesanequaldis-
tance
from
the
center
asthe
markerfrequency
is
amplifiedanequalamountfromthe
10.7MHz
center
frequency.
Fig.
20.
Typical
FM
receiveralignment
set-up
19
Fig.
19.
Sync
pulsewaveforms
CIRCUIT
DEFECT
HORIZONTAL
PULSE
DISTORTION
OVERALL
RECEIVER
FREQUENCY
RESPONSE
EFFECT
ON
PICTURE
NORMAL
CIRCUIT
PICTURE
NORMAL
LOSS
OF
HIGH
FREQUENCY
RESPONSE
LOSS
OF
PIC-
TURE
DETAIL
EXCESSIVE
HIGH
FREQUENCY
RE-
SPONSE,
NON-
LINEAR
PHASE
SHIFT
FINE
VERTICAL
BLACK
t
WHITE
STRIATIONS
FOL-
LOWING
A
SHARP
CHANGE
IN
PIC-
TURE
SHADING
LOSS
OFLOW
FREQUENCY
RESPONSE
CHANGE
IN
SHA-
DING
OF
LARGE
PICTURE
AREAS;
SMEARED
PIC-
TURE
MARKER
GENERATOR
SWEEP
GENERATOR
MARKER
INPUT
RF
OUT
SWEEP
VOLTAGE
RF
MIXER
l-F
AMPS
DEMODULATOR
AUDIO
AMPS
OSC FM
RECEIVER
DIRECT
Table of contents
Other Trio Test Equipment manuals