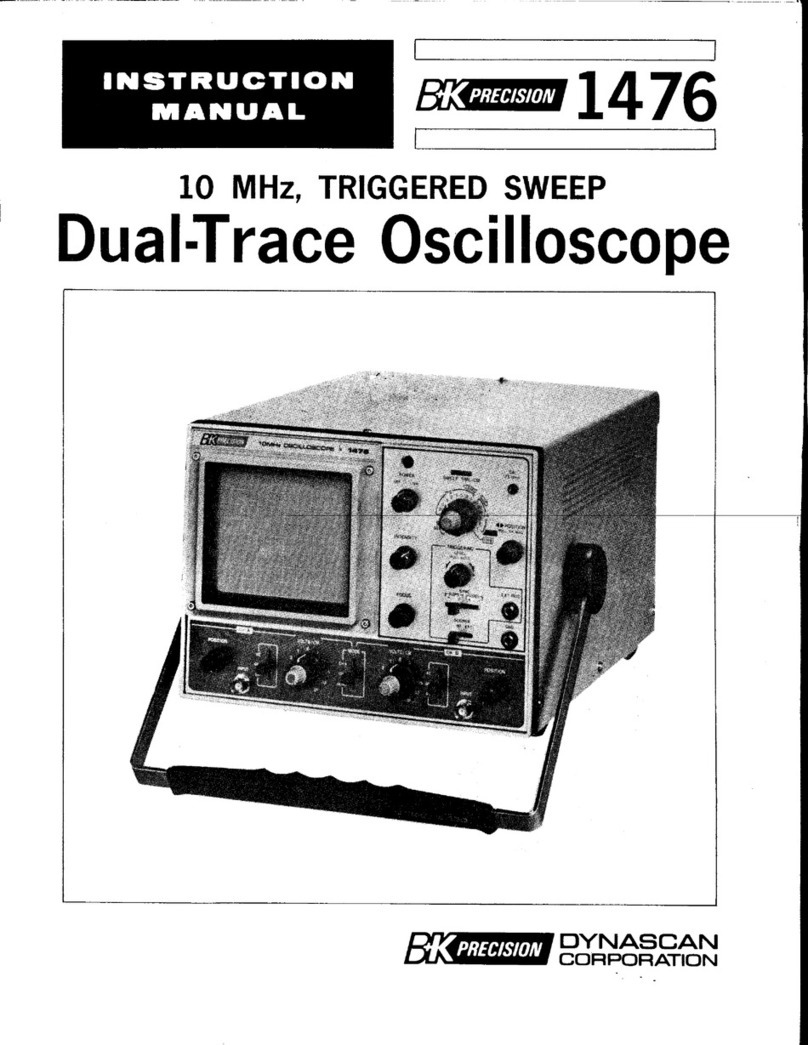
Trio CS-1566A User manual

TRIGGEREDSWEEPOSCILLOSCOPE
HIGH
STABILITY
CS-1566A
DUAL
TRACEOSCILLOSCOPE
INSTRUCTION
MANUAL
TRIO

FEATURES
*Vertical
axis
with
widebandwidth(20MHz,—3
dB)
and
high
sensitivity(5mV/div,1 div= 1
cm).
*Distortion-freedisplayofsignalsupto20MHz
onthe
full
areaofCRTscreen.
*HighsensitivityCRT(rectangular
with
internal
graticule)
with
excellentbeampermeabilityhas
sufficientbrightnessformeasurementsof
high-speedpulsesof
high
frequencies.
*The
high
voltagepowerforCRTaswellthe
powerforothercircuitsis
fully
stabilized
because
oftheuseof
DC-DC
converter,thusthe
sensitivityandbrightnessarecompletelyfree
from
effectsofvoltagevariations.
*X-Yoperationispossible
with
CH2amplifier
used
asX
axis.
Thehorizontal
axis
sensitivityis
as
high
as5mV/div.
*ALTand
CHOP
operationsfordual-trace
observation.
*The
time
baseswitchallowschangeover
betweenV (vertical)andH (horizontal)of
VIDEO
sync
separatorcircuit,automaticallyand
electronically.
*INT,CH1,CH2,
LINE
andEXTcanbe
individuallysynchronizedforselectionofdesired
syhc
signals.
*AtAUTO
position
of
TRIG
LEVEL,
itispossible
tocheckthebrightnessatno-signal
time
andto
adjust
triggering
levelof
input
waveforms.
*The
adoption
ofICs
throughout
assures
high
performanceandimprovedreliability.
Page
FEATURES
2
SPECIFICATIONS
3
CONTROLS
ON
PANELS
5
FrontPanel6
Rear
Panel8
OPERATION
8
PreliminaryOperation8
OperatingProcedures9
MeasurementofPulseRising(Falling)Time9
APPLICATIONS
10
Dual-traceApplications10
Single-channel
Applications19
FM
ReceiverAdjustments22
X-Y
OperationApplications22
AmplifierSquareWave
Test
24
PRECAUTIONS
29
MAINTENANCE
AND
ADJUSTMENT
29
Maintenance29
Adjustment30
SCHEMATIC
DIAGRAM33
CONTENTS
2

SPECIFICATIONS
Cathode
RayTube
Type:
C5S106P31B
Acceleration
voltage:
2
kV
Scale:
8
divx10div(1div= 9.5mm)
Vertical
Amplifier(forBothCHIandCH2)
DeflectionFactor:
5
mV/divto20V/div±5%
Attenuator:
5
mV/divto20V/div.1-2-5sequence
Precisely
adjustableinall12ranges.
Sensitivity
errorbetweenrangesis±5%.
Input
impedance:
1
Mil ±2%
Inputcapacitance:
Approx.27pF
Frequency
response:
DC
DCto20MHz
(less
than-3dB)
[5
mV/div~ 10V/div]
AC
2 Hzto20MHz
(less
than-3dB)
[5
mV/div~ 10V/div]
Risetime:
Less
than17.5
nsec.
Overshoot:
Less
than3%(at100kHzsquare
wave)
Cross-talk:
ALT
Less
than—60dB
CHOP
Less
than-50dB
Operatingmodes:
CH1
CH1only
CH2
CH2only
ALT
2-channel
with
ALT(alternatesweep)
CHOP
2-channel
with
CHOP
ADD
2-channelalgebraicsum
(CH1
+ CH2)
CHOP
frequency:
Approx.200kHz
Maximum
inputvoltage:
600
Vp-por300V(DC+ ACpeak)
Invertpolarity:
CH2
only
Sweep
Circuit
Sweep
system:
Triggeringsweepandautosweep(free-running
sweep
atno-signaltime)
Sweep
time:
0.5Ms/divto.5s/div±5%andX-Y.1-2-5
sequence
Fine
adjustmentinall19ranges
Magnification:
10
times±5%
(PULL
x 10MAG).
Linearity:
Better
than3%(2/zs/divto0.5s/div)
Better
than5%(0.5^s/divto1 ^s/div)
Better
than10%( x 10MAG)
Triggering
Source:
••-•••:.-y^
INT.
CH1.CH2.
LINE,
EXT
Slope:
NORM
Positiveandnegative
VIDEO
Positiveandnegative
(LINE
and
FRAME
automaticallyselectedby.
SWEEP
TIME/DIV)
LINE
(TV-line):
0.5
ns/Div
to50
Ats/div
FRAME
(TV-Frame):
0.1ms/divto
0.5s/div
Sensitivity:
Trigger
Type
Bandwidth
Minimum
Sync
Voltage
Trigger
Type
Bandwidth INT
EXT
NOR 50Hz~15MHz
20Hz~20MHz
0.5div
1.0div
0.5Vp-p
1.0Vp-p
AUTO
50Hz~15MHz
20Hz~20MHz
0.5div
1.0div
0.5Vp-p
1.0Vp-p
VIDEO VIDEO
signal 1.0div 1.0Vp-p
External
triggeringinputvoltage:
50V
(DC+ ACpeak)
HorizontalAmplifier(CH2input)
Operatingmodes:(Exceptx 10MAG)
X-Y
modeisselectedby
SWEEP
TIME/DIV.
CH1:
Y
axis
CH2:
X
axis
DeflectionFactor:
Same
asCH1(5mV/divto20V/div±5%)
Frequency
response:
DC
DCto2 MHz
(less
than-3dB)
AC
2 Hzto2 MHz
(less
than-3dB)
Inputimpedance:
Same
asCH1(1MS2±2%)
Inputcapacitance:
Same
asCH1Approx.27pF
X-Y
phasedifference:
Less
than3°at70kHz
3

CalibratingVoltage
0.1V±3%(atreferencelevelOV)
1
kHz±3%(squarewave,positive)
IntensityModulation
Input
voltage:
TTL
level
Input
impedance:
15
ktt±20%
Bandwidth:
DC
to5 MHz
Maximum
input
voltage:
50V
(DC+ ACpeak)
Trace
Rotation
Trace
angleisadjustablebypanelsurfacead
justor.
PowerRequirements
Power
supplyvoltage:
100/120/220/240V
±10%.50/60Hz
Power
consumption:
47W
Dimensions
Width.
260
mm(277mm)
Height:
190
mm(204mm)
Depth:
328
mm(393mm)
Figures
in( ) showmaximum
sizes.
Weight:
8.4kg
Accessories
Probe
(PC-22)
2
Damping:1/10
Input
impedance:10MQ
Input
capacitance:
Less
than18pF
Instructionmanual1
Replacement
fuse:
0.5A2
0.8Ao
4

CONTROLSONPANELS
FRONTPANEL
Fig.1
REAR
PANEL
Fig.2
5

FRONT
PANEL
1.
^
POSITION
Vertical
position
adjustmentforChannel1 trace.
Becomes
vertical
position
adjustmentwhen
SWEEP
TIME/DIVswitch(21)isintheX-Yposi-
tion
(X-Yoperation).
2.
INPUT
Vertical
input
terminalforCH1(orinX-Ymode).
3.
AC-GND-DC
AC:
BlocksDCcomponentof
input
signal.
GND:Openssignalpathand
ground
input
to
verticalamplifier.Thisprovidesa zero-
signalbaseline,the
position
ofwhichcan
beusedasa referencewhen
performing
DC
measurement.
DC:
Direct
input
ofACandDCcomponentof
input
signal.
4.VOLTS/DIV
VerticalattenuatorforChannel1 whichprovides
stepadjustmentofverticalsensitivity.Vertical
sen-
sitivityiscalibratedin12steps
from
5 mVto20
voltsperdivwhen
VARIABLE
control
(5)issetto
CAL
position.This
control
adjustsvertical
sen-
sitivitywhenthe
SWEEP
TIME/DIVswitch(21)is
intheX-Y
position
(X-Yoperation).
5.VARIABLE
Verticalattenuatoradjustmentprovidesfine
control
ofverticalsensitivity.Intheextremeclockwise
(CAL)
position,theverticalattenuatoriscalibrated.
This
control
becomesthefineverticalgain
control
whenthe
SWEEP
TIME/DINswitch(21)isinthe
X-Y
position.
6.MODE
Five-positionleverswitch;selectsthebasic
operatingmodesoftheoscilloscope.
CH
1:Onlythe
input
signaltoChannel 1 isdis-
playedasa singletrace.
CH
2:Onlythe
input
signaltoChannel2 isdis-
playedasa singletrace.
ALT:
Dual-traceoperation,inwhichsweep
alternatelydisplaysChannel1,then
Channel
2,
input
signal.Recommended
forsweeptimesof0.5ms/divto0.5/is/
div.
CHOP:
Dual-traceoperationinwhichsweepis
choppedatapproximate200kHzrateand
switchedbetweenChannel1 andChannel
2
traces.Recommendedforsweeptimes
of0.5s/divto1 ms/div.
ADD:Thewaveforms
from
Channel1 and
Channel
2 inputsareaddedandthesumis
displayedasa singletrace.Whenthe
Channel
2
POSITION
control
ispulled
(PULL
INVERT),
thewaveform
from
Channel
2 issubtracted
from
theChannel
1
waveformandthedifferenceisdis-
playedasa singletrace.
7.VOLTS/DIV
VerticalattenuatorforChannel2 whichprovides
coarse
adjustmentofverticalsensitivity.Vertical
sensitivityiscalibratedin12steps
from
5 mVto20
voltsperdivwhen
VARIABLE
control
(8)issetto
theCALposition.
8.VARIABLE
Verticalattenuatoradjustmentprovidesfine
control
ofverticalsensitivity.Intheextremeclockwise
(CAL)
position,theverticalattenuatoriscalibrated.
9.AC-GND-DC
AC:
BlocksDCcomponentof
input
signal.
GND:
Openssignalpathandgrounds
input
to
verticalamplifier.Thisprovidesa zero-
signalbaseline,the
position
ofwhichcan
beusedasa referencewhen
performing
DC
measurements.
DC:
Direct
input
ofACandDCcomponentof
input
signal.
10.INPUT
Vertical
input
terminalforCH2orX
input
terminal
forX-Yoperation.
11.
y POSITION,X-Y<+,
PULL
INVERT
Vertical
position
adjustmentforChannel2 trace.
Becomes
horizontal
position
adjustmentwhen
SWEEP
TIME/DIVswitch(21)isintheX-Yposi-
tion
(X-Yoperation).
Whentheknobispulled
(PULL
INVERT),
theCH2
polarity
isinverted.
12.
POWERLAMP
Glows
whenoscilloscopeisturnedon.
13.
POWER
Power
ON/OFF
switch.ThepowerisONwhenthe
knobissetto
right.
14.INTENSITY
Adjuststhebrightnessofspotsandwaveformsfor
easy
viewing.Whentamedtothe
left
waveform
will
disappear.
6

15.
FOCUS
Spotfocus
control
to
obtain
optimum
waveform
accordingtobrightness.
16.EXTTRIG
External
trigger
terminal.Forexternaltriggering,
set
SOURCE
(17)toEXTandapplyexternal
triggering
voltage.
17.
SOURCE
Five-positionleverswitchselects
triggering
source
forsweep.
INT:
InCH2 mode,Channel2 signalbecomes
trigger.
InCH1,ALT,
CHOP,
andADD
mode,Channel1 signalbecomes
trigger.
CH
1:Channel1 signalbecomes
trigger
inail
modes.
CH
2:Channel2 signalbecomes
trigger
inall
modes.
LINE:
Linevoltagebecomes
trigger.
EXT:
Signalappliedat
EXT
TRIG
jackbecomes
trigger.
18.SYNC
Four-positionleverswitch
with
the
following
positions:
SLOPE:
The
SLOPE
positionsareusedforviewing
allwaveformsexcepttelevisioncomposite
videosignals.
(-+-):Sweepis
triggered
onpositive-
going
slopeofwaveform.
(
—):
Sweepis
triggered
onnegative-
going
slopeofwaveform.
SYNC
SWITCH
VIDEO
( + )
VIDEO
( —)
VIDEO:
Inthe
VIDEO
positions,thesyncpulsesof
a
compositevideosignalareusedto
trigger
thesweep;theverticalsyncpulses
(frame)
areautomaticallyselectedfor
sweep
timesof0.5s/divto0.1ms/div,
andhorizontalsyncpulses(line)are
automaticallyselectedforsweeptimesof
50
/xs/divto0.5/ns/div.
(
+
):
Sweepis
triggered
onpositive-
going
syncpulse.
(
—):
Sweepis
triggered
onnegative-
going
syncpulse.
19.
LEVEL,
PULL
AUTO
Sync
leveladjustmentdeterminespointson
waveformslopewheresweepstarts;(
—)
equals
mostnegative
point
of
triggering
and(+)equals
mostpositive
point
oftriggering.
PULL
AUTO:
Push-pullswitchselectsautomatic
triggering
when
pulledout
(PULL
AUTO).
Whenautomatic
trigger-
ing,a sweepisgeneratedeven
without
an
input
signal.
20.««•POSITION,
PULL
X10MAG
Rotationadjustshorizontal
position
oftraces
(both
traces
whenoperatedinthedualtracemode).
PULL
X10MAG:
Push-pullswitchselectsX10magnificationwhen
pulledout
(PULL
X10MAG);normalwhenpushed
in.
21.
SWEEP
TIME/DIV
Horizontalcoarsesweep
time
selector.Selects
calibratedsweeptimesof0.5^s/div(microsecond
perdivision)to0.5s/divin19stepswhen
VARIABLE
control
(22)issettotheCAL
position
(fullyclockwise).IntheX-Yposition,thisswitch
disables
theinternalsweepgeneratorandpermits
theCH2
input
toprovidehorizontaldeflection(X-Y
operation).TheChannel1
input
signalproduces
verticaldeflection(Y
axis)
andtheChannel2
input
signalproduceshorizontaldeflection(X
axis).
22.
VARIABLE
Fine
sweep
time
adjustment.Intheextreme
clockwise
(CAL)
position
thesweep
time
is
calibrated.
23.
CAL1 kHz,0.1Vp-p
Provides
calibrated1 kHz,0.1
volt
peak-to-peak
square
wave
input
signal.Thisisusedforcalibra-
tion
oftheverticalamplifierattenuatorsandto
check
thefrequencycompensationadjustmentof
theprobesused
with
theoscilloscope.
7
Fig.
3

24.GND
Groundterminalfortheoscilloscope.
25.TRACE
ROTATION
Used
toadjustthepositionofhorizontaltrace.
26.
HANDLE
This
handlealso
serves
asa standoftheos-
cilloscope.
REAR
PANEL
27.
AC
VOLTAGE
SELECTOR
Plug
typeACvoltageselectortooperatetheos-
cilloscope
onspecificpowersupplyvoltage,
100/117/220/240V.
28.FUSE
HOLDER
Fuse
ratedat1Ashouldbeusedfor100/117V
operation.Foroperationon220/240V,besureto
use
a 0.5A
fuse.
29.
POWERCONNECTOR
For
connectionofthesuppliedACpowercord.
30.Z AXISINPUT
Intensitymodulationterminal.TTLlogic-
compatible,highlogicincreasebrightnesslowlogic
decrease
brightness.
31.
CORD
REEL
Windpowercordwhentheoscilloscopeistobe
carried
orstored.
They
also
serve
asa standwhen
theoscilloscopeisusedin
upright
position.
OPERATION
PRELIMINARY
OPERATION
When
operatingthisoscilloscope,refertopanelcontrolsandtheirfunctions.Whenstartingthisoscilloscope
set
initially,settheoperatingcontrolsasfollowsandthesetmaybeturnedonsafely.
Fig.
4
8

OPERATING
PROCEDURES
1.
Selectthepositionofthepowervoltage
selec-
torplugasindicatedbythearrowmarks.Then
insertthesuppliedpowercordtothepower
connector.
2.
Turn
POWER/SCALE
ILLUM(13)clockwise.
The
poweristurnedtoONand
POWER
lamp
(12)
lights.
3.
Horizontal
axis
willbedisplayed.Whentrace
does
notappearatthecenterofthe
screen,
adjust^
POSITION
(1)and
POSITION
(20).
Adjustbrightness
with
INTENSITY
(14).If
trace
isunclear,adjust
FOCUS
(15).
4.
Theoscilloscopeisnowreadyformeasure-
ment.Formeasurement,proceedasfollows:
Applysignalvoltagestothe
INPUT
terminals
(2),
(10).Then
turn
VOLTS/DIV
(4)clockwise
until
thewaveformiscorrectlydisplayedon
thescope.BysettingMODE(6)and
SOURCE
(17)
toCH1,theCH1
input
signaltothe
INPUT
terminal(2)willappear.Similarly,by
settingMODEand
SOURCE
toCH2,thenthe
input
signaltotheCH2terminal(10)will
appear,
atALTor
CHOP
position,two
waveforms
(CH1andCH2)willappearonthe
scope.
With
SOURCE
(17)settoCH1,the
CH1
input
signal
from
the
INPUT
terminal(2)
is
fedtothetriggercircuitwheretheCH1
signal
istriggered.Similarly,when
SOURCE
is
set
toCH2,theCH2signalistriggered.
MEASUREMENTS
OF
PULSE
RISING
(FALLING)
TIME
The
scales
10%and90%ontheCRTscreenare
used
foraccuratemeasurementsofpulserising
(falling)time.Tomeasurepulserisingtime,
proceedasfollows:
1.
Witha pulsesignalappliedtothe
input
terminal,adjust
VOLTS/DIV
(4)[7]and
VARIABLE
(5)[8]sothatthepulseamplitude
is
settothe0 and100%
scales.
2.
Turn
SWEEP
TIME/DIV
(21)tomagnifythe
rising
portion
ofthewaveformaslargeas
possible
[VARIABLE
(22)shouldbesettoCAL
position].
3.
Adjust
POSITION
(20)tosetthe
waveforms
at10%and90%tothevertical
center
scale
respectively,thenmeasure
T1
and
T2
usingthehorizontalcenter
scale.
Thepulse
rising(falling)timeisT1+ T2.
Use
eithermethodforeasierobservation.
AtADDposition,algebraicsumofCH1and
CH2
isobtained.When
PULL
INVERT
(11)
knobispulled,theCH2signalinreverse
polarityisaddedtotheCH1signalinreverse
polarityisaddedtotheCH1signalandthe
algebraic
differencebetweenCH1andCH2is
displayed
(SUB).
5.
Whenthesignalvoltageismorethan5 mV
andwaveformfailstoappearonthe
screen,
theoscilloscopemaybecheckedbyfeedingin-
put
from
CAL1 kHz,0.1Vp-p(23).
Since
calibrationvoltageis1 Vp-p,thewaveform
becomes
5 divhighatthe20mV/divposition.
6.
Bypushing
TRIG
LEVEL
(20),thefree-running
autofunctionisreleased.Thewaveformdis-
appears
whentheknobisturnedclockwise,
andappearsagainwhenitisreturnedtoitsap-
proximatemiddlepositionofit.
Sync
phaseis
also
adjustableinthis
case.
Thewaveformwill
againdisappearwhentheknobisturned
counterclockwise
from
themiddleposition.
7.
WhenDCcomponentismeasured,set
AC-GND-DC
(3)or(9)toDCposition.If,in
this
case,
theDCcomponentcontainsplus
"+ " potential,thewaveformmovesupward
andifitcontainsminus" —"potential,the
waveformmovesdownward.
The
reference
point
of"0"potentialcanbe
checked
atGNDposition.
9

APPLICATIONS
DUAL-TRACE
APPLICATIONS
Introduction:
Themostobviousandyetthemostusefulfeature
ofthedual-traceoscilloscopeis
that
ithasthe
capabilityforsimultaneouslyviewingtwo
waveforms
that
arefrequencyorphase-related,or
that
havea commonsynchronizingvoltage,
such
as
in
digital
circuitry.Simultaneouslyviewingofinput
andits
output
isaninvaluableaidtothecircuit
designerortherepairman.Severalpossible
applicationsofthedual-traceoscilloscope
will
be
reviewedindetailtofamiliarizetheuserfurtherin
thebasicoperationofthisoscilloscope.
Frequency
DividerWaveformsViewing:
Fig.
5 illustratesthewaveforminvolvedina basic
divide-by-twocircuit.Fig.A indicatesthe
referenceorclockpulsetrain.Fig.B andFig.C in-
dicatethepossibleoutputsofthedivide-by-twocir-
cuitry.Fig.6 alsoindicatesthesettingsofspecific
oscilloscope
controlsforviewingthesewaveforms.
Inadditiontothesebasiccontrolsettings,the
TRIGGERING
LEVEL
control,aswellastheCH1
andCH2verticalpositioncontrolsshouldbesetas
requiredtoproducesuitabledisplays.Inthedraw-
ingofFig.5,thewaveformlevelsof2 divarein-
dicated.IfexactvoltagemeasurementsofCH1
andCH2aredesired,theCH1andCH2VARIABLE
controlsmustbeplacedintheCALposition.The
CH2
waveformmaybeeither
that
indicatedinFig.
5B
orFig.5C.InFig.5C,thedivide-by-twoout-
putwaveformisshownforthe
case
wheretheout-
putcircuitryrespondstoa negative-going
waveform.Inthis
case,
the
output
waveformis
shifted
with
respecttotheleadingedgeofthe
Fig.
5 Waveformsindivide-by-twocircuit
referencefrequencypulsebya
time
intervalcor-
respondingto thepulsewidth.Whenobserving
twosignalshaving
different
cyclesimiltaneously,
thesignalhavinglowcycleshouldbetriggered.
Divide-by-8CircuitWaveforms:
Fig.
6 indicateswaveformrelationshipsfora basic
divide-by-eightcircuit.Thebasicoscilloscopeset-
tingsareidenticaltothoseusedinFig.5.The
referencefrequencyofFig.6Aissuppliedto the
Channel
1 inputandthedivide-by-eight
output
is
appliedtotheCH2input.Fig.6 indicatesthe
time
relationshipbetweentheinputpulsesand
output
pulses.
Inanapplicationwherethelogiccircuitryis
operatingatornearitsmaximumdesignfrequency,
theaccumulatedrise
time
effectsofthecon-
secutive
stagesproducea
built-in
time
propagation
delaywhichcanbesignificantina criticalcircuit
andmustbecompensatedfor.Fig.6Cindicates
thepossible
time
delaywhichmaybeintroduced
into
a frequencydividercircuit.Byuseofthedual-
trace
oscilloscope,
theinputand
output
waveforms
can
besuperimposed(ADDorSUB)to determine
theexactamountofpropagationdelay
that
occurs.
10
A.
REFERENCE
FREQUENCY
PULSE
TRAIN
(1000
PULSES
PERSECOND)
LEADING
EDGES
MAYNOTBE
VISIBLE
AT
FAST
SWEEP
RATES
B.DIVIDE-BY-TWOOUTPUTSYNCHRONIZEDTO
LEADING
EDGE
OF
REFERENCE
PULSE
C
DIVIDE-BY-TWOOUTPUTSYNCHRONIZEDTO
TRAILING
EDGE
OF
REFERENCE
PULSE

PropagationDelayTimeMeasurement:
Anexampleofpropagationdelayina divide-by-
eightcircuitwasgiveninthepreviousparagraph.
Significantpropagationdelaymayoccurinanycir-
cuit
with
severalconsecutivestages.
This
os-
cilloscopehasfeatureswhichsimplifymeasure-
mentofpropagationdelaytime.Fig.7 showsthe
resultantwaveformswhenthedual-tracepresenta-
tion
iscombined
into
a single-tracepresentationby
selectingtheADD
position
oftheMODEswitch.
With
CH2
PULL.
INVERT
switchinthenormalposi-
tion
(pushedin)thetwoinputsarealgebraically
addedina single-tracedisplay.Similarly,inthein-
verted
position
(pulledout)thetwoinputsare
algebraicallysubtracted.Either
position
providesa
precise
displayofthepropagation
time
(Tp).Using
proceduresgivenforcalibrated
time
measurement.
Fig.
7 UsingADDmodepropagation
time
measurement
Tp
canbemeasured.A moreprecisemeasurement
can
beobtainediftheTp
portion
ofthewaveformis
expandedhorizontally.
This
maybedoneby
pulling
theX10MAGcontrol.Italsomaybepossibleto
viewthedesired
portion
ofthewaveformata faster
sweep
speed.
DigitalCircuitTimeDelayMeasurement:
A
dual-traceoscilloscopeisa necessityindesign-
ing,manufacturingandservicing
digital
equip-
ment.A dual-traceoscilloscopepermits
easy
com-
parisonof
time
relationshipsbetweentwo
waveforms.In
digital
equipment,itiscommonfor
a
largenumberofcircuitstobesynchronized,orto
have
a specific
time
relationshiptoeachother.
Manyofthecircuitsarefrequencydividersas
priviouslydescribed,butwaveformsareoften
time-relatedinmanyothercombinations.Inthe
dynamicstate,someofthewaveformschange,
depending
upon
the
input
ormoremodeofopera-
tion.
Ffg.
8 showsa typical
digital
circuitandidentifies
several
ofthepointsatwhichwaveformmeasure-
mentareappropriate.TheaccompanyingFig.8
shows
thenormalwaveformstobeexpectedat
each
ofthesepointsandtheir
timing
relationships.
The
individualwaveformshave
limited
valueunless
their
timing
relationshiptooneormoreoftheother
waveformsisknowntobecorrect.Thedual-trace
oscilloscopeallowsthiscomparisontobemade.In
typicalfashion,waveformNo.3 wouldbedisplayed
onCH1andwaveformNo.4
through
No.8 andNo.
10,
wouldbedisplayedonCH2althoughothertim-
ingcomparisonsmaybedesired.WaveformsNo.
11
through
No.13wouldprobablybedisplayedon
CH2.
Inthefamilyoftime-relatedwaveformsshownin
Fig.
9,waveformNo.8 orNo.10isexcellent
sync
source
forviewingallofthewaveforms;thereis
butone
triggering
pulseperframe.Forcon-
venience,
external
sync,
anyofthewaveformsmay
bedisplayed
without
readjustmentofthe
sync
con-
trols.
With
No.8 orNo.10usedasexternal
triggering
source,
anyofthewaveformsmaybedisplayed
without
readjustmentofthe
TRIG
LEVEL
control.
WaveformsNo.4
through
No.7 shouldnotbeused
as
the
triggering
sourcebecausetheydonotcon-
taina
triggering
pulseatthestartoftheframe.It
wouldnotbenecessarytoviewtheentire
waveformsasshowninFig.9 inall
cases.
Infact,
therearemanytimeswhena closerexaminationof
a
portion
ofthewaveformswouldbeappropriate.
EXPAND
THISPORTION
FOR
TIMEMORE
PRECISE
MEASUREMENT
11
A
REFERENCE
FREQUENCY
PULSE
TRAIN
(1000
PULSES
PERSECOND)
B
IDEALDIVIDEBYEIGHTOUTPUT
C
PROPAGATION
DELAY
INDIVIDEBYEIGHTCIRCUIT
Fig.
6 Waveformsindivide-by-eightcircuit
CH2
POLARITY
NORMAL
CH2
POLARITY
INVERT

Insuch
cases,
itisrecommended
that
thesyncre-
mainunchangedwhilethesweepspeedorX10
Fig.
8 Typical
digital
circuitusingseveraltime-relatedwaveforms
MAG
usedbetoexpanedthewaveformdisplay.
12

ANY
INDIVIDUAL
ADDRESS
ORFUNCTION
DATA
BITMAYBE
POSITIVE
OR
NEGATIVE
DEPENDING
UPONTHE
CODED
INPUT
SUB
= DISTORTION
ADJUST
POSITION
CONTROLS
TO
SUPERIMPOSE
WAVEFORMS
DIRECTLY
OVER
EACH'OTHER
Fig.
10Distortionmeasurement
T3
Fig.
9 Familyoftime-relatedwaveformsfromtypicaldigitalcircuitinFig.8
DistortionMeasurement:
An
amplifierstageoranentireamplifier
unit
may
be
measuredfor
distortion
with
thisoscilloscope.
This
typeofmeasurementisespeciallyvariable
when
theslopeofa waveformmustbefaithfully
reproducedbyanamplifier.Fig.10showsthe
testingofa circuitusinga triangular
wave,
such
as
is
typicallyencounteredintherecoveredaudio
out-
putof
limiting
circuitwhichprocedesthe
modulatoroftransmitter.Themeasurementmay
be
madeusinganytypeof
signal;
merelyusethe
typeofsignalfortestingthatisnormallyappliedto
theamplifierduringnormaloperation.The
procedurefor
distortion
testingisasfollows.
ADJUST
TOBOTH
WAVEFORMS
ARE
SAME
AMPLITUDE
AMP
No.1
AMP
No.2

1.
Applythetypeofsignalnormallyencountered
intheamplifierundertest.
2.
ConnectCH1probeto theinputofthe
amplifierandCH2probetotheoutputofthe
amplifier.Itispreferableifthetwosignalsare
notinvertedinrelationshipstoeachother,but
invertedsignalscanbe
used.
3
SetCH1andCH2AC-GND-DCswitchesto
AC.
4.SettheMODEswitchtoALTorCHOP.
5.Set
SOURCE
switchtoCH1andadjust
controls
asdescribedintheprocedurefor
synchronizing
waveforms.
6.AdjustCH1andCH2POSITIONcontrolsto
superimpose
thewaveformsdirectlyovereach
other.
7.AdjustCH1andCH2verticalsensitivity
con-
trols(VOLTS/DIVand
VARIABLE)
so
that
the
waveformsareaslargeas
possible
withoutex-
ceeding
thelimitsofthe
scale,
andso
that
bothwaveformsareexactlythesameheight.
8.Now,setthe
Mode
switchtoADDandthe
CH2
polarityswitchtothe
PULL
INVERT
posi-
tion.(Ifonewaveformisinvertedin
relationships
totheother,usethenormalCH2
polarity.)
Adjust
theverticalsensitivitycontrol(CH2
VARIABLE)
fortheminimumremaining
waveform.Anywaveform
that
remainsequals
distortions;
ifthetwowaveformsareexactly
thesameamplitudeandsamewaveformand
thereisnodistortion,thewaveformswill
cancel
andtherewillbeonlya straight
horizontallinewillremainingonthe
screen.
GatedRingingCircuit(burstcircuit)
The
circuitandwaveformofFig.11areshownto
demonstratethetypeofcircuitinwhichthe
dual-traceoscilloscopeiseffectivebothindesign
andtroubleshootingapplications.
Fig.
11showsa burstcircuit.The
basic
settings
areidenticalto thoseofinFig.5.
WaveformEAisthereferencewaveformandis
appliedtoCH1input.Allotherwaveformsare
sampled
atCH2andcomparedtothereference
waveformofCH
1.
Thefrequencyburstsignalcan
beexaminedmorecloselyeitherbyincreasingthe
sweep
time
perdivisionto 0.5msperdivisionorby
pullingthePOSITIONcontrolto obtain10
timesmagnification.Thiscontrolcanthenbe
rotatedasdesiretocenterthedesiredwaveform
informationontheoscilloscope
screen.
DelayLineTest:
The
dual-tracefeatureofthe
oscilloscope
canalso
beusedto determinethedelaytimesoftransmis-
sion
typedelaylinesaswellasultrasonictype
delay
lines.
Theinputpulsecanbeusedtotrigger
orsynchronizedtheCH1displayandthedelayline
outputcanbeobservedonCM2.Theinterval
betweenrepetitive
pulses
shouldbelargecom-
paredtothedelay
time
tobeobserved.Inaddition
todeterminingdelaytime,thepulsedistortionin-
herentinthedelaylinecanbedeterminedbyex-
aminationofthedelaypulseobservedonCH2
waveformdisplay.
Fig.
12showsthetypicaloscilloscopesettingsas
wellasthe
basic
testcircuit.Typicalinputandout-
putwaveformsareshownonthe
oscilloscope
dis-
play.Anypulsestretchingandripplecanbe
observed
andevaluated.Theresultsofmodifying
theinputandoutputterminationscanbeobserved
directly.
A
commonapplicationofthedelayline
checks
is
foundincolortelevisionreceiverstocheckthe"Y"
delaylineemployedinthevideoamplifiersection.
The
inputwaveformandoutputwaveformarecom-
paredfordelaytime,usingthehorizontal
sync
14
Fig.
11Gatedringingcircuitandwaveforms

pulseofthecompositevideosignalforreference.
The
indicateddelayisapproximatelyonemicrose-
cond.Thedelayisapproximatelyonemicrose-
cond.In
addition
todeterminingthedelay
characteristics
oftheline,the
output
waveform
reveals
any
distortion
that
maybeintroduced
from
an
impedancemismatchorgreatlyattenuated
out-
putresulting
from
anopenline.
PULSE
GENERATOR
5000PPS
sec.
PULSE
WIDTH
INPUT
ULTRA
SONIC
DELAY
LINE
(5Msec)
OUTPUT
Fig.
12Delaylinemeasurements
VIDEO
AMPLIFIER
USE
1/10
PROBE
FOR
BOTHCHANNELS
DELAY
LINE
*NOTE:SETTINGOF
VERTICAL"
ATTENUATORS
SHOULDBE
THE
SAME.BUTMAYVARY
WIDELY,
DEPENDINGONCIRCUIT
TYPE.
TO
HORIZONTAL
AMPLIFIER
TO
VIDEOOUTPUT
AMPLIFIER
NOTE:
NO
ELECTRICAL
CONNECTION:
PLACE
CLIP
ONINSULATIONOF
PLATE
CAP
LEAD
ORIN
CLOSE
PROXIMITYOF
HORIZONTALAMPLIFIER
TUBE.
Fig.
13Checking"Y"delaylineincolortelevisionreceivers
ImprovingtheRatioofDesiredtoUndesired
Signals:
Insomeapplications,thedesiredsignalmaybe
riding
ona largeundesiredsignalcomponentsuch
as
50Hz.Itispossibletominimizeorforpractical
purposeeliminatetheundesiredcomponent.Fig.
14showstheoscilloscopesettingsforsuchan
application.ThewaveformdisplayofCH1
indicatesthedesiredsignalandthe
dotted
line
indicatestheaverageamplitudevariation
ADJUST
FORONE
COMPLETE
CYCLE
AT
50Hz
SIGNAL
50Hz
START
WITH
CHOP
CHANGETOADD(CH2POLARITY
INVERT)
Fig.
14
Improvingdesired-to-undesiredsignalradio
15

correspondingtotheundesired50Hzcomponent.
The
CH2displayindicatesa waveformofequal
amplitudeandidenticalphasetotheaverageofthe
CH1
waveform.
With
theMODEswitchsetto
ADD
andtheCH1signalinverted,andbyadjusting
theCH2verticalattenuatorcontrol,and50Hz
componentoftheCH1signalcanbecancelledby
theCH2
input
andthedesiredwaveformcanbe
observed.
Stereo
AmplifierServicing:
Anotherconvenientusefora dual-traceoscil-
loscopeisin
troubleshooting
stereoamplifiers.If
identicalamplifiersareusedandthe
output
ofone
is
weak,
distorted
orotherwiseabnormal,the
dual-traceoscilloscopecanbeefficientlyusedto
localize
thedefectivestate.
With
anidentical
sig-
nal
appliedtotheinputsof
both
amplifiers,a
side-by-side
comparisonof
both
unitscanbemade
byprogressivelysamplingidenticalsignalpointsin
both
amplifiers.Whenthedefectiveormalfunctio-
ningstagehasbeenlocated,theeffectofwhatever
troubleshooting
andrepairmethodsareemployed
can
beobservedcanbeobservedandanalyzedim-
mediately.
Amplifier
Phase
ShiftMeasurements:
Phase
measurementscanbemadebyseveral
method
usingoscilloscopes.Typicalapplications
are
incircuitsdesignedtoproducea specificphase
shift,andmeasurementofphaseshift
distortion
in
audioamplifiersandnetwork.Inallamplifiers,a
phase
shiftisalwaysassociated
with
a changein
amplituderesponse.Forexample,atthe— 3 dB
response
points,a phaseshiftof45°occurs.
Phase
measurementscanbeperformedby
operatingtheoscilloscopeeitherinthedual-trace
modetomeasureamplifierphaseshiftdirectly.
Fig.
15illustratesthismethod.Inthis
case,
the
measurements
arebeingmadeatapproximately
5000
Hz.The
input
signaltotheaudioamplifieris
used
asa referenceandisappliedtotheCH1
input
jack.
The
VARIABLE
control
isadjustedasrequiredto
providea completecycleofthe
input
waveform
displayedon8 divhorizontally.A waveformheight
of2 divis
used.
The8 divdisplayrepresents360°
atthedisplayedfrequencyandeachdivision
represents
45°ofthewaveform.
The
signaldeveloped
accross
the
output
ofthe
audioamplifierisappliedtotheCH2
input
jack.
The
verticalattenuatorcontrolsofCH2are
adjustedasrequiredtoproducea peak-to-peak
waveformof2 divamplitudeasshowninFig.
15B.
TheCH2
POSITION
control
isthenadjusted
so
that
theCH2waveformisdisplayedonthesame
horizontal
axis
astheCH1waveformasshownin
Fig.
15B.Thedistancebetweencorresponding
pointsonthehorizontal
axis
forthetwowaveforms
thenrepresentsthephaseshiftbetweenthetwo
waveforms.
Inthis
case,
thezerocrossoverpoints
ofthetwowaveformsarecompared.Itisshown
that
a differenceof1 div
exists.
This
istheninter-
pretedasmeansa phaseshiftof45°.
Television
Servicing:
Manyofthetelevisionservicingprocedurescanbe
performedusingsingle-traceoperation.
These
are
outlined
laterintheapplicationssectioncovering
single-traceoperations.Oneoftheseprocedures,
viewingthe
VITS
(verticalintervaltestsignal),can
beaccomplishedmuchmoreeffectivelyusinga
dual-traceoscilloscope.As
outlined
inthe
single-traceapplicationssectionandasshownin
Fig.
16.the
information
ontheField1 andField2
verticalblankingintervalpulseisdifferent.
This
is
shownindetailinFig.16.Also,becausetheoscil-
loscopesweepissynchronizedtothevertical
blankingintervalwaveform,theField1 andField2
waveforms
aresuperimposed
onto
eachother.
With
dual-traceoperation,thesignal
information
oneachblankingpulsecanbeviewedseparately
without
overlapping.Fig.18indicatestheoscil-
16
ADJUST
AS
REQUIRED
FOR
COMPLETE
CYCLE
AF
SIGNAL
GENERATOR
AUDIO
AMPLIFIER
OUTPUT
LOAD
INPUT
Fig.
15Measureringamplifierphaseshift

loscopecontrolsettingforviewingthealternate
VITS.
Mostnetworktelevisionsignalscontaina
built-in
testsignal(the
VITS)
thatcanbea veryvaluable
tool
introubleshootingandservicingtelevision
sets.
This
VITS
canlocalize
trouble
totheantenna,
tuner,IForvideosectionsandshownwhen
rea-
lignmentmayberequired.The
following
procedu-
res
showhowtoanalyzeandinterpretoscilloscope
displays
ofthe
VITS.
The
VITS
istransmittedduringtheverticalblanking
interval.
Onthetelevisionset,itcanbeseenasa
bright
whitelineabovethetopofthepicture,when
theverticallinearityorheightisadjustedtoview
theverticalblankinginterval(onTV
sets
with
inter-
nal
retraceblankingcircuits,theblankingcircuit
mustbedisabledtoseethe
VITS).
The
transmitted
VITS
isprecisionsequenceofa
specific
frequences,amplitudesand
waveshapes
as
showninFig.16.
Television
networksusetheprecisionsignalsfor
adjustmentandcheckingofnetworktransmission
equipment,butthetechniciancanusethemto
eva-
luatetelevisionmultiburstsignalin
VITS
canalso
besetperformance.
The
firstframeof
VITS
atthe"B"section(line18)
inFig.16begins
with
a whitereferencesignal,fol-
lowedbysinewavefrequenciesof0.5MHz,1.0
MHz,2 MHz,3 MHz,4 MHzand3.58MHz.
This
sequence
offrequenciesiscalledthe"multi-burst".
(MULTI-BURST)
3.58MHz
FIELD
I
FIELD
2
(MULTI-BURST)
0.5I 2 3 3.58
4.2MHz
FIELD
I 42
No.17
No.279
Fig.
16VITSsignal.Fields1 and2
17
VERTICAL
BLANKINGINTERVAL(NO:1 ~ NO.21)
HORIZ.
SYNC.
PULSE
LINE
No.17 No.18
No.279
No.280
VERTICAL
BLANKINGINTERVAL(NO.263~ NO.282)
No.18
No.280

This
multi-burst
portion
of
the
VITS
isthe
portion
thatcan
be
mostvaluable
to
thetechnician.
The
second
line
of
Field1 andthesecondline
of
Field
2
(lines
18
and280)maycontainthesine-squared
pulse,
windowpulseandthe
staircase
of3.58MHz
burst
at
progressivelylightershading.
These
are
valuable
to
thenetwork,buthave
less
value
to
the
technician.
As
seen
onthetelevision
screen.
Field
1
is
interlacedwithField
2
sothatline
17is
fol-
lowed
by
line279andline
18
isfollowed
by
line
280.
Theentire
VITS
appearsatthe
bottom
ofthe
vertical
blankingpulseandjustbeforethefirstline
ofvideo.
Now
to
analyze
thewaveform.
All
frequencies
of
themulti-burstaretransmitted
at
the
same
level,
butshould
notbe
equallycoupledthrough
the
receiver
due
to
itsresponsecurve.Fig.24shows
thedesiredresponse
fora
goodcolortelevision
receiver,
identifying
each
frequency
ofthe
multi-burstandshowingtheallowableamount
of
attenuation
for
each.
Rememberthat
—
6
dB
equals
half
the
referencevoltage
(the2.0MHz
modulationshould
be
used
for
reference).
To
localizetrouble,start
by
observingthe
VITS
at
thevideodetector.
This
willlocalizetrouble
toa
point
eitherbefore
or
after
the
detector.
Ifthe
multi-burst
is
normal
atthe
detector,check
the
VITS
on
other
channels.
If
somechannelslook
okay
butothersdonot,youprobablyhavetuner
or
antenna-system
troubles.Don'toverlook
the
chance
of
theantennasystemcausing"holes"
or
tilted
response
on
some
channels.
If
the
VITS
is
abnormalatthevideodetectoronall
channels,
the
trouble
is
probably
inthe
IFamplifier
stages.
As
anotherexample,letus
assume
thatwehave
a
set
onthe
benchwith
a
verypoorpicture.
Our
oscilloscope
shownthe
VITS
at
thevideodetector
to
be
aboutnormalexceptthat
the
burst
at2.0
MHz
islowcompared
to
theburstsoneither
side.
This
suggests
anIF
trap
is
detuned
into
the
passband,
chopping
out
frequenciesabout
2
MHz
below
the
picturecarrierfrequency.Switch
to
anotherchannelcarrying
VITS.
If
the
same
thing
is
seen,
then
our
reasoning
is
right,
andtheIF
amplifierrequiresrealignment.
Ifthepoorresponse
at2
MHzisnot
seen
onother
channels,
maybeanFMtrap
at
thetunerinput
is
misadjusted,
causing
a
bite
on
onlyonechannel.
Other
trapsattheinputofthesetcouldsimilarlybe
misadjusted
or
faulty.
If
the
VITS
response
atthe
detector
output
is
normal
for
all
channels,
thetroublewill
beinthe
videoamplifier.
Look
for
openpeakingcoils,off-valueresistors,
solder
bridges
across
foil
patterns,etc.
Withdual-traceoscilloscopeoperation,
the
signal
information
on
each
verticalblankingintervalcan
be
viewedseparately
without
traceoverlapping,
although
the
informationalternateswith
each
field.
Fig.
18
indicates
the
oscilloscopecontrol
setting
for
viewing
the
alternateverticalblanking
intervals.
1.
Set
a
colorTVreceiver
tothe
stationtrans-
mitting
colorsignalscontaining
VITS.
2.
Themethodshown
in
Fig.18isused
to
obtain
Field
2
verticalsign
on
CH1.
3.
Setthe
oscilloscope
andthe
receiver
for
operation.ConnecttheCH1probe
to
thetest
point
of
videodetector
or
otherdesiredtest
point
inthe
videosection
ofthe
television
receiver.
4.
Setthe
SYNC
switcheasfollows:
A.
Ifthe
sync
and
blankingpulses
ofthe
observed
videosignalarepositive,usethe
VIDEO
+
position.
B.
Ifthe
sync
and
blankingpulses
are
negative,
usethe
VIDEO—
position.
5.
Adjustthesweeptime
VARIABLE
control
so
that
2
verticalfieldsaredisplayed
on
theos-
cilloscope
screen.
6.
ConnecttheCH2probe
to
the
same
test
point
as
doesthe
CH
1
probe.
7.
SettheMODEswitch
to
ALTposition.
8.
Place
the
sweeptime
VARIABLE
in
theCAL
position.
9.
Setthe
SWEEP
TIME/DIV
control
to
the
0.1
ms
position
to
expand
the
display
by
increasing
the
sweep
speed.
The
VITS
18
RESPONSE-DB
FREQUENCY—MHz
Fig.
17
Color
TVIF
amplifier
response
curve

VIDEO
VERTICAL
SYNC
.
PULSE
IF
AMP
TELEVISIONSET SOUND
IF
COLOR
IF
START
WITH
2MS/div
PICTURE
TUBE
Fig.
18Set-upforviewingfields1 and2 ofVITSinformation
informationwillappeartowardthe
right
hand
portion
oftheexpanedwaveformdisplays.
The
waveforminformationoneachtracemay
appear
asshowninFig.16.
Because
thereis
noprovisionforsynchronizingtheoscilloscope
displaytoeitherofthetwofieldswhich
comprisea completeverticalframe,itcannot
bepredictedwhichfielddisplaywillappearon
CH1
orCH2.
10.
Pullthe<>
POSITION
controloutwardto
obtainanadditionalX10magnification.
Rotate
thecontrolina counterclockwisedi-
rectionmovingthetracetothe
left
until
the
expanded
VITS
informationappearsasshown
inFig.16.
Because
ofthelow
repetition
rate
andthehighsweepspeedcombination,the
brightnesslevelofthesignaldisplayswillbe
reduced.
11.
OncetheCH1andCH2displayshavebeen
identifiedasbeingeitherField1 orField2
VITS
information,theprobecorrespondingto
thewaveformdisplaywhichistobeusedfor
signal-tracingandtroubleshootingcanbe
used,
andtheremainingprobeshouldbe
left
at
thevideodetectortest
point
toinsurethatthe
sync
signalisnotinterrupted.Ifthe
sync
sig-
nal
isinterrupted,thewaveformdisplaysmay
bereversed
because,
aspreviouslyexplained,
thereisnoprovisionintheoscilloscopeto
identifyeitherofthetwoverticalfieldswhich
comprisea completeframe.
19
VERTICAL
BLANklNG
VIDEO
DETECTOR
VIDEO
AMP VIDEO
AMP

SINGLE-CHANNEL
APPLICATIONS
introduction.
In
addition
tothedual-traceapplicationspreviously
outlined,thereare,ofcourse,manyservicingand
laboratoryapplicationswhereonlysingle-traceor
single-channel
operationoftheoscilloscopeisre-
quired.BysettingtheMODEswitchtoCH2and
usingtheCH2amplifier,manyflexibleoperations
willbeachieved;and,inaddition,byplacingthe
MODE
switchtoADDandtheCH2polarityswitch
tothe
PULL
INVERT
position.Whateverwaveform
is
obtainedcanbeinvertedinpolarityifdesiredby
theoperator.
Television
Servicing:
A
triggeredsweeposcilloscopeisadvantageousin
servicing
andaligningtelevisionreceivers.
This
oscilloscopealsoincludesseveralfeaturesthat
were
incorporatedtomaketelevisionservicingand
VIDEO
signalobservationeasierandmore
comprehensive.
These
featureincude:
*Withthe
SYNC
switchsetto
VIDEO
position,
the
SWEEP
TIME/DIV
controlautomatically
selects
the
VIDEO-FRAME
sync
atsweep
speeds
appropriateforviewingframeand
VIDEO-LINE
sync
atsweepspeedsappropriate
forviewinglines.
*Widebandwidthforhighresolutionvideoand
highspeedpulsepresentation.
Single-trace
OperationandPeak-to-Peak
VoltageReadings:
For
generaltroubleshootingandisolationof
troublesinalmostanyelectronicequipment,the
oscilloscopeisanindispensableinstrument.It
providesa visualdisplayoftheabsenceorpresence
ofnormalsignals.
This
method(signal-tracing)
may
beusedtotracea signalbymeasuringseveral
pointsinthesignalpath.Asmeasurements
proceedalongthesignalpath,a
point
maybe
found
wherethesignaldisappears.Whenthis
happens,
thesourceof
trouble
hasbeenlocated.
However,theoscilloscopeshownmuchmorethan
themerepresenceorabsenceofsignals.It
providesa peak-to-peakvoltagemeasurement.
The
schematicdiagramoraccompanyingservice
dataontheequipmentbeingservicedusually
includes
waveformpictures.Therewaveform
pictureincludetherequiredsweeptimeandthe
normalpeak-to-peakvoltage.Comparethe
peak-to-peakvoltagereadingsontheoscilloscope
with
thoseshownonthewaveformpictures.Any
abnormalreadingsshouldbefollowedbyadditional
readingsinthesuspectedcircuits
until
the
trouble
is
isolatedtoassmallan
area
aspossible.
CompositeVideoWaveformAnalysis
Probablythemost
important
waveformin
televisionservicingisthecompositewaveform
consistingofthevideosignal,theblankingpedestal
signal
andthe
sync
pulses.Fig.19andFig.20
show
typicaloscilloscopetraceswhenobserving
compositevideosignalssynchronized
with
ho-
rizontal
sync
pulsesandverticalblankingpulses.
Compositevideosignalscanbeobservedatvarious
stages
ofthetelevisionreceivertodetermine
whethercircuitsareperformingnormally.
Knowledgeofwaveformmakeup,theappearance
ofa normalwaveform,andthe
cause
ofvariousab-
normalwaveformshelpthetechnicianlocateand
correctmanyproblems.Thetechnicianshould
studysuchwaveformsina televisionreceiver
knowntobein
good
operatingcondition,
noting
thewaveformatvariouspointsinthevideo
amplifier.Tosetuptheoscilloscopeforviewing
compositevideowaveforms,usethe
following
procedures:
1.
Turnthetelevisionsettoa localchannel.A
testtapeora signalgeneratoralsocanbeused
forservicework.
2.
SettheMODEswitchtoCH2position.
3.
Setthe
SWEEP
TIME/DIV
switchtothe10
us
positionforobservingTVhorizontallinesorto
the2 mspositionforobservingTVvertical
frames.
4.
Setthe
SYNC
switchto
VIDEO
+
orVIDEO-
position.
5.
Setthe
SOURCE
switchtoINTposition.
6.
Best
overall
sync
performanceisobtained
whenthe
TRIG
LEVEL/PULL
AUTOcontrolis
pushedin.Itmaybepulledoutinitiallyto
providecontinuoussweepduringset-up.
7.
SettheCH2
AC-GND-DC
switchtotheAC
position.
8.
Connectthegroundclipoftheprobetothe
chassis.
Withtheprobesetfor10: 1
attenuation,connectthetipoftheprobetothe
videodetector
output.
9.
SettheCH2
VOLTS/DIV
switchforthelargest
verticaldeflectionpossible
without
going
offscale.
10.
If
necessary,
rotatethe
TRIG
LEVEL
controlto
a
positionthatprovidesa synchronizeddisplay.
11.
Adjustthesweeptime
VARIABLE
fortwoho-
rizontallinesortwoverticalframesof
20
Other manuals for CS-1566A
1
Other Trio Test Equipment manuals
