Amber api SmartScan V5.0 User manual

1
Radio Frequency Immunity
Measurement Setup
V 5.0
Amber Precision Instruments, Inc.
Dec 2017

2
Table of Contents
1. Radio Frequency Immunity (RFI) Scanning Outline ........................................................ 3
Configuration Diagram....................................................................................................................................... 3
Main Components of RFI Scanning ............................................................................................................... 3
Diagram of RFI measurement wiring........................................................................................................... 5
2. RFI Scanning Operation Procedures................................................................................... 5
Setup test environment ..................................................................................................................................... 5
Create a project..................................................................................................................................................... 5
Capture the DUT image...................................................................................................................................... 8
Define probe Z offset........................................................................................................................................... 8
Define a reference point to get DUT height and calibrate probe XY offset................................... 9
Define scan area and scan height.................................................................................................................11
Check instrument and SmartScan software connection ....................................................................11
Open “Instrument Settings” window and set parameters.................................................................12
Run measurement..............................................................................................................................................13
List of Figures
Figure 1: Block diagram of RFI scanning. ................................................................................. 3
Figure 2: Measurement setup diagram of RFI scanning. ......................................................... 5
Figure 3: Create a new workspace.............................................................................................. 6
Figure 4: Name the workspace and save in a directory. ........................................................... 6
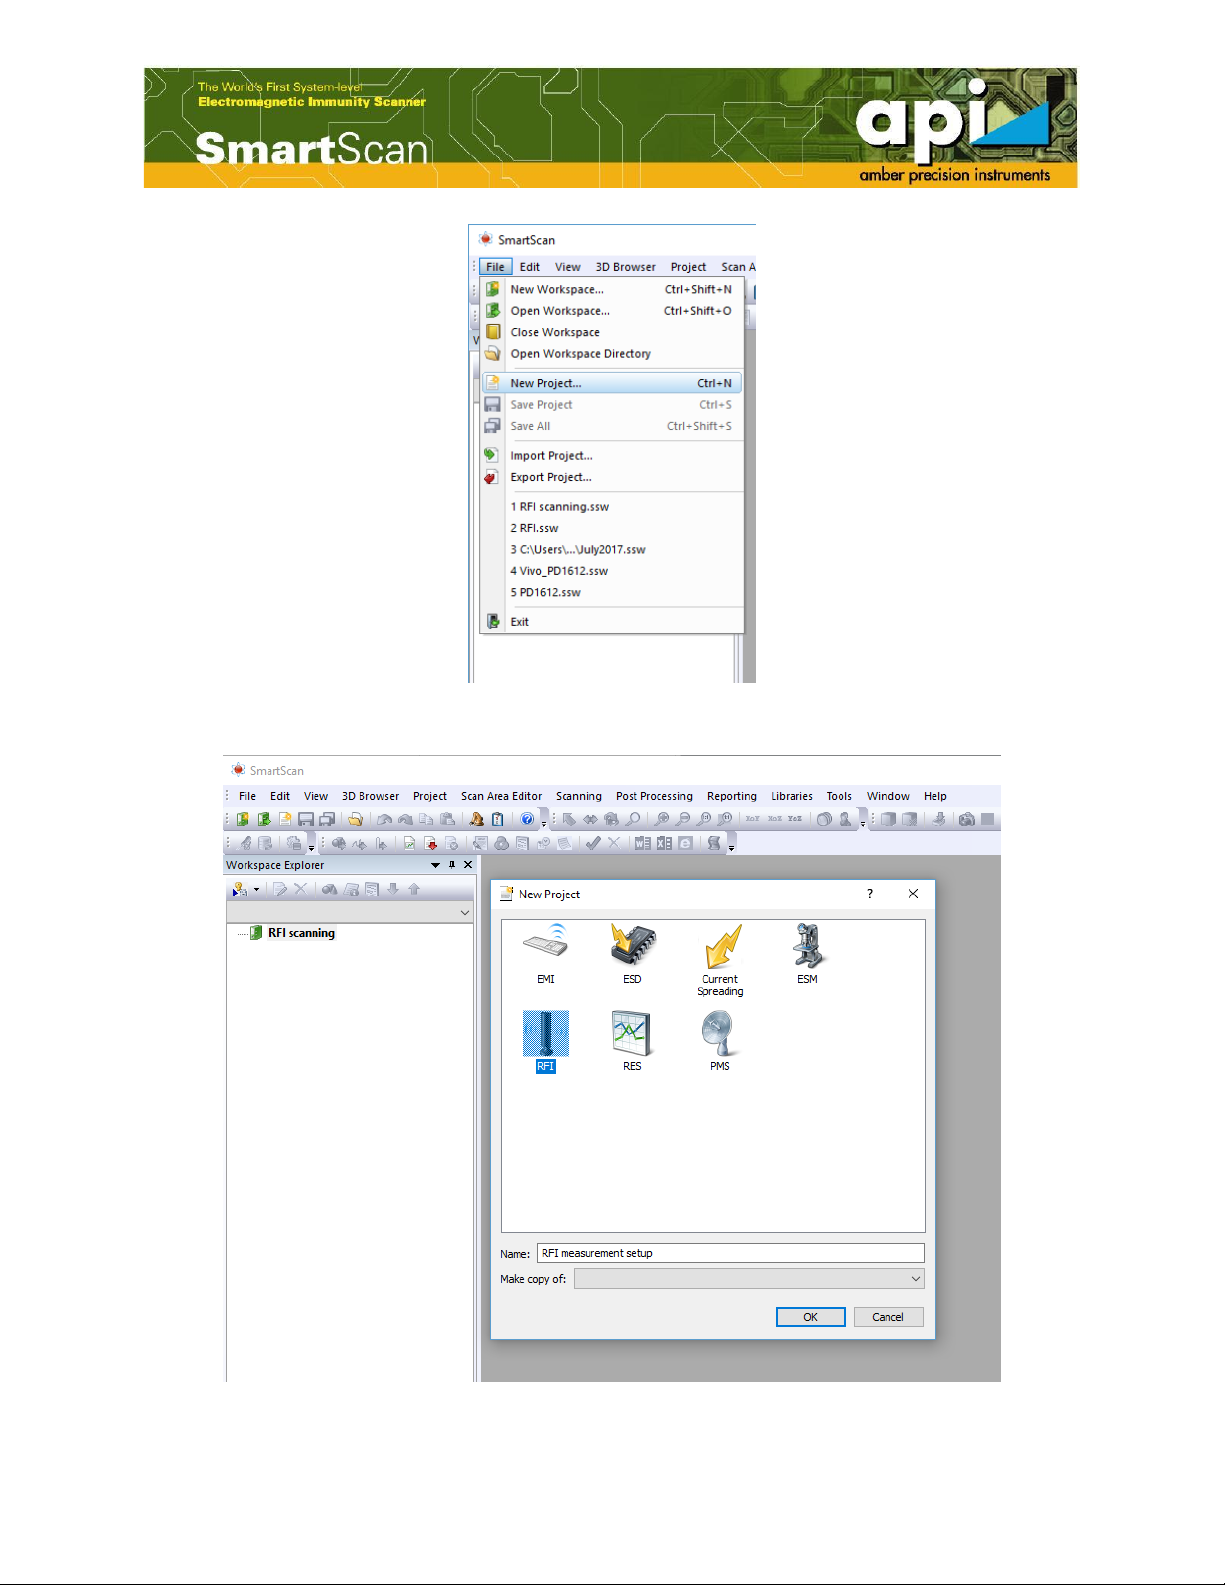
Figure 5: Create a new RFI project. ........................................................................................... 7
Figure 6: Name the RFI project. ................................................................................................. 7
Figure 7: Capture DUT image..................................................................................................... 8
Figure 8: Probe Z offset icon........................................................................................................ 8
Figure 9: Probe Z offset calibration window.............................................................................. 9
Figure 10: Reference point........................................................................................................... 9
Figure 11: Detect DUT height by touch sensor........................................................................ 10
Figure 12: Get DUT height manually........................................................................................ 10
Figure 13: Calibrate probe XY offset........................................................................................ 10
Figure 14: Probe XY offset calibration window....................................................................... 11
Figure 15: Open “Options” window.......................................................................................... 11
Figure 16: Signal generator communication setting window. ................................................ 12
Figure 17: Instrument settings................................................................................................... 12
Figure 18: Run measurement. ................................................................................................... 13

3
1. Radio Frequency Immunity (RFI) Scanning Outline
Configuration Diagram
Below (Figure 1) is a block diagram of the scanning system for RFI measurement. Movement of
the probe is automated via a four axis scara robot controlled by SmartScan software. Collected
data is displayed on a monitor and superimposed on the device under test (DUT). The displayed
map is then used to identify the sensitivity of a product to external or internal RF fields (for
example, a cell phone disturbs a display), and the cause of the coupling.
An RF signal or a modulated RF signal is fed into a probe. The probe is moving around the
product while the product is observed for signs of disturbances. The strength of the disturbance
is automatically recorded for each location. A map of the local sensitivity of the product is
created, helping to understand the reason for the immunity problem.
RFI scan is very similar to ESD scan, but user controls power level and frequencies, unlike ESD,
which is a broadband disturbance.
Figure 1: Block diagram of RFI scanning.
Main Components of RFI Scanning
SmartScan
SmartScan is the proprietary software controlling the hardware components and processing
the collected data.
Probe Movement Mechanism

4
The attached probe moves to user-specified probing positions by one four-axis scara robot.
The robot provides 4 degrees of movement: along x-axis, y-axis, z-axis, and 360° rotation
(both clockwise and counterclockwise directions).
Probe
The probe induces an ESD disturbance to the DUT. Four different probe types are available
to inject magnetic or electric fields in directions of x, y and z movement. The commercially
available probe types are: Hz, Hx/y, Ez, and Ex/Ey.
Cameras
A high resolution USB camera is attached to the robot and used to take pictures of the DUT.
The sensitivity of the DUT to the disturbance is color coded and then superimposed on the
picture taken by the USB camera prior to the test.
Power Amplifier
A 50 dB gain power amplifier (PA) is used to increase the signal strength.
Attenuator
An attenuator is placed between RFI probe and power amplifier for better impedance match,
and to protect the PA. Attenuator ranges from 3 to 10 dB is commonly used.
Signal Generator
A signal is generated by signal generator and is injected to a DUT through RFI (ESD) probe.
The signal can be either power or frequency, or the combination of power and frequency.

5
Diagram of RFI measurement wiring
Figure 2: Measurement setup diagram of RFI scanning.
2. RFI Scanning Operation Procedures
It is required user to read “API SmartScan V5.0 Operation Manual (Common Part)” before
starting the RFI measurement. For detailed operation procedures, also refer to “API SmartScan
V5.0 Operation Manual (Common Part)”.
Setup test environment
The hardware set up should be done first, e.g. the probe is attached to the robot; amp, attenuator,
cables and instrument are connected.
Create a project
Go to SmartScan software, create a “Workspace”, name the workspace, create an RFI project,
and name the project.
DUT
Attenuator
Signal Generator
SmartScan software
Power Amp
(50 dB)
(3-10 dB)
Robot
Positioning
System
RFI probe

6
Figure 3: Create a new workspace.
Figure 4: Name the workspace and save in a directory.

7
Figure 5: Create a new RFI project.
Figure 6: Name the RFI project.

8
Capture the DUT image
Double click on “Scan Area Settings”. Click on the “Snapshot” icon. Move the robot to where
the camera is on top of DUT, then click on “Take Picture” to capture a DUT image.
Figure 7: Capture DUT image.
Define probe Z offset
Click on “Calibrate Probe Z offset” icon to define probe Z offset. Follow the instruction in
“Probe Tip Offset Calibration” to complete Z offset calibration.
Figure 8: Probe Z offset icon.

9
Figure 9: Probe Z offset calibration window.
Define a reference point to get DUT height and calibrate probe XY offset
Place a reference point in the DUT image (location of reference point can be random, but better
to choose a point where probe can be easily aligned). Measure the DUT height (= reference point
height). User can choose either the touch sensor method to detect height automatically or choose
the manual way to get the DUT height.
Figure 10: Reference point.

10
Figure 11: Detect DUT height by touch sensor.
Figure 12: Get DUT height manually.
Calibrate probe XY offset.
Figure 13: Calibrate probe XY offset.

11
Figure 14: Probe XY offset calibration window.
Define scan area and scan height
Please refer to “API SmartScan V5.0 Operation Manual (Common Part)” for detailed
information.
Check instrument and SmartScan software connection
Build connection between SmartScan and instrument. Select the corresponding signal generator
model, communication port and click on “Test Connection” to verify the connection.
Figure 15: Open “Options” window.

12
Figure 16: Signal generator communication setting window.
Open “Instrument Settings” window and set parameters
Go to “Instrument Settings”. User can choose the sweep mode, modulation mode, frequency
range, power value etc. according to measurement requirements.
Figure 17: Instrument settings window.

13
Run measurement
Click the “Run” button to run scanning.
Figure 18: Run measurement.
Table of contents
Other Amber Industrial Equipment manuals
Popular Industrial Equipment manuals by other brands

Climate RENTAL SOLUTIONS
Climate RENTAL SOLUTIONS M45 Operation manual

PCB Piezotronics
PCB Piezotronics M1630-03C Installation and operating manual

MITS
MITS Design Pro CAM-T manual

LYSON
LYSON Optima manual

Aimco
Aimco AcraDyne iEC Gen IV Operation manual

Förster-Technik
Förster-Technik MaxiFlex100 installation instructions