UG000417 •v1-00 • 2019-Jan-09
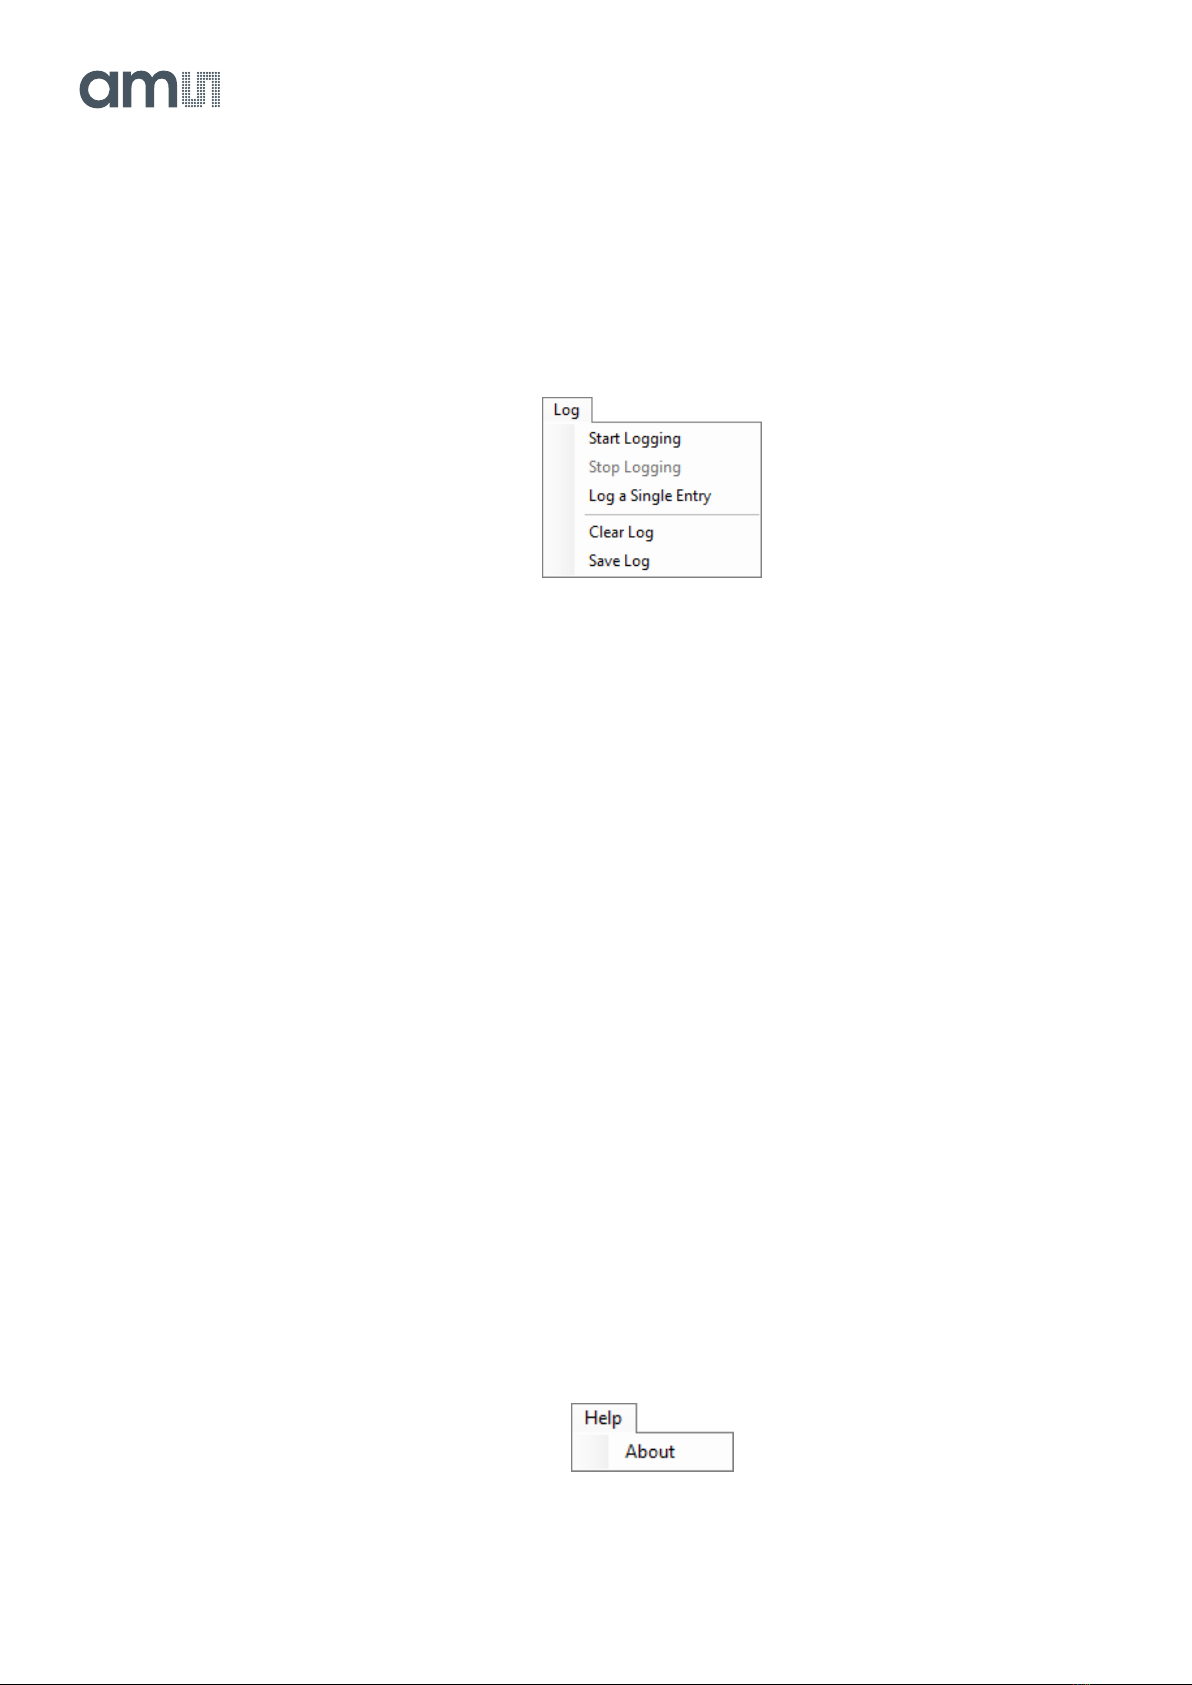
4.2.2 Log Menu
The Log menu is used to control the logging function and to save the log data to a file. Log data is
accumulated in memory until it is discarded or written to a data file.
Figure 5 :
Log Menu
Click Start Logging to start the logging function. Each time the program polls the output information
from the device, it creates a new log entry showing the raw data values, the values of various control
registers, and the values entered by the user into the text fields near the bottom right corner of the
window.
Click Stop Logging to stop the logging function. Once logging is stopped, the data can be written to a
file, or the user can continue collecting additional data by clicking Start Logging again.
The Log a Single Entry command causes logging to start, collect one single entry, and immediately
stop again. This function is not available when logging is already running.
Click Clear Log to discard any data that has already been collected. If there is data in memory, which
has not been saved to disk, this function displays a prompt asking to verify it is OK to discard the data.
If the log is running when this function is clicked, the log continues running after the existing data is
discarded.
Click Save Log to save the collected log data to a csv file. This stops the logging function, if it is
active, and displays a file dialog box to specify where to store the logged data. The default file name
is described in the Log Status and Control Information section, but the file name may be changed if
desired.
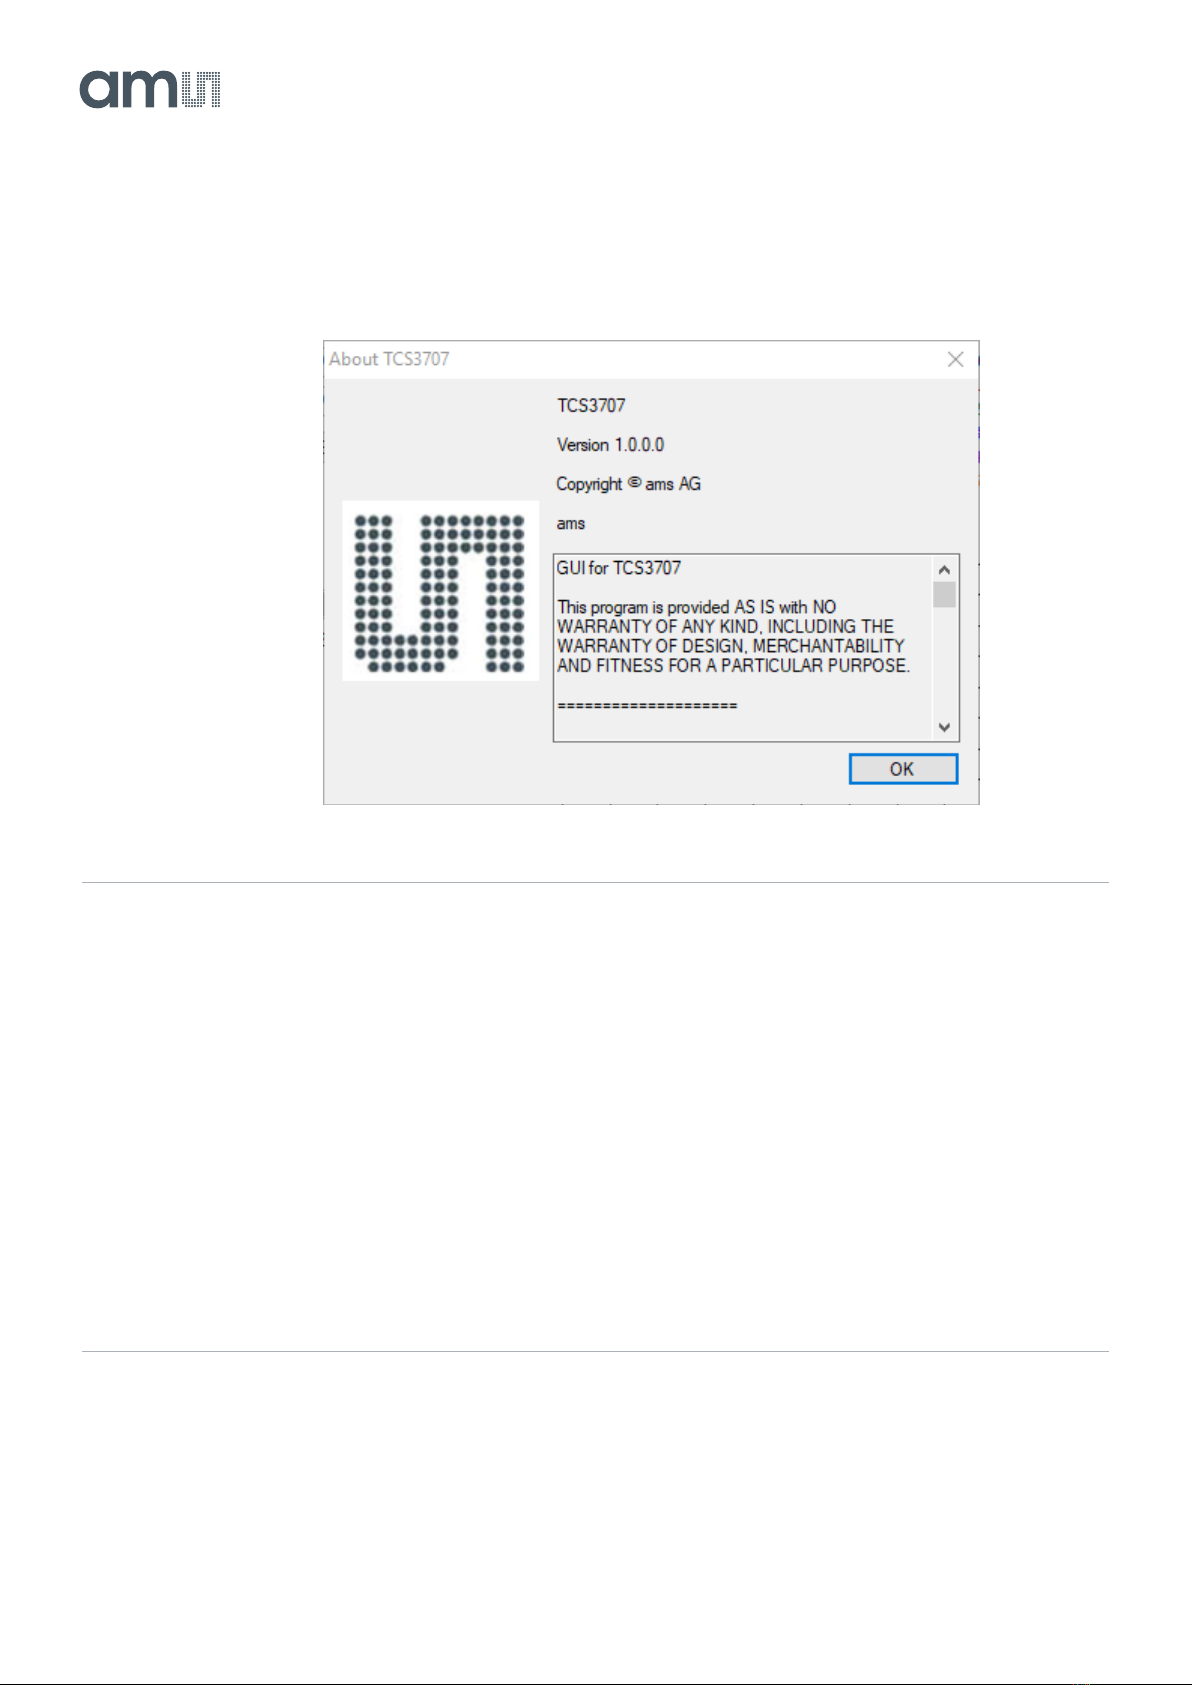
4.2.3 Help Menu
The Help menu contains a single function: About.
Figure 6 :
Help Menu