UG-364 Evaluation Board User Guide
Rev. 0 | Page 6 of 28
3. A standard windows operating system warning message
then appears, as shown in Figure 10. It indicates that the
new hardware currently being installing on the Windows®
operating system (AD5933 evaluation kit) has not passed the
Windows logo testing to verify compatibility with Windows
XP. This warning appears because the installation is an
evaluation setup installation and is not intended to be used
in a production environment. Click Continue Anyway and
then click Finish.
PERFORMING A FREQUENCY SWEEP
The sequence for performing a linear frequency sweep across a
200 k resistive impedance connected across the VOUT and
VIN pins within the frequency range of 30 kHz to 30.2 kHz is
outlined in this section. The default software settings for the
evaluation board are shown in Figure 12. (Note that a 200 k
resistor must be connected across the VIN and VOUT pins of
the AD5933). The default link positions are outlined in Table 1,
see this before continuing.
10441-011
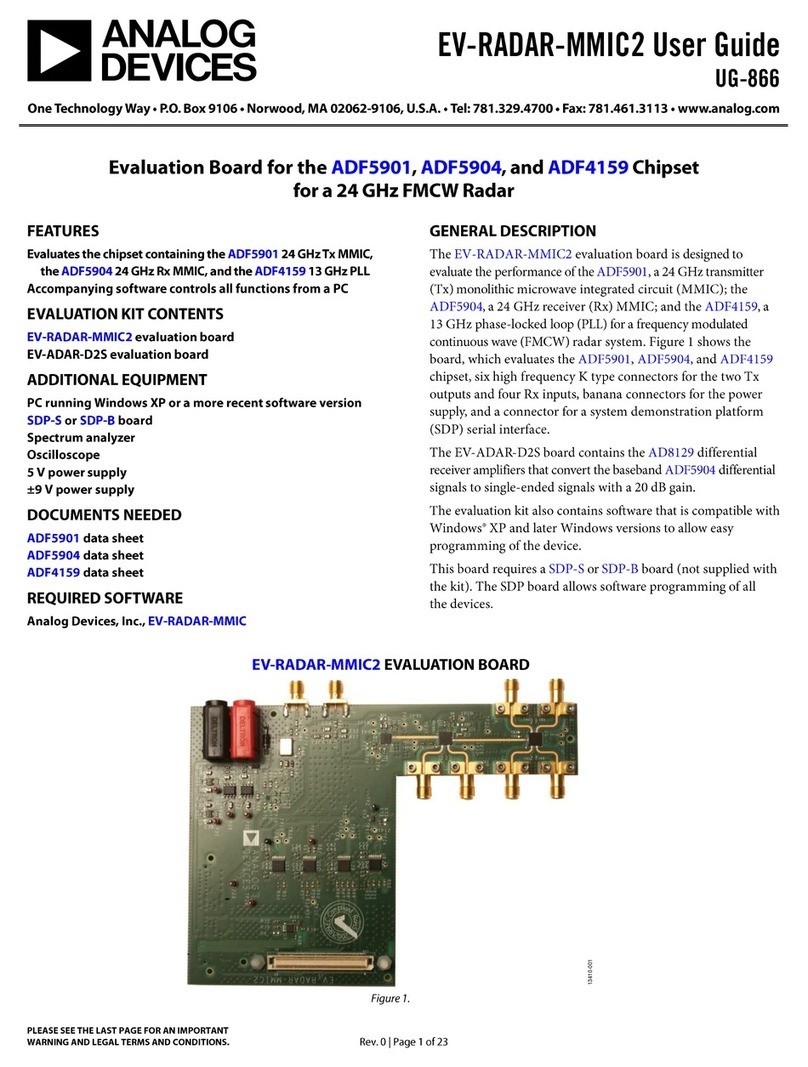
To open the software, go to Start > Programs > Analog Devices >
AD5933 and click AD5933 Evaluation Software.
Figure 12 shows the graphic user interface program open and
running successfully. It also shows the interface panel along with
a frequency sweep impedance profile for a 200 k resistive
impedance (note RFB = 200 k).
To setup a typical sweep across a 200 k impedance (RFB = 200 k),
use the following steps:
•Set Start Frequency (Hz) to 30000 (Hz) within the Sweep
Parameters section (see 1 in Figure 12). The start frequency
is 24-bit accurate.
•Set Delta Frequency (Hz) to 2 (Hz) within the Sweep
Parameters section (see 1 in Figure 12). The frequency step
size is also 24-bit accurate.
Figure 10. Expected Warning Message •Set Number Increments (9 Bit) within the Sweep Parameters
section to 200 (see 1 in Figure 12) to set the number of
increments along the sweep to 200. The maximum number
of increments that the device can sweep across is 511, and
the value is stored in a register as a 9-bit value.
The message shown in Figure 11 appears once the hardware has
been successfully installed.
10441-012
•Set Number of Settling Time Cycles to 15 (see 1 in Figure 12).
Note that when sweeping across a high-Q structure, such
as resonant impedance, users must ensure that the contents
of the settling time cycles register is sufficient to ensure
that the impedance under test settles before incrementing
between each successive frequency in the programmed
sweep. This is achieved by increasing the Number of
Settling Time Cycles value.
The delay between the time a frequency increment takes place
on the output of the internal direct digital synthesizer (DDS)
core and the time the ADC samples the response signal at
this new frequency is determined by the contents of the
number of settling time cycles registers (Register 0x8A and
Register 0x8B), see the AD5933 data sheet for further details.
For example, if a value of 15 is programmed into the Number
of Settling Time Cycles box, and if the next output frequency
is 32 kHz, the delay between the time the DDS core starts
to output the 32 kHz signal and the time the ADC samples the
response signal is 15 × (1/32 kHz) ≈ 468.7 µs. The maximum
number of settling time cycle delays that can be programmed
to the board is 511 cycles. The value is stored in a register as
a 9-bit value, and this value can be further multiplied by a
factor of 2 or by a factor of 4.
Figure 11. Successful Hardware Installation
VERIFYING THE LINKS AND POWER UP THE
EVALUATION BOARD
Ensure that the relevant links are in place on the evaluation board
(see Table 1) and that the proper power connections and supply
values have been made to the terminal blocks before applying
power to the evaluation board. The power supply terminal blocks
are outlined in evaluation board schematic (see Figure 32). Note
that the USB connector only supplies power to the Cypress USB
controller chip that interfaces to the AD5933. If required, a
dedicated external voltage supply to each terminal block can
be provided. Ensure that all relevant power supply connections
and links are made before running the evaluation software. For
optimum performance, supply the three supply signals (AVDD1,
AVDD2, and DVDD) from a stable external reference supply via the
power supply terminal blocks on the board.
