ANDILOG GYROTORK DUAL User manual

Instructions Manual
GYROTOK Gauge
Operating Manual
GYROTORK
DUAL
V6.19
ANDILOG
BP62001 –13845 Vitrolles - FRANCE
www.andilog.com
Ph : +33 442 348 340
COM-TEN / ANDILOG USA
6405 49th St North –
Pinllas Park, FL, 33781 - USA
Ph : 72705201200

Instruction Manual –V6.19
GYROTORK DUAL version
- 1 -
I. INTRODUCTION TO THE GYROTORK ................................................................................ 3
DEFINITIONS: .................................................................................................................... 3
•Internal Channel or V1: Torque transducer wrench........................................................ 3
•External Channel or V2 or SPIP: Angle sensor ............................................................... 3
II. HANDLING.................................................................................................................... 4
1. Unpacking................................................................................................................. 4
2. Recommendation before first use................................................................................ 4
3. Starting your torque gauge ......................................................................................... 5
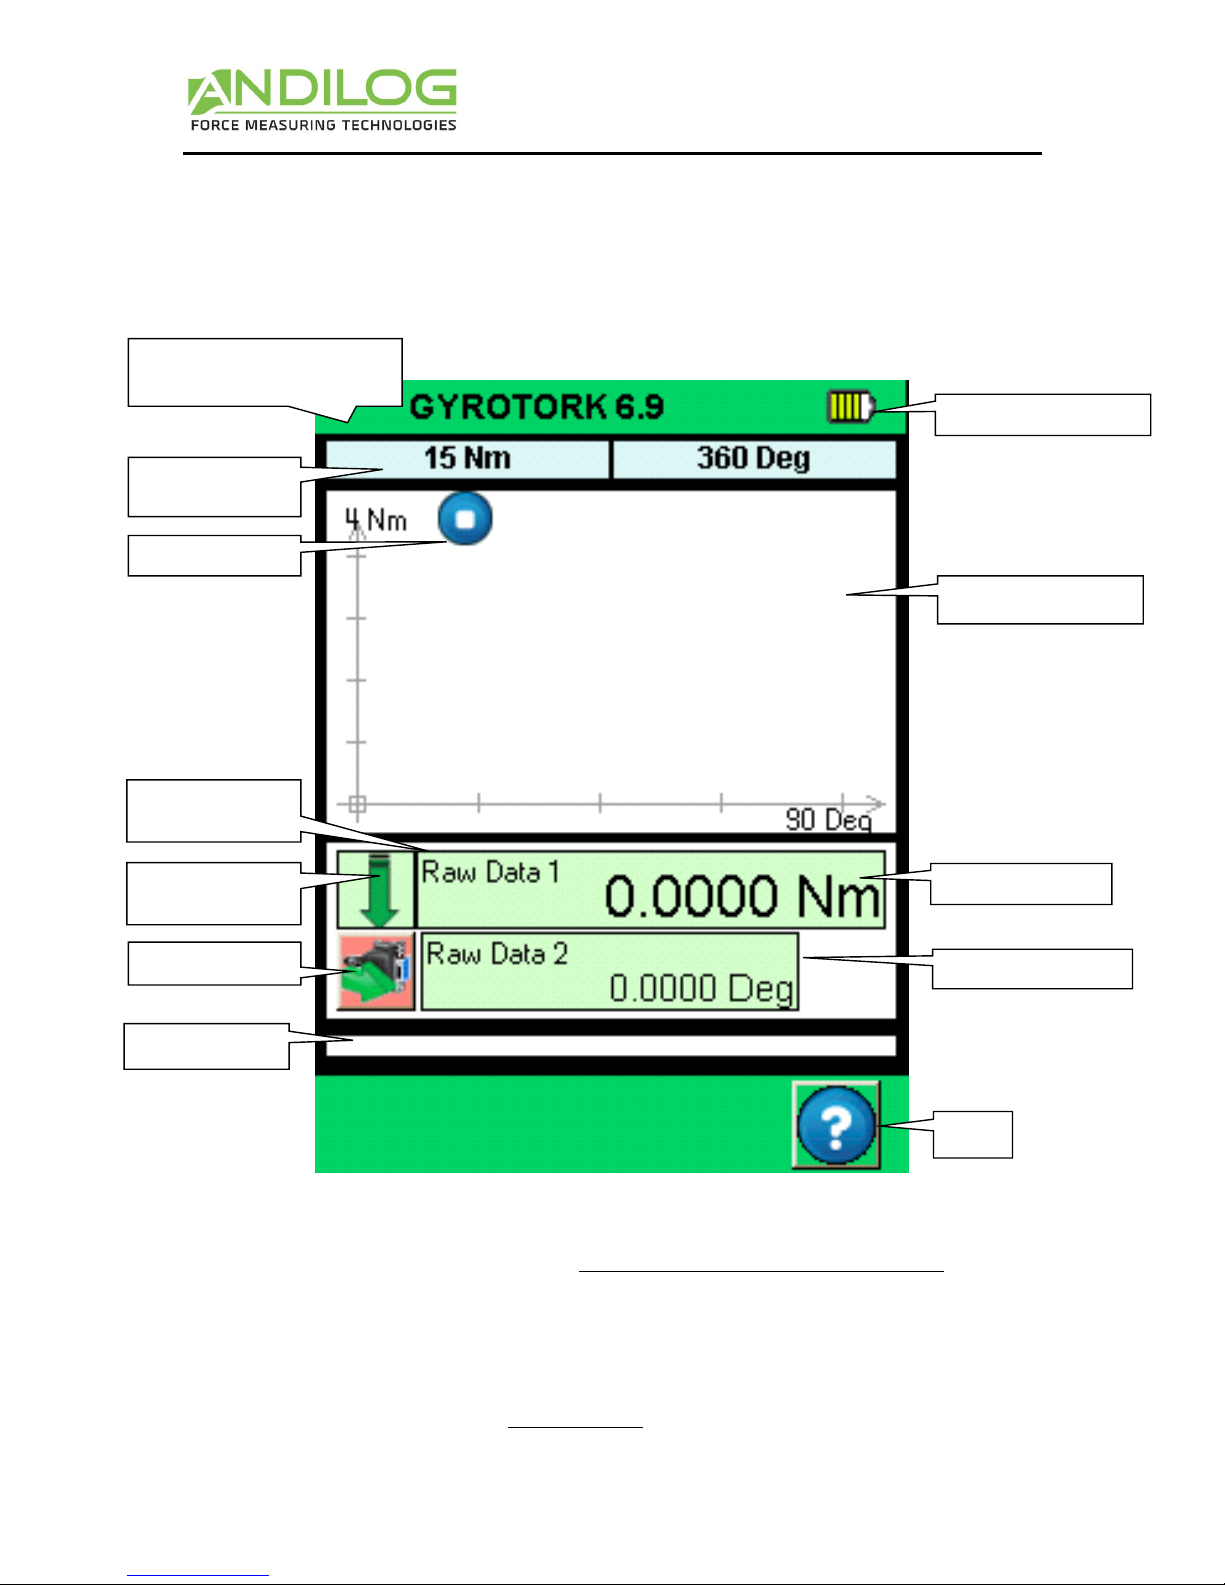
4. Main screen –Measurement ...................................................................................... 6
5. Touch area on the Measure screen.............................................................................. 7
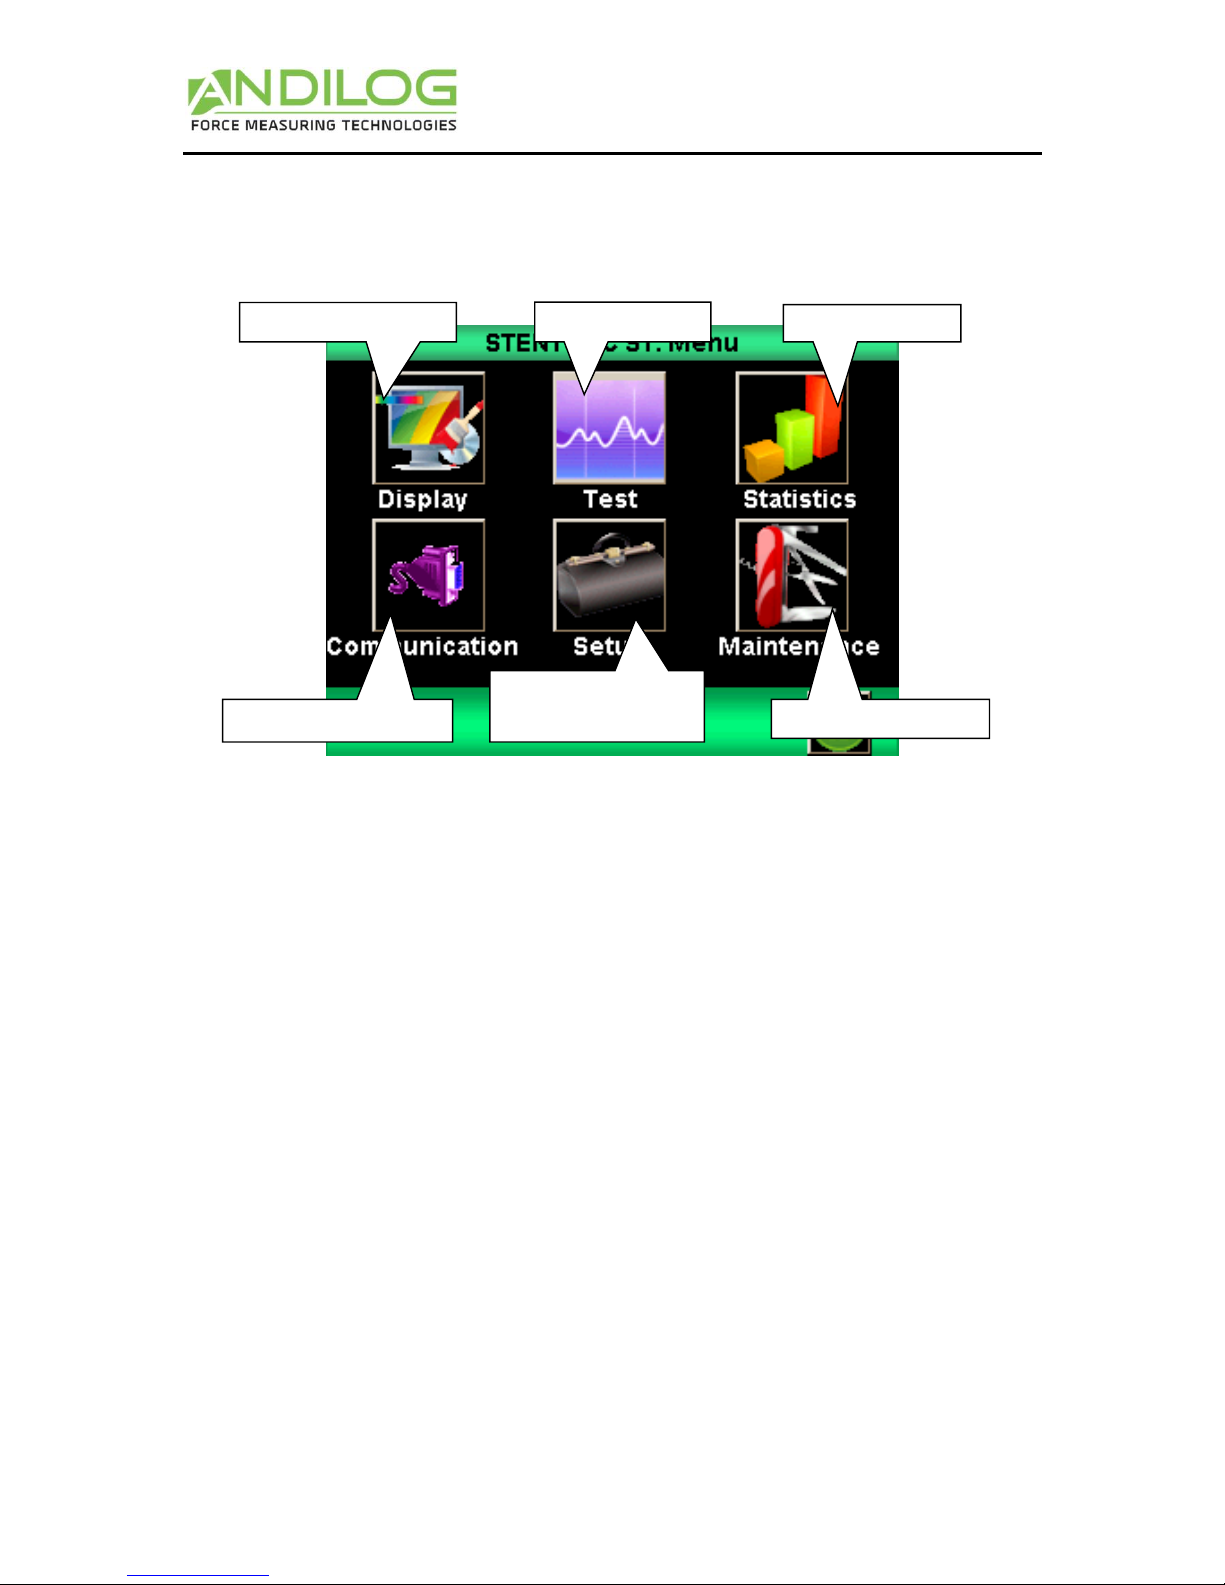
6. Main MENU .............................................................................................................. 8
7. Tare your device:....................................................................................................... 8
8. Backlight................................................................................................................... 8
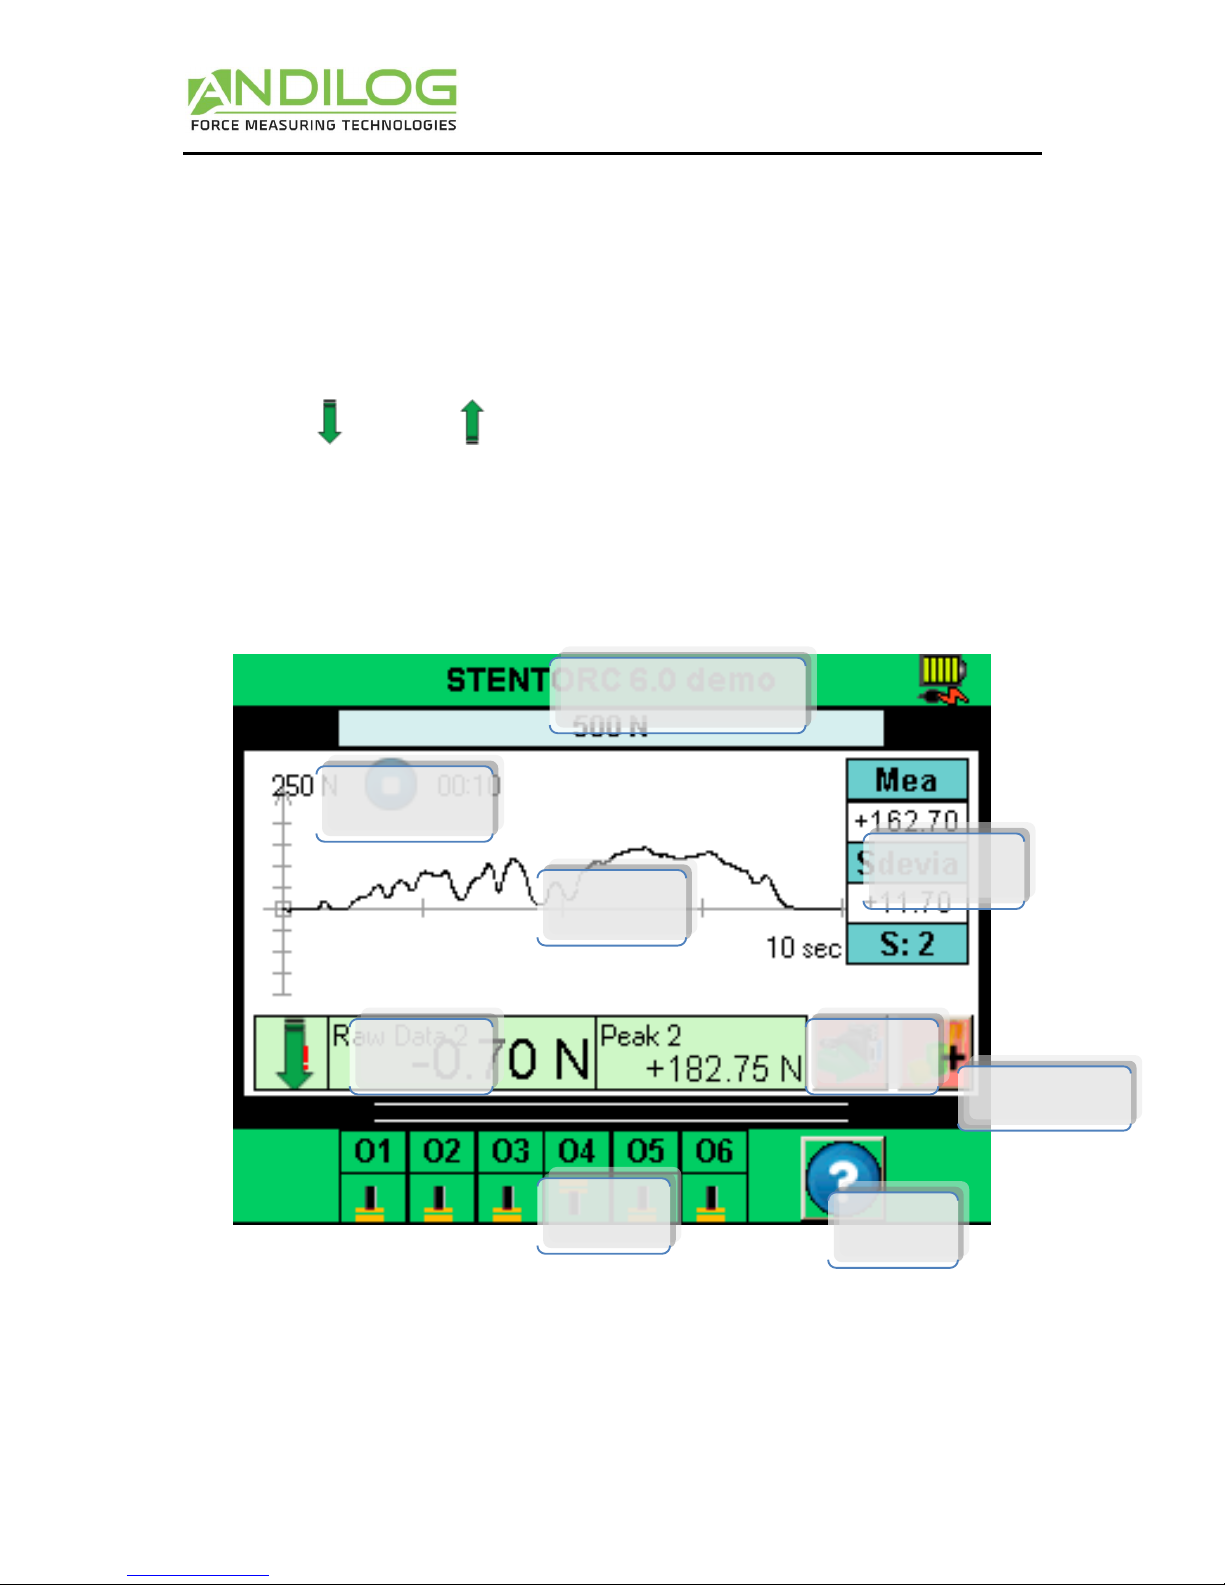
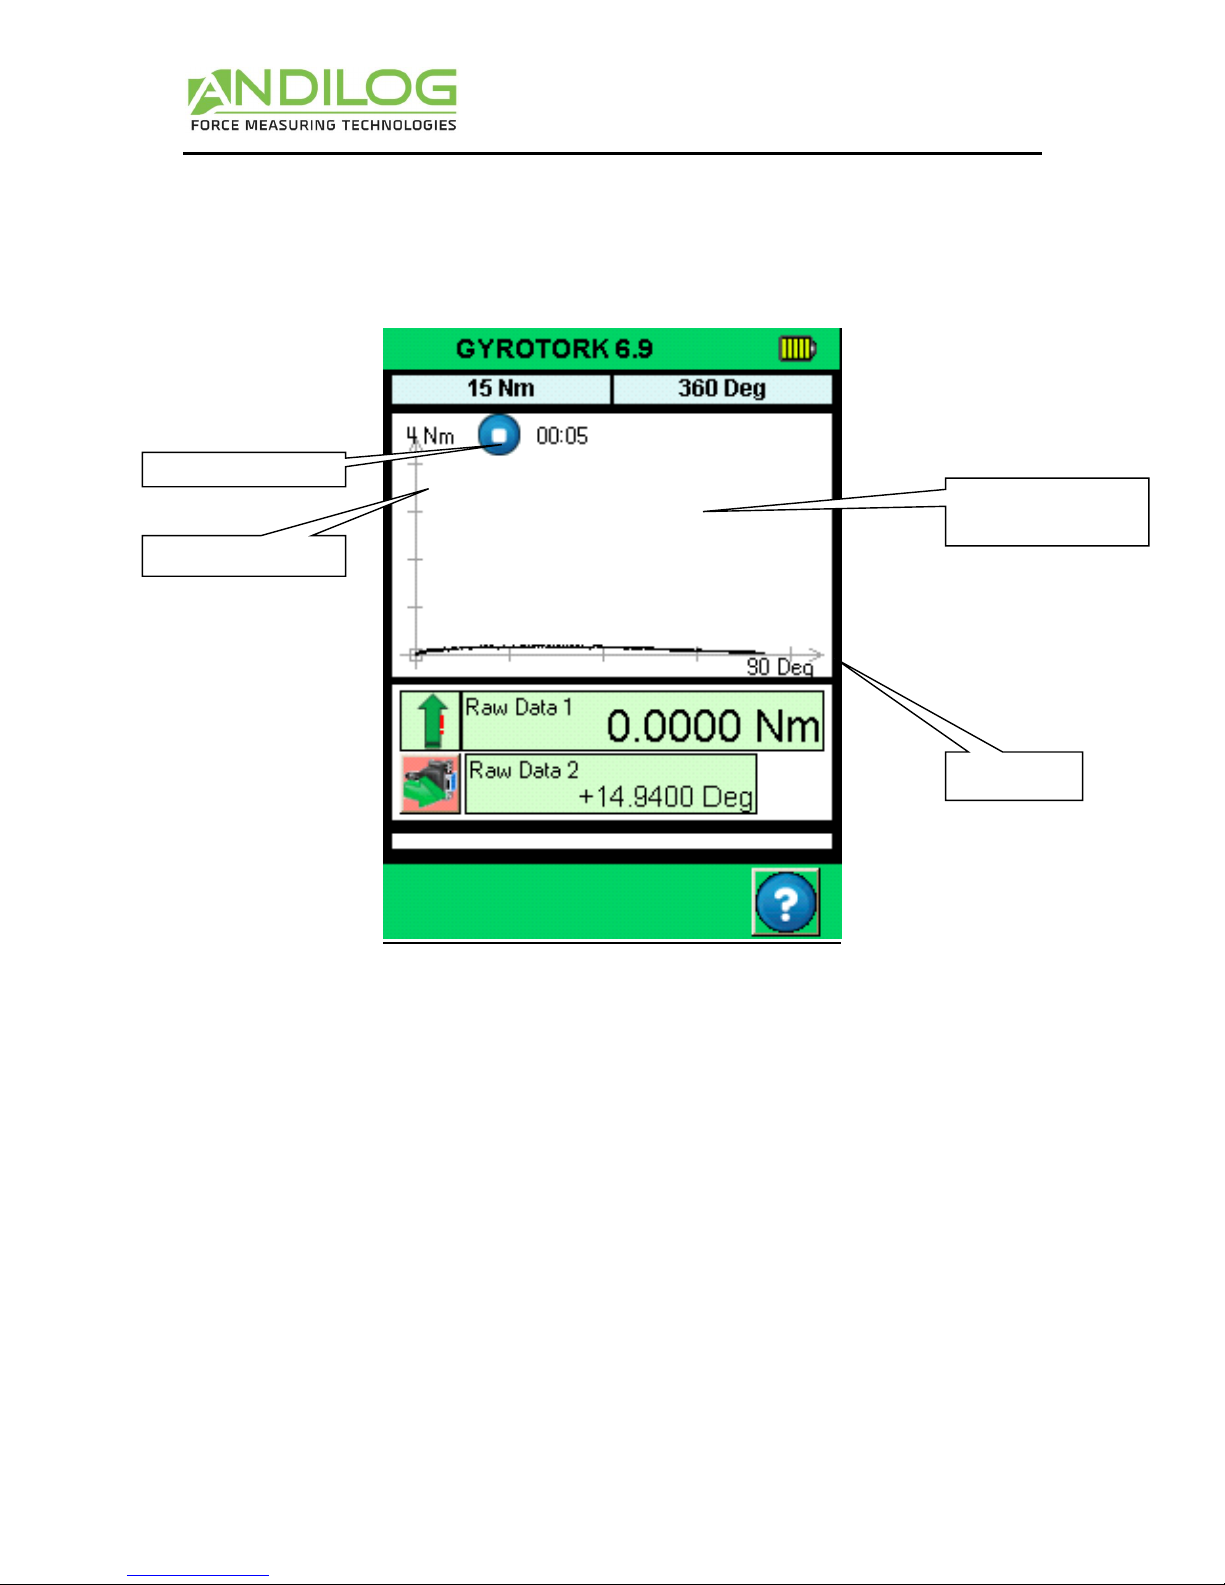
III. START your measurements............................................................................................. 9
1. Measurement principles............................................................................................10
2. States Indicators.......................................................................................................10
3. Graph displaying area................................................................................................10
IV. DISPLAY setup..............................................................................................................11
1. Main screen .............................................................................................................12
2. Auxiliary ..................................................................................................................12
3. Curve ......................................................................................................................12
4. Bar Graph ................................................................................................................12
5. State .......................................................................................................................12
6. Digits.......................................................................................................................12
7. Time unit .................................................................................................................12
8. Sensor Units V1 ........................................................................................................13
9. Set points - Limits .....................................................................................................13
V. SET POINTS Setting - Limits............................................................................................13
1. Activate/Deactivate ..................................................................................................13
2. Torque transducer tab...............................................................................................13
3. Type of Data ............................................................................................................14
4. Top and Bottom limits...............................................................................................14
5. Activate an Output....................................................................................................14
VI. GRAPH & TEST Settings. ................................................................................................15
1. Setups tab................................................................................................................15
2. Test settings.............................................................................................................15
3. Curve Resolution ......................................................................................................16
4. Axis H & Axis V .........................................................................................................16
5. Output control .........................................................................................................16
VII. CALCULATION Settings ..............................................................................................17
1. Calculation...............................................................................................................17
2. Output actions .........................................................................................................18
VIII. RECORD DATA AND STATISTICAL Mode. ......................................................................18
1. Statistics setup .........................................................................................................18
2. Record data .............................................................................................................19
IX. COMMUNICATION Settings. ..........................................................................................20
1. RS232 or Serial commands.........................................................................................20
2. USB Connection........................................................................................................22
3. Bluetooth (Optional) .................................................................................................22
4. Analogue Connection................................................................................................22

Instruction Manual –V6.19
GYROTORK DUAL version
- 2 -
5. DATASTICK –USB Memory Stick (optional) ..................................................................23
a. Presentation ............................................................................................................23
b. Configuration ...........................................................................................................23
c. Save your data .........................................................................................................25
d. Use multiple USB sticks .............................................................................................25
X. INPUT, OUTPUT & Pedal................................................................................................26
1. Outputs ...................................................................................................................26
2. Inputs and Pedal.......................................................................................................27
XI. GENERAL Setup............................................................................................................27
1. Buzzer .....................................................................................................................27
2. ECO Mode:...............................................................................................................28
3. Time out settings. .....................................................................................................28
4. Orientation ..............................................................................................................28
5. Language .................................................................................................................28
XII. MAINTENANCE Panel ................................................................................................29
1. General ...................................................................................................................29
2. Setting the clock: ......................................................................................................29
3. Channels tab ............................................................................................................30
4. Factory configuration................................................................................................30
5. Reset of the Gyrotork................................................................................................30
XIII. ASSOCIATED PRODUCTS ............................................................................................30
1. Acquisition software .................................................................................................30
2. Interface Cables........................................................................................................30
XIV. APPENDICES.............................................................................................................31
1. Error Messages.........................................................................................................31
2. Factory Settings........................................................................................................32
3. Connections.............................................................................................................32
4. Setup Examples ........................................................................................................34
5. Dimensions..............................................................................................................35
Revision
Date
Description
Rev 6.10
25.04.2016
2.1; 2.3;
3.1;
6.2.2; 6.4
9.1; 9.5.2;9.5.3
Rev 6.19
31.01.2018
VI.2
VIII.2000 values
IX.5.a
IX.5.d
XII.5
XIII.1

Instruction Manual –V6.19
GYROTORK DUAL version
- 3 -
I. INTRODUCTION TO THE GYROTORK
Thank you for choosing the GYROTORK gauge manufactured by ANDILOG Technologies.
This torque gauge is the result of 25 years experience in torque and torque measurement with new
electronic technologies offering a higher-performance and more reliable instrument.
Though it is a very comprehensive instrument, the GYROTORK torque gauge is easy to use. This
instruction manual will guide you to set your first measurements.
DEFINITIONS:
•Internal Channel or V1: Torque transducer wrench
•External Channel or V2 or SPIP: Angle sensor
Output : RS232, USB, TOR
Color Touch Screen
Display Curve : Torque/Time
Connectors for additional
sensors: torque, displacement
or angle using our SPIP
technology
Rotating Screen
User friendly menu

Instruction Manual –V6.19
GYROTORK DUAL version
- 4 -
II. HANDLING
CAUTION - Unpacking: Your GYROTORK torque gauge has been supplied in its carrying case. Check
that it has not been damaged during transport. If you have any doubt, please contact us and our
service support will you guide you through simple checks to ensure that the gauge has not been
damaged.
1. Unpacking
The GYROTORK gauge is supplied with:
•A carrying case (according to your setup)
•A power plug adaptor
•A torque Certificate of calibration
2. Recommendation before first use
a.Battery
The battery reaches its maximum capacity after several charges. This is very important! A new
torque gauge has a battery that does not have its full capacity at the first power on. The torque
gauge will shut down automatically if the battery is too low.
The battery life is 8 hours under normal use. The gauge should be charged after normal use. You
should charge it every 3 weeks, to ensure maximum life of the batteries.
It is recommended to use the original power adaptor supplied by ANDILOG Technologies. The power
adaptor has the following specifications: 12V, 1.5A
b.Sensor
In spite of its mechanical protection, sensor overload can damage the instrument. The
instrument stops if its capacity has been exceeded 10 times. If you overload it 10
times, you have to return it to ANDILOG TECHNOLOGIES for checking.
It is important that measured values are under 90% of the sensor’s capacity.
c. Test Stand
The display can be affixed to a test stand via two M5 or two 10-32 screws, which
should not extend through the back cover more than 3 mm. Please contact ANDILOG Technologies if
you need more information or if you need a fixture to mount your torque gauge to a test stand.
d.Conditions
•Working Temperature: 0°C to +35°C
•Stock Temperature: -20°C to +45°C
•Humidity: 5% to 95%
•Altitude: 3000m

Instruction Manual –V6.19
GYROTORK DUAL version
- 5 -
3. Starting your torque gauge
Press the ON/OFF button, the information screen showing the status of the GYROTORK torque gauge
is displayed for 5 seconds and then the main screen is displayed.
Battery condition: Displays the battery’s state
Date: Display the date according to the format DD/MM/YYYY or MM/DD/YYYY setup under the
maintenance menu (see chapter “maintenance”).
Software version: indicates the software version installed on the torque gauge
Internal and External sensor: show the type of sensor (torque, displacement or angle) and its
condition.
•A red X indicates a disconnected sensor or a major failure.
•A red exclamation point! Indicates a minor issue on the sensor - An overload or a calibration
date pasted.
Sensor Information: The GYROTORK gauge detects when turned ON, the internal and external
sensors are connected. External sensors are linked to GYROTORK Gauge through a special connector
called SPIP.
•For a GYROTORK Dual, both sensors (internal and external) are simultaneously scrutinized
The following information regarding the sensor is displayed:
•V1 for internal or V2 for external.
•Date the next calibration is due
•Number of overloads
Battery
condition
Type of sensor
(Torque, Angle,..)
Warning
Date
Sensor Information
Software
version

Instruction Manual –V6.19
GYROTORK DUAL version
- 6 -
4. Main screen –Measurement
After the starting (identification) screen, you access the main measurement screen as displayed
below. According to the configuration of your GYROTORK, some information will be displayed, or not.
Note: the described parameters below are part of the default configuration
1. Information bar - The name of your device and battery status are displayed: Low battery
indication: pictogram indicating the battery power status via 4 horizontal lines which respectively
symbolize 25%, 50%, 75% and 100% of power. Press this field to access to the Main MENU
2. Sensor Capacity: The capacity and unit of your device is displayed at any time, even for additional
remote external sensor.
3. Bar Graph: A black line represents the applied torque. If the bar graph is full, it means that the
sensor’s maximum range is reached: risk of overload! If the “limit set points” are activated, colors
may change according to the current applied value (see dedicated chapter).
1. Information bar: Version and
Menu Access
Battery information
3. Bar graph
2. Sensor capacity
Graph Area
4. Main display
5. Auxiliary display
Help
Forward data
7. Sensor direction
Test Stage
6. Value name

Instruction Manual –V6.19
GYROTORK DUAL version
- 7 -
4. Main display: Many values can be displayed in this window. See display screen chapter for details.
5. Auxiliary display: Many values can be displayed in this window. See display screen chapter for
details.
6. Value name: displayed in the main and auxiliary displays is shown in the upper left corner of each
screen. We will see in Chapter IV how to change the displayed value.
7. Sensor direction: An easy-to-remember small symbol indicates the direction of the torque applied
to the sensor: tensile and compression
5. Touch area on the Measure screen
Each area of the measurement screen provides access to the configuration menus of the torque
gauge.
Main MENU
Test
Statistics
Tare
Validated
Help
Send
Set
points
Stop test

Instruction Manual –V6.19
GYROTORK DUAL version
- 8 -
6. Main MENU
To access the main menu, press the green bar at the top of the screen. It will display the main menu:
Display Change displayed test results
Test Activate and change graph display parameters
Statistics Activate and select values for statistical analysis.
Communication Select and activate communication.
Setups Basic setups
Maintenance Diagnostics
7. Tare your device:
Touch the main display area to zero-out your torque gauge.
This action tares the gauge. The gauge will take into consideration the weight of accessories (hook or
plate) fixed on the sensor’s rod.
Taking this action resets all memories and peak values.
NOTE: When turned ON the GYROTORK completes several self-tests to check the sensor’s health. It is
possible to leave tools fixed on the torque gauge, but the total weight must not exceed 10% of the
sensor’s maximum capacity.
8. Backlight
When using the torque gauge, the backlight automatically turns off after a preset time of operation.
The total battery life of the GYROTORK will be reduced when the backlight is turned on.
.
Test Setup
Main display setup
Basic and general
Setup
Statistics Setup
Communication Setup
Maintenance

Instruction Manual –V6.19
GYROTORK DUAL version
- 9 -
III. START your measurements
The GYROTORK allows you to draw a graph of your test. The following screen is displayed:
Graph Displaying
Area
First channel axis
Angle axis
Test state Indicator

Instruction Manual –V6.19
GYROTORK DUAL version
- 10 -
1. Measurement principles
When the curve mode is activated, the torque gauge is under the “TEST” mode. Here is the process
of a TEST:
By default, the gauge graphs the curve of the active channel/Time for the Star version, and
channel1/channel2 for the Dual version. They are 3 values for the graph scale: 25%, 50%, and 100%.
At the end of the test, the graph is automatically drawn to efficiently use the space available.
There are 3 possibilities for the axis position: positive measure, negative measure, positive and
negative measure.
2. States Indicators
On the left corner of the main screen, the state indicator is displayed:
Stand-by mode. Waiting for an event to start.
Acquisition mode. Acquiring data.
Test complete. To start a new test tares the torque gauge.
If you would like to stop the test before the end of the time, press the state indicator.
3. Graph displaying area
To start measuring and drawing the graph, you must touch the main display area to tare. When the
GYROTORK detects a load on the sensor, it will start measuring torque & drawing the graph.
While applying a load to the gauge, the graph is drawn on the screen and the current and maximum
values are displayed according to the setup in the SCREENS settings.
The GYROTORK data capture rate is 5,000Hz, however, for better readability; it displays a maximum
of 1000 points per graph.
Tare torque
gauge
Waits to detect
torque on the
sensor
Start measuring,
recording torque
and drawing the
graph
Stop the test at
the end of the
set time.

Instruction Manual –V6.19
GYROTORK DUAL version
- 11 -
If you wish to acquire a more precise graph, you can transfer the data to your computer under
continuous mode:
•The RS232 output allowing a maximum acquisition rate of 100 values per second
•The USB outputs allowing a maximum acquisition rate of 1000 values per second
The state indicator changes from to.
To stop the graph acquisition, touch the graph area. However, the acquisition automatically stops
after the selected time in the graph setup screen. The test length can be set, see Chapter “Graph and
test settings”.
At the end of the acquisition the state indicator changes to .
At this step, you can:
•Read the graph
•Read calculated values during the test by touching the statistics window.
•Download calculated values or the graph on a PC through the RS232 output (using the send
data key)
•Set a different Test setup
•Erase the graph by touching the graph display area
To start a new test or change to display mode, you have to erase the graph by touching the graph
display area or zeroing the gauge by touching the main display window.
IV. DISPLAY setup
The setup of the test display can be changed from the “Display” menu. Select the icon.
The following screen is displayed; each parameter allows you to manage the information displayed
on the main measurement screen.

Instruction Manual –V6.19
GYROTORK DUAL version
- 12 -
1. Main screen
The main display area can show all of the values that appear in the list. Touch this value to display
the list of available values. Select the sensor you want to display by touching the green window
(channel 1: internal or channel 2: external).
•The available data are: raw data, Peak (maximum), minimum, calculation1 and
calculation2 (see chapter “Setting calculation”)
2. Auxiliary
The Auxiliary display window has the same parameters as the Main screen, so it allows you to display
a second selection.
3. Curve
You have 3 choices:
•Displays the curve and two values: select “curve” (as in the figure above)
•Shows two values but no curve: select “None”
•Shows three values but no curve: select the third value to be displayed
When the curve is not displayed, the bar graph option always represents time.
4. Bar Graph
Select the sensor and type of data displayed in the bar graph. Same parameters as the main screen.
5. State
Show or hide the output status display.
6. Digits
Number of digits right of the decimal point for all displayed data are selected from the drop down
menu after touching the arrow key.
7. Time unit
Select the time units between: minute, seconds or milliseconds.
9
4
6
8
7
1
2
3

Instruction Manual –V6.19
GYROTORK DUAL version
- 13 -
8. Sensor Units V1
Sensor units are independently selected. Touch the arrow key in the desired display window to
display all available units. The units allowed will change with the sensor attached. Torque or travel
units.
The green key above the unit selection determines the sign of the displayed value, either: +, - or no
sign can be selected.
9. Set points - Limits
Allows you to access to the limits setting screen, see the chapter “Limits”
V. SET POINTS Setting - Limits
To access the limits settings touch the bar graph on the main screen or touch the button “limits”
from the “Display” screen. The limits feature allows you to setup action under the condition of the
current values. Those actions can be: enable an output or the buzzer.
1. Activate/Deactivate
Touch the area “Touch to activate” or “Touch to deactivate” to activate or disable the set points
menu.
2. Torque transducer tab
A separate tab is displayed for each sensor. Select the desired sensor tab and set your limit value.
Your gauge can beep and activate a TTL output once the sets point has been reached.

Instruction Manual –V6.19
GYROTORK DUAL version
- 14 -
3. Type of Data
You can either choose to apply the set point to the “Raw Data” or the “Peak value”. Usually, the raw
data is used but you can setup a limit on the maximum or a calculation (mean, standard deviation,
break... see chapter “Graph calculation settings”).
4. Top and Bottom limits
You can setup a top and a bottom limit for each channel by touching the button and entering the
limit value from the displayed keyboard.
Then you can select “buzzer” if desired for each limit.
The set points will be displayed on the main measurement screen on the bar graph area and during
the test; the current reading will change of color when a limit is reached.
5. Activate an Output
The limit can control a TTL output action. Select the desired output. The output action is chosen by
setting the desired output in the output control. Set the action and state as required.
Operations:
•If the bottom limit is the only one set, the state of the output will change when the measured
value will exceed the limit value.
•If the bottom and the top limit are set, the state of the output will change when the
measured value will be in-between the limit values

Instruction Manual –V6.19
GYROTORK DUAL version
- 15 -
VI. GRAPH & TEST Settings.
Touch the graph icon on the setting screen
1. Setups tab.
Touch the control in the upper left corner to enable or deactivate the graph.
2. Test settings
There are 2 parameters that need to be defined to setup a test
•The start condition of the test
•The duration of the test
a. Start settings of the test
Once the torque gauge is zeroed, the GYROTORK is waiting for an event to start the acquisition.
There are two types of possible events:
•Load applied on the torque transducer
•External event, for example: Input on the torque gauge through a trigger signal, pedal...
Choose the start condition in the roll menu (“Value 1” for the internal torque transducer or “Value 2”
for the external torque transducer, “Pedal, I& or I2” for the external event).
If you choose “Value” 1 or “Value 2”, you have to define the threshold percentage that starts the
acquisition. Example: the torque transducer has a capacity of 15Nm maximum, the test graph will

Instruction Manual –V6.19
GYROTORK DUAL version
- 16 -
start when the torque reaches 1% of 15Nm (0.15 Nm). Touching the percent sign gains access to the
adjustment keypad.
From the Software Version V6.18 on, the starting value for the threshold is absolute, for ex: 1 Nm.
b. End of the test
Select the duration of the test. This run time has an influence on the curve resolution. Example: if
you’re running time is 10 seconds and the resolution of the curve is 1000, you will record a point
every 0.01 seconds.
Touch the control to activate the keypad. Enter the desired test time.
Note: A test can be stopped before the end of the running time by touching the icon or using
an Input from the torque gauge. See “Chapter X –Input & Output”. The test may also be stopped on
the activation of an output as the result of a calculation for example. However this stop before the
end of the test will have no effect on the curve resolution and fewer points will be recorded.
Example: if your running time is 10 seconds and the resolution of the curve is 1000, you will record a
point every 0.01 second. If the test is stopped after 5 seconds, the acquisition will record 500 points
and the resolution will still be equal to 10ms.
3. Curve Resolution
The graph display resolution is adjustable from 1 to 1000 points, by default it is set to the maximum
at 1000.
4. Axis H & Axis V
Horizontal and vertically displayed data can be changed by touching the name of the axis. You can
choose to display: the time, internal channel (Torque 1), External channel. So you can display:
-The internal channel vs. time
-The external channel vs. time
-For GYROTORK Dual only: internal channel vs. external channel (or vice versa)
-For GYROTORK Dual only: internal and external channel vs. time
5. Output control
Graph completion can cause an output control to change. Select the output control from the drop
down menu then select control action and state. You can select two types of actions:
•Beep: Toggle the buzzer control to enable the buzzer for the output condition if desired
•Activate an Output of the torque gauge: choose the output to activate (from 1 to 6) and its
running mode: pulse or switch mode and high or low state. For more details on the
input/output see “Chapter X – Input & Output”.

Instruction Manual –V6.19
GYROTORK DUAL version
- 17 -
VII. CALCULATION Settings
The GYROTORK torque gauge allows you to setup automatic calculations derived from the graph. The
settings of the calculation can be done in the Test menu. It is possible to perform 2 simultaneous
calculations in addition to raw data, the maximum and the minimum.
1. Calculation
The GYROTORK allows you to select 2 calculations, derived from the graph. Select the Calculus 1 or 2
tab. The Test running mode should be activated to perform calculation.
The following calculations are available:
Average - The average of load readings over selected time or travel. Select time or travel parameters
after selecting average.
Break - The calculated break point. Select the percent of peak to determine break point after
selecting break.
First Peak –Select the first peak in multiple peak graphs. Select the percent of peak to determine
peak point after selecting First Peak
Torque at T -Torque at a specific time. Select time in milliseconds.
Torque contact –Calculates the maximum torque when you’re closing a contact or a switch plug on
the Input E1 (for example the external button on the wrench).
Level L –Calculates the value of a channel, when the other channel has reached its defined limit
(absolute: the time increments when the test starts / relative: the time increments when the curve
starts, meeting the start condition on torque value, to be used for Top load tests)
Peak –The maximum torque or torque measured during the test.
Moving average –Rolling average or running average
Speed: Speed calculation in real time of the selected channel
Stiffness: Calculate the slope of the curve between two values
Time of peak: Return the time value when the peak have been reached

Instruction Manual –V6.19
GYROTORK DUAL version
- 18 -
2. Output actions
After each calculation, it is possible to activate an output of the torque gauge.
Select the output control from the drop down menu to activate (from 1 to 6) then select its running
mode: pulse or switch mode and the high or low state. For more details on the input/output see
“Chapter X – Input & Output”. These actions can be very useful when you want to communicate with
the test stand. Example: stop the test stand when the torque gauge detects the torque break.
VIII. RECORD DATA AND STATISTICAL Mode.
The GYROTORK has a memory of at least 2.000 values per channel and automatically calculates the
sleeping mean, the standard deviation and the mean divided by the standard deviation. It is possible
to record 3 results simultaneously. Choose between: the maximum, the minimum and calcultaion1
and calcultion2.
Note: The torque gauge can’t record multiples curves. Only the last curve is stored. You have to
connect the torque gauge to a computer or use the USB memory stick called DATASTICK to save
multiple curves.
Statistics and memory can be enabled by touching the statistics symbol on the setup screen.
1. Statistics setup
1: Select the desired result to be entered into the statistic arrays; you can choose 3 types of values to
record: maximum, minimum, calculation1 or calculation2 for each channel. Select the units desired.
2: More than one result can be averaged to create a saved result. Enter this number in the Samples.
3
1
2
4

Instruction Manual –V6.19
GYROTORK DUAL version
- 19 -
3: By default the “Tare” will be done automatically once the results are saved; but you can de-
activate it.
4: Then you would be able to display the tab of values by touching button “Arrays”.
2. Record data
When the statistics feature is activated, the following icon is displayed on the main measuring
display. After a test is completed, you can save the test results to the statistics array by pushing the
icon:
To save the data, you have to tare the gauge. At the end of the test, press the icon above
to validate and save the data. The values are added to the array and the average value is
calculated and displayed in the window on the top right:
To view all the calculations and the statistical results touch the mean window. You can then transfer
those results to a computer through USB, RS232 or a memory USB stick. See the Chapter
“Communication Setup”
Table of contents
Other ANDILOG Test Equipment manuals
Popular Test Equipment manuals by other brands

National Instruments
National Instruments NI PXI-2567 SAFETY, ENVIRONMENTAL, AND REGULATORY INFORMATION

Stahlwille
Stahlwille perfectControl 7794-2 operating instructions

Alcohawk
Alcohawk AT7000 Operation manual

VOLTCRAFT
VOLTCRAFT VC-62 operating instructions

Agilent Technologies
Agilent Technologies 54622A user guide

YOKOGAWA
YOKOGAWA DL2700 Series Service manual

CPS
CPS AC-PLC KIT-800V/US Installation and operation manual

Keysight
Keysight InfiniiVision EDUX1002A user guide

PCE Health and Fitness
PCE Health and Fitness PCE-HT 225E manual

Wetekom
Wetekom 826786 instruction manual

Keysight Technologies
Keysight Technologies B1542A Pulsed IV Package user guide

Monarch
Monarch Nova-Strobe BBX Replacement guide