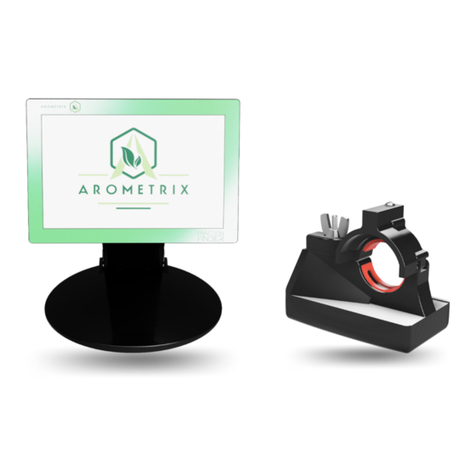
Arometrix FRACTION FINDER User manual

FRACTION FINDER
USER MANUAL for Firmware Version 1.2.3
with
APPLICATION NOTES
YOU MUST READ THIS MANUAL BEFORE USE
WARNING: NEVER LOOK DIRECTLY INTO THE LIGHT SOURCE

2
TABLE OF CONTENTS
Section 1: Description and Principles of Operation 3
Section 2: Construction 4
Section 3: Unpacking and Inspecting 4
Section 4: Understanding the Interface 4
Section 5: Installation 9
Section 6: General Procedure for Short-Path Distillation 10
Section 7: Issues 15
Section 8: Software Update Instructions 16
Section 9: Factory Repairs 16
Section 10: Optical Measurement 17
Section 11: Specifications 17
Section 12: Appendix 19
Section 13: Terms and Conditions 20
Application Notes: Flip to the back of this manual to find Application Notes for Wiped/Thin Film Evaporation
and Ethanol /Centrifuge Extraction.

3
Section 1: Description and Principles of Operation
The patent-pending FRACTION FINDER is the world’s first in-line molecule monitoring system for botanical
oil production. The technology uses “in-situ fluorescence spectroscopy” to measure molecules based on
how they interact with light. The FRACTION FINDER is used to identify the contents of a flow through a
glass tube in-situ, in real-time. Knowing the flow and the relative concentration of molecules, and whether
that purity is increasing, or decreasing can help make optimal process decisions. In our work, we found
processors were proudest of their craft when they could get the purest, most consistent batches for their
clients. It is with this goal in mind that the FRACTION FINDER was developed.
The result is the FRACTION FINDER, a real-time process monitoring system that allows the user to see:
●The relative concentration of Cannabinoids
●The flow of Cannabinoids
This spectroscopic technique was borrowed from other industries and empirically applied to in-situ
Cannabinoid processing. Our research was conducted in processing labs that were running first and second
pass short path distillation for the purpose of creating the purest Cannabinoids oils.
The ability to directly track molecules of interest during the process comes with a few key benefits:
●The data to improve purity and reduce by-products
●The information to improve process techniques and enhance process repeatability
●The ability to quickly train staff and have run traceability
What the FRACTION FINDER is not:
The FRACTION FINDER is not a quantitative measure. It provides qualitative process information that directly tracks the relative
concentration of Cannabinoids. It is Arometrix’s goal to amass enough spectral data from the FRACTION FINDER to eventually be
able to determine quantitative purity in the
future
.
The FRACTION FINDER cannot replace good laboratory practice and experience. The FRACTION FINDER’s data, in combination with
temperature, vacuum, good laboratory practice, and experience will help technicians further perfect their craft.

4
Section 2: Construction
The FRACTION FINDER is composed of two key components: the sensor and the display.
Sensor: The sensor
contains the “eyes” of the system”. This optical transducer uses a light source and a
full wavelength spectrometer along with signal conditioning circuitry and advanced analytics. The sensor
is mounted on size 29 or 34 glass, depending on the sensor size option ordered. Adapters are also
available for purchase to get the sensor on smaller glass, such as size 24 glass.
Display: The display
contains the “brains” of the system. This 7 inch LCD TFT display consists of a
compute module. The information from the sensor is digitally transmitted via the sensor cable to the
display
, where the spectra are cataloged, analyzed, graphed and displayed as a function of time. The
display
then does additional math on this multi-wavelength spectral temporal data (hence the term
“compute module”) and creates a visualization for the user where both flow and relative potency are
deduced. The display
has a pole-mounting bracket installed in the back of it so it can easily be mounted to
a lab pole.
Note: This unit is intended for lab use. Care should be taken not to spill anything on it, as it is not waterproof.
Section 3: Unpacking and Inspecting
After the instrument is received, it should be carefully
unpacked and inspected for damage during shipment
and to confirm that all components are present.
Each FRACTION FINDER comes with:
●Fraction Finder Sensor (Size 29 or 34)
●Display (with pole mounting bracket screw)
●Sensor Cable, USB, 2 feet
●Light-Blocking Tape
●International Power Supply
●Glass Adapter (optional/if required)
●Warranty Card
●Instructions
Section 4: Understanding the Interface
After installation, the system is ready for immediate operation. The FRACTION FINDER is meant to be an
additional reference to existing methods for determining the current part of the distillation fraction. NOTE:
This section focuses on using the FRACTION FINDER for fractional distillation. If you are looking to use the
unit for extraction or chromatography, visit arometrix.com/resources to read our different application
notes.

5
Layout of Software and Different Viewing Options
There are currently two viewing options: the Spectrum view
and the Wavelength view
. These display
options can be toggled between each other by tapping the “display” button (located in the top-left
corner).
Spectrum View (Spectrograph)
What it does: Displays current background/ambient light corrected spectral measurement.
How it should be used:
1) Give a broad indication of whether the system is detecting Heads or Main Body/Tails
a. This is an instantaneous representation of the current spectral state.
b. This tab is difficult to track the Main Body and Tails change; use the Overlay button to
assist with this.
c. The peak at 360-390nm is an internal excitation/reference peak (not a process indicator);
tap the small circle on the top-left corner of the graph to remove this peak
2) Analyze current Exposure time and assist in “tuning” of exposure time parameter
Understanding the Graph (X-Y Axis)
●X-axis = Wavelength (nm)
: The location of where the line shoots up (or fluoresces) indicates the
molecule; different molecules have different wavelength regions
●Y-axis = Intensity (counts)
: The height of this line, in general,
indicates how much of that substance
is present at that moment relative to earlier.
Wavelength View

6
What it does: Displays and tracks the interpreted values from your measurement. This plot reduces the
raw data and shows you the “highlights” of the run.
How it should be used:
1) Used to identify when the distillation is transferring from Heads to Main Body, or Main body to
Tails
a. Due to the massive amount of data reduction, this plot is hard to analyze when trying to
assess issues with individual measurements from the FRACTION FINDER
2) Analyze noise in your measurement over time, and assist in “tuning” of scans to average
3) This view is especially useful for tracking particular chemical oddities that occur at specific
wavelengths. (One example is tracking both Chlorophyll and D9 during an extraction run.)
Understanding the Graph (X-Y Axis)
●X-axis = Time (HH:MM:SS)
: As opposed to the Spectrum view, this tracks fractions as a function of
time.
●Y-axis = Intensity (AU)
: The height of this line indicates how much of that substance is present at
that moment relative to earlier. (Note: These are AU as in Arbitrary Units; this is not quantification
of potency.
)
Setup Screen Tutorial

7
List of buttons:
A. Display: Toggles between the two viewing options (Spectrum View & Wavelength View)
B. Details: Expands the graph and removes the data on the right-hand side
C. Overlay: Traces or “overlays” a peak of interest so you can compare it to a future peak
D. Clear: Clears an “overlay” that you no longer want to track
E. Transfer: Transfers recorded run data to a flash drive
F. Reference Peak Remover: Removes the internal reference/excitation peak from Spectrum view
G. Auto-Zoom: Returns zoom view to normal. You can zoom with 1 finger by drawing a bounding
box.
H. Home: Returns you to the Home if you are in Settings
I. Settings: Allows you to adjust settings, such as Auto Integration Time, Scans to Average, and the
Wavelength Tracker
J. Region 1-3 Checkboxes: Use only when in Wavelength viewFor Wavelength View - By checking this
box, it will populate the Wavelength plot with the corresponding molecule tracking. For Spectrum
View - By checking this box, it will highlight the Spectrum plot with the region that molecule
fluoresces at. ThisRegions setting can be adjusted and edited in Settings.
K. Region 2 Checkbox
: See I.
L. Region 3 Checkbox
: See I.
M. Light on/off: Turns the light on. This toggles between states.
N. Record on/off: Turns the recording mode on. This toggles between states.
Settings Page Tutorial
When you tap the Settings
button, you will see:
●Wavelength Settings
●Set Integration Time
●Set Scans to Average
●Clock Settings
●System Data
Wavelength Settings

8
In this tab, you will see:
●Edit Wavelength 1
●Edit Wavelength 2
●Edit Wavelength 3
These correspond with the Region 1, Region 2, and Region 3 that are shown on the plots. When you press
one of these, you will see a Wavelength range. These will come preset with manufacturer’s defaults;
however, you can edit the From
and To
how you see fit. See below.
Click “Default” to return back to manufacturer default. Next to the “Default” button, you will see a
molecule dropdown. When you press the Molecule Indicator dropdown, you will see different molecule
tracking options. You can select any of them, or set your own “Custom” molecule and region. See below.
Set Integration Time
This is meant to enable “AID (Auto)” by clicking the checkbox in the bottom-left corner of the screen. Auto
integration ensures that the signal from the spectrometer is maximized. It is not recommended
to
manually tune Integration Time, but it is feasible. See Appendix for more information on manual tuning.
Set Scans to Average
This sets how many optical readings the sensor takes before plotting and displaying a result. More
readings that are averaged imply less noise, but less information. Arometrix recommends that you select
5.
Clock Settings

9
This should be set during initial acquisition. Set the Date Settings and the Time Settings. Then, Submit.
System Data
This will display “Bytes Available”, “Bytes Used”, and “Bytes Total”. It will also show you % memory used,
and give you an option to “Clear Data”.
Section 5: Installation
The equipment should be in a clean, dry environment for the best results. Care should be taken to avoid
any spillage. NOTE: If you are using the system with a Wiped Film Evaporator and/or Extractor, please
also read the Application Notes in Section 7 and Section 8, respectively.
1. Apply the light-blocking tape
to the glassware apparatus, leaving an area for the sensor to be
installed. This is important as it will block ambient light from saturating your sensor’s readings.
2. Install the optical sensor with the thicker part of the sensor down
. For short-path distillation, the
sensor
should be installed on the condenser just before the cow as shown.
(1) Having the glass be of high quality will help increase the signal to noise ratio – which will
yield better information.
(2) The sensor fits on most glass, but in some cases may require a slight extension; on
Arometrix.com/shop, there are adapters that will satisfy a wide range of applications,
including short-path distillation systems with Size 24 glass or “Hot Tech” condensing
processes, as well as wiped film evaporators and extractors.
3. Insert the sensor cable
into the back of the sensor
.

10
4. Connect the other end of the sensor cable
to the bottom of the display
. The sensor’s
light
will
begin to “blink”, indicating that it has turned on. Give the sensor ~2-5 minutes to boot up.
5. Mount the display
to a lab pole. The back of the display has a pole-mounting bracket
pre-installed. Simply use the screw for the mounting bracket
on the bracket to install and keep it
snug on the pole. Alternatively, it can be placed on a desktop by placing the unit in a separate
tablet stand.
6. Use the supplied AC adapter to power your display. This adapter provides clean short protected
power to protect and ensure the accuracy of the internal circuitry.
7. The display will take a few seconds to turn. You will see splash screens, followed by the interface
screen. (
Section 5
will delve further into the interface.)
8. Ensure that the Device Status and Server Status indicator on the bottom left-hand side of the
display
are green – If not, make sure the cords are properly connected.
9. Ensure that the “Light On/Light Off” toggle button is turned on. The light above it should be green.
Section 6: General Procedure for Short-Path Distillation
The Fraction Finder was designed initially for short path distillation applications. Thus, the general
procedure in this standard user manual focuses on how to operate the Fraction Finder for this specific
application. However, the Fraction Finder can also integrate into processes such as Wiped Film
Evaporation, Ethanol Extraction, and soon Chromatography. NOTE: If you are using the system with a
Wiped Film Evaporator and/or Extractor, you may advance to Sections 7 and Section 8, respectively.
Once you’ve read the appropriate application note, continue at Section 9 to learn more about how to
troubleshoot issues and more.
Overview
1) Set Up Distillation System and Install Fraction Finder Equipment (as detailed in
Section 4
)
2) Set Integration Time to Auto
3) Set Scans to Average to 5
4) Identify Transition from Heads to Main Body
5) Perform Flask Transfer & Let Distillation System Equilibrate
6) Identify Transition from Main Body to Tails
7) Perform Flask Transfer & Let Distillation System Equilibrate
8) Turn off Recording

11
Step 1) Set Up Distillation and Install Fraction Finder Equipment
1) Set up your short path distillation system as you usually would initially
2) Follow all steps in Section 4 Installation
a. Reminder: Ensure that the Device Status and Server Status indicator on the bottom of the
display
are green.
b. Reminder: Ensure that the light is on. If the light is not on, turn it on and wait for the
indicator light above the button to turn green.
3) Let the distillation system reach desired vacuum temperature and pressure
Step 2) Set Integration Time to Auto
To set sensor Integration Time
: Tap the Settings gear icon. Tap “Set Integration Time”. There is an AID
(Auto) checkbox on the bottom-left corner of the display. Tap the checkbox - a check will appear,
indicating that auto-integration determination has been enabled. This is strongly recommended
as it will
auto-determine an optimal integration time for the sensor throughout the entirety of the distillation. It is
not recommended to manually tune Integration Time, but it is feasible. See Appendix.
Step 3) Set Scans to Average to 5
To set sensor Scans to Average
: Tap the Settings gear icon. Tap “Set Scans to Average”. A typical value
between 1 and 5 – It is strongly suggested that the scans to average is not set significantly larger than this
value.
Step 4) Identify Transition from Heads to Main Body
While
you are in “Heads”, you should see ONE single peak at ~365 nm (x-axis) on the Spectrum view
. This
is NOT a process indicator. This is the internal reference peak that the system uses.
Note: Arrow on graph is for illustration purposes only.
Depending on the software version that you are using, this peak can be removed by tapping a small button
on the display. Once removed, during Heads, you should see NO peaks in the Spectrum view.

12
However, if you see MULTIPLE peaks, this means that either: You have bad light contamination from
lighting in the workspace (Solution
: use the light-blocking tape) OR, if the peak is at 400-500 nm (x-axis
value) the column is probably not clean and contains a contaminate from a previous distillation (Solution
:
Either stop the distillation and clean inside of glassware OR
just make a note of it – it will likely be cleaned
when the vaporized Heads flow through the column).
If you switch to the Wavelength view
, you will also see no fluorescence, as depicted in the image below.
If you would like to Record your run, and export the run data afterward, now would be an optimal time to
press the “Record” button. The circle above this button will turn green to indicate that it is recording.
Prior to the Main Body fraction, you will likely see a signal at around 420 nm. This is what is referred to as
“Fool’s Gold”. “Fool’s Gold” is an unidentified species that looks gold in color. Due to its golden hue,
during short-path distillation, it “fools” the operator to thinking that the desired Cannabinoid has
appeared; but, in actuality, it is not. The wavelength region for “Fool’s Gold” is 405 nm – 435 nm. The
waveform for “Fool’s Gold” is sharp. Refer to our Chemical Cheat Sheet for more information on this.
For the actual Heads to Main Body Transition, there are two separate methods for identifying this:
Option A - Spectrum View: The other indicator is that a broad peak shows up in the Spectrum plot
between 440-450nm. An example plot is shown below; keep in mind peak location and intensity may vary.
See our “Chemical Cheat Sheet” to learn about where and how each molecule fluoresces on the unit.
Arometrix recommends that you use the Spectrum plot for an absolute indicator of the Heads to
main-body transition.

13
Note: Arrow on graph is for illustration purposes only.
Option B - Wavelength View: This view will show that there is a big peak in the value of the wavelength
plot. An example plot is shown below.
Note: Arrow on graph is for illustration purposes only.
Step 5) Perform Flask Transfer & Let Distillation System Equilibrate
1) Once you’ve entered Main Body, proceed as you typically would with a flask transfer.
a. It is advised that the Heads be allowed to distill for ~10 minutes before performing a flask
to ensure that no solvents contaminate the Main Body.
b. There is no need to turn off or hit the clear button on the FRACTION FINDER, unless you
want to.
2) After flask transfer, let the system come to its equilibrated point (let pressure and temperature
become relatively constant) before using the FRACTION FINDER
a. Keep in mind that the signal will be very low and all ambient lighting effects will greatly
increase
b. Equilibration time will depend on system size. A 5L SPD can take 5-10 mins. A 10L SPD can
be 10-15 minute. Mantle quality and pump quality are also factors for equilibration time.
Step 6) Identify Transition from Main Body to Tails
1) After 20 minutes from the flask transfer from Heads to the Main Body, the signal will become
more stable

14
2) Check the Wavelength View
3) A sharp increase of the signal at the beginning will likely be shown, followed by a sharp drop-off of
the signal to a stable moderate level
a. This initial increase is very concreted Main Body initially coming through the system as
well as any oxidized/degraded fluid that may have been generated during the vacuum
release while performing a flask transfer
4) This signal will likely stay constant for the next 1 – 1.5 hours, then will slowly start to raise. An
example plot is shown below.
5) The constant increase or significant increase of signal at this point indicates that the distillation
may be entering Tails, but the signal also could vary slightly with:
a. Significant changes in vacuum pressure
b. Significant changes in flow rate
c. Background light gets brighter
6) If a raise is observed that does not seem to track with the three outlined changes above, the
distillation has entered Tails
For the Main Body to Tails Transition, there are two separate methods for identifying this:
Option A - Spectrum View: This view will show that there is a peak shift to the right, with the peak
centered at around 490-510nm. An example plot is shown below. Note: Our “Degradates” indicator is
equivalent to the Tails fraction. Refer to our Chemical Cheat Sheet for more information on this.
Option B - Wavelength View: This view will show that there is a sharp increase in the value of the
wavelength plot. An example plot is shown below. This view is recommended for this change.
Note: Intensity and trends may vary. The important thing is the signal starts increasing.

15
Step 7) Perform Flask Transfer
Once the Tails are identified, perform a flask transfer as per usual. Keep in mind that the signal will be very
low and all ambient lighting effects will greatly increase
Step 8) Turn Off Recording (optional) If you recorded your run, tap “Record Off”. The circle above this
button will turn red. Then, plug in a USB stick to the bottom of the display. Press “Transfer” to transfer
your run data to a USB stick. It will upload a file in CSV format, easy to work with in Excel.
Section 7: Issues
1) If the signal is an abnormally low signal, a few things should be checked:
a. Ensure that the alignment of the FRACTION FINDER sensor is correct. This can be done by
trying to align the screw in the “light shield” and the top of the light shield with the cooling
water port of the condenser; if they are aligned, the alignment is optimal. The “light
shield” is the half-circle piece of hardware adjacent to the light source.
b. Ensure that the integration time is set correctly by either using the AID AUTO or following
the procedure outlined in step 5
c. Ensure that the Scans to Average is set to 5
2) If the signal looks sporadic and very abnormal, a few things should be checked:
a. If it is right after a flask transfer, wait a few minutes – this is normal behavior
b. If the vacuum pressure is still changing quickly, wait for the pressure to become more
constant
c. If the boiling flask is heating significantly, wait for the boiling flask temperature to become
more constant
d. The issue could be attributed to background light
i. Use the light-blocking tape provided in the kit
e. Ensure that the integration time is set correctly by either using the AID AUTO or following
the procedure outlined in step 5
f. Increase the scans to average
i. This should not be set significantly higher than 5 - keep the value below 15
g. If none of the above are the problem – ensure that liquid is still flowing

16
h. If none of the above seem to be the origin of the problem, please take a photo of both
your spectrum plot and your wavelength plot and contact customer service by calling or
texting (240) 492-6556
3) If the system is not detecting the sensor (bottom left light on panel is red or yellow)
a. If the system was turned on, give the system up to 5 minutes, it may detect
b. Ensure that all cables are connected securely – especially the cable connecting the display
unit to the sensor
i. It may be easier just to disconnect and reconnect the cables from the display unit
and the sensor unit
c. Try identifying and using a new source of power to power the Fraction Finder display
d. Contact customer service by calling (240) 492-6556 extension 3 if the above problems
persist
4) Warnings about safe operating conditions for the FRACTION FINDER:
a. Currently, the FRACTION FINDER is specified to work up to 100 degrees Celsius. Please do
not raise your condenser fluid temperature above this. Should this be a part of your SOP,
then order the “Hot Tech Adapter” from Arometrix.com/shop. This will relocate the sensor
to just prior to the collection flask.
b. The FRACTION FINDER housing (both the sensor and the display unit) are sensitive to
distillate and extract, to increase sensor lifetime and reduce the likelihood of damage:
i. Wipe down the outside of the glass that the FRACTION FINDER will clamp onto
before installing the sensor with ethanol, isopropanol, or another alcohol. DO NOT
USE ACETONE | WARNING: ENSURE THAT GLASSWARE IS NOT HOT!
ii. If an accidental spill occurs, try to wipe it off the sensor/display unit with a damp,
not soaked, cloth/towel as quickly as possible. Dry off the area immediately
afterward.
Other issues and suggestions:
1) We have all of our Fraction Finder resources (including different application notes and our
Chemical Cheat Sheet) available at arometrix.com/resources and education on fluorescence
spectroscopy available at arometrix.com/arometrix-academy
2) We are constantly working to fix any issues with the system, and appreciate you reporting any
abnormal behavior, we will not leave you hanging and will address any issues you have ASAP.
3) If you find anything in this manual confusing or unclear, please customer support, we are more
than happy to assist you, and do our best to do so in a timely manner.
4) If you want to see something new in the software please let us know and give your suggestion, we
strive to make the FRACTION FINDER the tool that works for you!
Section 8: Software Update Instructions
At Arometrix, we strive to tailor-make all our products to our customers' needs. As we advance our
algorithms, add features, fix bugs, etc., we release software/firmware updates. These are field-updatable.
If you own a FRACTION FINDER, you can download our latest, free Firmware update to your software in
the field: Version 1.2.3 - (if you do not already have it). This update will make FRACTION FINDER systems

17
more cohesive and user-friendly. Read below for important instructions on how to go about this
download.
Please visit arometrix.com/software to update your software.
Section 9: Factory Repairs
The FRACTION FINDER assembly is designed to provide years of trouble-free service. No field servicing of
the unit is recommended. The unit should come with a 1-Year Warranty Card.
Section 10: Optical Measurement
The FRACTION FINDER displays optical information in AU (arbitrary intensity units), named to highlight the
fact that the unit is for reference, indication, and to assess trends. It is not currently for quantitative
analysis. Quantitative measurement is a number that represents a characteristic in known,
well-understood units. For example, your speedometer reads a quantitative number – speed. You know
how fast you are going based on that number. Qualitative measurement lacks the reference of a number.
The FRACTION FINDER gives qualitative measurement – and is used to assess trends, not absolute potency.
Section 11: Specifications
SYSTEM
Creator
Arometrix, Inc.
Application(s)
FRACTION FINDER - Distillation (short path, wiped film, thin film)
EXTRACTION FINDER - Extraction (ethanol, cryo-ethanol, centrifuge)
State of Materials
Distillates; extracts
Expected Life Span
10+ years
Shipping Weight
5 lbs
Shipping Dimensions
10″x10″x8″
Technology Validation
Reference
Peer-reviewed research article, published by Cannabis Science & Technology
SENSOR
Type
Standard or Ultra-Sensitive
Technology
In-situ fluorescence spectroscopy sensor (contains an optical light pulse and UV
fluorescence detector)
UV Domain
Near UV
Size(s)
Size 29; Size 34

18
Interface Requirements
Size 29 Glass (28-30mm outer diameter)
Size 34 Glass (31-34mm outer diameter)
AMP Sight Glass, Size 34
Cable Length
2’-30’
Max Temp
100 C
Min Temp
5C
Optical Detection Range
300 – 1000 nanometers
Lower Detection Limit
1 mg/mL (at a volume of 1 cubic centimeter of oil)
Accuracy
Spectral resolution: 15 nm max
Margin for Error
Not applicable to qualitative measurements
Reading Speed
> 1 second
Flow Rate Limits
No flow rate limit
Min Fill Level
1/8 volume
Calibration
No
DISPLAY
Type
7 inch LCD TFT display (contains a compute module with advanced software)
Power
100-240VAC 50/60 Hz CE Rated (12 Volt 1 Amp into Display)
Power Supply
Yes
Mount
Mounts to a laboratory stand bracket (pole up to ½” thick)
Units
Wavelength Nanometers (nanometers); Wavelength Intensity Values (arbitrary
units)
Plots
Spectrogram; Wavelength Intensity graph
Metric Type
Qualitative
Telemetry Options
USB
PLC Communication Type
Serial UART (BAUD: 115200, DATABITS: 8, STOPBITS: 1, PARITY: NONE)
SIGHT GLASS
Creator
AMP Equipment
FDA/USDA/ABS Certified
Gaskets
PTFE
Other Steel Parts
304l
Tube
Borosilicate glass (pyrex)
Stainless parts
304L
Surface Finish
<63u
Sanitary End Clamps
1.5” (2″ extender available)
Maximum Pressure
30 Psi

19
Max Temperature
350F
Min Temperature
-70C
Product Dimensions
6.94in (length) x 4.98in (width)
Section 12: Appendix
Manually Tuning Integration/Exposure Time - It is highly recommended to use the AID as the AID
algorithm will do all the adjustment autonomously. However, manual setting is feasible.
Manually Setting Integration Time for Heads - Tune the Integration Time based on your desired
parameters
1. Tune the exposure time so that the maximum intensity value (y-axis) is between 500-800 AU
a. The exposure time is pseudo-linear to the intensity (i.e. if the exposure time is doubled,
the intensity will approximately double; if the exposure time is halved, the intensity will
also approximately be halved)
b. The exposure time for the Heads typically is very small – the exposure time probably will
not be above 2 ms (2000 µs on exposure time setting panel), and may be lower than 0.1
ms (100 µs on exposure time setting panel)
c. WARNING: The update time for the plot will increase with increased exposure time and
decrease with decreased exposure time. Distillation is a slow process, so this will not be an
issue
i. It is more important that there is a good signal than to have a fast update speed,
so tuning to higher exposure times (as long as the intensity does NOT go above
800 AU – y-axis value), will ensure that the unit will work as intended.
Manually Setting Integration Time for Main Body
1) Go to the Spectrum tab
a. If the maximum signal value is lower than 500 AU or above 850 AU
i. Hit the Light On/Off button to turn light off
ii. Wait for a new scan of the background light in the room
iii. If the maximum value of this spectra is above 700 AU:
1. Adjust the exposure time so that this value is less than 700 AU by
decreasing it
2. The exposure time is pseudo-linear to the intensity
iv. Hit the Light On/Off button to turn light on
2) For the next ~20 minutes, the exposure time will need to be adjusted as the signal change
a. Factors that increase how often it will need to be adjusted are:
i. The darkness of the distillate (darker increase frequency of exposure time
adjustment)
ii. Turbulent flow rate (increases the of frequency exposure time adjustment up to a
point, then will not have an effect)

20
1. This is more of an issue for Tails than the Main Body
iii. Background light (more ambient/background light will increase the frequency of
adjustment; higher ambient/background light will also reduce the overall signal)
Section 13: Terms and Conditions
TERMS OF USE, LIMITED WARRANTY & LIABILITY WAIVER
Arometrix offers all of its products with the following terms and conditions and notices as follows. By accepting and/or using an Arometrix product, you
hereby acknowledge and agree to the following terms and conditions, and acceptance of these terms and conditions are a condition precedent to any
purchase/sale agreement between you and Arometrix.
EXCLUSIVE OBLIGATION: The Arometrix product you are purchasing has been designed for a specific use within a set of suitable operating conditions, as set
forth in its User Manual, or as indicated otherwise by Arometrix. Any use of the Arometrix Product for any purpose or under any conditions, other than
those specified, shall render any limited warranty void, and shall expressly invalidate any liability of Arometrix for damages as a result of such misuse. USER
LIMITATION: You may not modify, copy, distribute, transmit, display, perform, reproduce, publish, license, create derivative works from, transfer, or sell, any
information, software, products or services obtained from or created by Arometrix to any third party, without the express written consent of Arometrix to
do otherwise. Any violation of this provision shall give rise to an indemnification of Arometrix by you, for any third party claims arising out of such violation.
THIRTY (30) DAY LIMITED WARRANTY: All Arometrix products are warranted against any manufacturing defect for a period of thirty (30) days from the date
of purchase, unless such product is a custom-work for you and not a standard Arometrix product. Any product qualifying as a custom-work shall not be
warranted against any defects for any purpose, and your acceptance of such custom-work shall relieve Arometrix of any liability for any purpose. WITH THE
EXCEPTION OF THE LIMITED WARRANTY ABOVE, YOU AGREE ANY Arometrix PRODUCT IS PROVIDED AS IS, EXCLUSIVE OF ANY WARRANTY, INCLUDING,
WITHOUT LIMITATION, ANY IMPLIED WARRANTY OF MERCHANTABILITY, FITNESS FOR A PARTICULAR PURPOSE, NON-INFRINGEMENT, OR ANY OTHER
WARRANTY, EXPRESSED OR IMPLIED. LIMITATION OF LIABILITY: You agree and acknowledge, Arometrix shall have no liability to you whatsoever for any
direct, indirect, punitive, incidental, special consequential damages arising out of or connected with the use or misuse of its products. In particular, given
the nature of Arometrix products, you agree and acknowledge, under no circumstances whatsoever shall Arometrix be liable to you for any consequential
damages for damage to any non- Arometrix product or service, arising from the failure, use or misuse of a Arometrix product, including, but not limited to,
any vacuum system, engine, vehicle, factory, or the like. In the event, a court of law with proper jurisdiction finds Arometrix liable to you for any purpose,
you agree and acknowledge Arometrix’s maximum liability shall not exceed the purchase price of one unit of product giving rise to such liability, or $250.00,
whichever is greater. ENTIRE OBLIGATION: These terms and conditions express the entire obligation of Arometrix with respect to its products. If any part of
these terms and conditions are deemed void, invalid, unenforceable or illegal, including, but not limited to, the warranty disclaimers, liability disclaimers and
liability limitations set forth above, then the unenforceable clause or sentence may be disregarded with the remainder of these terms and conditions valid
and enforced. In the event the unenforceable clause or sentence leaves a void in these terms and conditions, a provision closely matching the intent of the
unenforceable provision should be deemed inherent within these terms and conditions, slightly modified to render such provision valid and enforceable.
GENERAL: These terms and conditions are governed by the laws of the State of Delaware, USA. You hereby consent to the exclusive jurisdiction and venue of
the Courts of Delaware, in all disputes arising out of or relating to the use of this product. Use of this product is unauthorized in any jurisdiction that does
not give effect to all provisions of these terms and conditions. MODIFICATION OF TERMS AND CONDITIONS: Arometrix reserves the right to change the
terms, conditions, and notices under which their products are offered.
Other manuals for FRACTION FINDER
1
Table of contents
Other Arometrix Laboratory Equipment manuals
Popular Laboratory Equipment manuals by other brands

Olympus
Olympus BioLever mini user manual

Zeiss
Zeiss Argon Ion Beam System instruction manual

Metrohm
Metrohm 798 MPT Titrino Instructions for use

Thermo Scientific
Thermo Scientific Sorvall LYNX 4000 instructions

Leica
Leica RM2125RTS Standard operating procedure

Hettich
Hettich ROTOFIX 32 A operating instructions