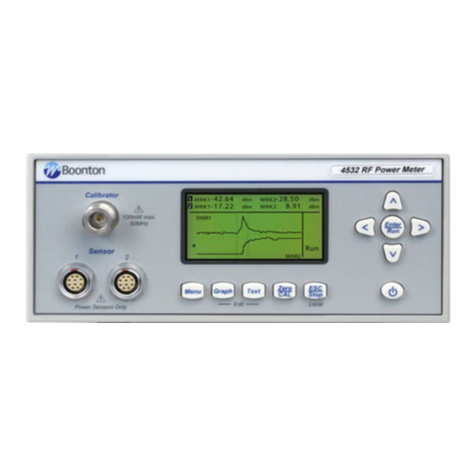
Boonton 4210 User manual

ELECTRONICS CORPORATION
P/N 98100902
791 ROUTE 10, RANDOLPH, NJ 07859
TELEPHONE: 201 —584-1077 TWX: 710-986-821
5
'*** 'Printed in U.S A.
8/8 5

IV

SECTION I
INTRODUCTION
Section I
Introduction
1-1. SCOPE OF MANUAL.
1-2.This instruction manual provides descriptive data,
operating instructions, theory of operation, maintenance
instructions, and aparts list for the Model 4210 R. F.
Microwattmeter. (See Figure 1-1.)
SAFETY NOTICE
Although this instrument has been designed in accordance
with international safety standards, general safety precau-
tions must be observed during all phases of operation and
maintenance of the instrument. Failure to comply with the
precautions listed in the Safety Summary located in the
front of this manual could result in serious injury or death.
Service and adjustment should be performed only by
qualified service personnel.
1-3. PURPOSE OF EQUIPMENT.
1-4.The instrument is amicroprocessor-controlled, solid-
state unit that features ease of operation, high sensitivity,
low input s.w.r., and low noise. It measures r.f. power levels
from 1nW (-60 dBm) to 100 mW (+20 dBm). The cali-
brated frequency range extends from 0.2 MHz to 18 GHz,
depending upon the accessory sensor used; useful response
for relative measurements is obtained from 20 kHz to
approximately 20 GHz. Representative uses of the instru-
ment include:
a. Low-power transmitter, signal generator, and oscilla-
tor measurements
b. S.W.R. and return-loss measurements with direc-
tional couplers and slotted lines
c. Gain and insertion-loss measurements
d. R.F. attenuation and s.w.r. measurements
e. Antenna measurements
1-5. DESCRIPTION OF EQUIPMENT.
1-6.The instrument is packaged as acompact bench unit.
When operated with Boonton Series 4210-4/ 5sensors, the
instrument displays r.f. power by measuring the voltage
across aprecision, non-inductive resistor in the sensor head
with specially selected diodes. Panel indications are cali-
brated in terms of power according to the relationship P=
E2/R. This detection system has important performance
advantages over power meters that use bolometer or
thermo-electric detection. The instrument sensitivity of 1
nanowatt (-60 dBm) is orders of magnitude better; temper-
ature stability of better than 0.001 dB/°C supports this
sensitivity; and burnout levels exceed 300 milliwatts.
average power for all types of waveforms. Above these
levels, the instrument displays, by means of internal shap-
ing, the true average power of c.w. signals. If the r.f.signal is
gated or amplitude modulated, the indicated power may
not be the true average power. The signal may be attenu-
ated to bring it within the r.m.s. region of measurement.
Alternatively, the instrument can be used with thermal
sensors Model 4210-7E/8E; in this case, the instrument mea-
sures and displays the true average power for all waveforms.
1-8 The outstanding design features are:
a. Wide Frequency Range. The calibrated frequency
range of the instrument is determined by the sensor used
with the instrument. The instrument is normally ordered
with one of the following sensors: /,
FREQUENCY RANGE”" 60/
+
to dDnn
Model (Impedance) Power Range
42 10-4A
4210-4B
42 1CMC
4210-4E
42 10-5 B
4210-5E
4210-7E
421 0-8 E
200 kHz to 7GHz (50 ohms)
200 kHz to 12.4 GHz (50 ohms)
200 kHz to IGHz (75 ohms)
200 kHz to 18 GHz (50 ohms)
200 kHz to 12.4 GHz (50 ohms)
200 kHz to 18 GHz (50 ohms)
10 MHz to 18 GHz (50 ohms)
10 MHz to 18 GHz (50 ohms)
1nW to 10 mW
1nW to 10 mW
1nW to 10 mW
1nW to 10 mW
10 nW to 100 mW
10 nW to 100 mW
1jaW to 10 mW
IOjuW to 100 mW
b. Wide Power Range. Depending on the selected sen-
sor, the instrument will measure r.f. power from 1nWup to
100 mW. Temporary overloads up to 300 mW with Series
42104 sensors, and up to 2Wwith Series 4210-5 sensors,
will do no permanent harm to the instrument or the sensor.
When measuring pulsed signals, the power indications are
accurate up to 20 microwatts peak power (up to 200 mi-
crowatts with Series 4210-5 sensors). External attenuators
may be used to extend the measurement range of the
instrument.
c. Low Noise. The instrument has been designed and
constructed to minimize noise from all sources. The sensor
cable is of aspecial low-noise design; vigorous flexing
causes only momentary minor excursions of the display on
the most sensitive range of the instrument. The sensors are
insensitive to shock and vibration; even sharp tapping on
the sensor barrel causes no visible excursions on any range.
Internal signal amplification occurs at approximately 94
Hz, thereby reducing susceptibility to 50- or 60-Hzfields. A
low-noise solid-state chopper is used.
1-7.Diode sensors are r.m.s. -responding for low-power
levels (below 20 microwatts for Series 42104 sensors and
200 microwatts for Series 4210-5 sensors). At these low-
power levels, the instrument measures and displays true
d. LED Display. Measured power levels are displayed
by a4-digit, LED-type readout with decimal points and
minus sign. Annunciators associated with the LED display
indicate the units of measurement. The result is aclear,
1-1

Section I
Introduction
unambiguous readout that minimizes the possibility of
misinterpretation.
e. Analog Indications. Afront-panel analog meter pro-
vides relative power indications for peaking or nulling
applications. The display is proportional to power on each
range (PWR mode) or to dB over the entire range (dB
mode).
f. Pushbutton Measurement-Mode Selection. Achoice
of measurement modes is available to the operator. Indica-
tions in terms of power or of dBm can be selected by
pressing the appropriate front-panel key switch. AdB ref-
erence level equal to the last displayed dBm value can be
entered through the keyboard REF switch, and adisplay
mode can be selected to indicate power levels in dBr relative
to that dB reference level.
g. Automatic Ranging. Autoranging under control of
the microprocessor eliminates the need for manual ranging.
Applications of power levels that exceed the maximum
capability of the instrument result in an error indication on
the LED display.
h. Automatic Zeroing. An automatic zeroing circuit
eliminates the need for tedious, often inaccurate, manual
zeroing. With zero input to the sensor, pressing afront-
panel ZERO key switch directs the microprocessor to
compute and store zero corrections for each range, and the
instrument is thereafter corrected on each range in accor-
dance with the stored data. This method is considerably
simpler, faster, and more accurate than manual zeroing.
i. Sensor Compensation. Calibration factors in dB are
selected by afront-panel rotary control calibrated in 0. 1dB
stepsfrom 1.10 to -1 .10 dB. The sensoritself is marked with
the appropriate calibration factors as afunction of
frequency.
j. Solid-state Chopper. Signal amplification in the in-
strument occurs at approximately 94 Hz. Input signals
from the sensor are converted into a94-Hz signal by a
solid-state, low-level input modulator (chopper), which rep-
resents adistinct improvement over electromechanical
choppers. Extended service life is assured through the elim-
ination of contact wear, contamination, and other prob-
lems associated with electromechanical choppers.
k. Signature-Analysis Maintenance. Connection facili-
ties to permit signature-analysis maintenance are incorpo-
rated. Digital circuit troubles can be localized rapidly and
accurately using the signature-analysis maintenance tech-
nique, thereby reducing instrument down-time. An adapter
(P/N 950028) is available from Boonton Electronics Cor-
poration for signature-analysis maintenance.
1-9. ACCESSORIES.
1-10. The basic instrument is supplied complete with
power cord, sensor cable and sensor. It is designed to
operate with any Boonton Electronics Corporation Series
4210 sensor, the characteristics of which are listed in Table
1-1. The calibration data for the particular sensor ordered
are written into microprocessor memory before shipment
of the instrument.
1-11. Inquiries regarding special applications of the in-
strument to specific customer requirements are invited.
Direct such inquiries to the Applications Engineering De-
partment of Boonton Electronics Corporation.
1-12. SPECIFICATIONS.
1-13. Pertinent performance specifications for the instru-
ment are listed in Table 1-1.
1-14. OUTLINE DIMENSIONS.
1-15. Outline dimensions of the instrument are shown in
Figure 1-4.
TABLE 1-1. PERFORMANCE SPECIFICATIONS
Parameter Specifications
FREQUENCY RANGE: 200 kHz to 18 GHz (depending on power sensor used)
MODES:
Power Display in nW, juW, or mW
dBm Display in dB relative to 1mW
dBr Display in dB relative to the previous dBm display
POWER RANGE:
With all 4210-4 series sensors 70 dB dynamic range with 7full-scale ranges of-50,-40,-30,-20,-10, 0
and +10 dBm (10 nW to 10 mW f.s.)
With all 4210-5 series sensors 70 dB dynamic range with 7full-scale ranges of- 40, -30, -20,- 10, 0, +10
and +20 dBm (100 nW to 100 mW f.s.)
1-2

Section I
Introduction
TABLE 1-1. PERFORMANCE SPECIFICATIONS (cont.)
Parameter Specifications
With 4210-7E sensor
With 4210-8E sensor
Ranging
40 dB dynamic range with 4full-scale ranges of- 20,- 10, 0, and +10 dBm
(10/xWto lOmWf.s.)
40 dB dynamic range with 4full-scale ranges of -10, 0, +10, and
+20 dBm (100 to 100 mW f.s.)
Automatic
INSTRUMENTATION ACCURACY: (Uncertainties include instrumentation, non-linearity, range zero correc-
tions, and noise).
Zero
Zero drift
Temperature effect
GENERAL:
Cal. Factor
Waveform Response
Modes Ranges
All But Lowest
(All Sensors)
Lowest
(4210-4 &-5 Sensors)
Lowest
(4210-7E Sensor)
PWR
MODE ±1.5% rdg. ±0.1% f.s ±2% rdg. ±1.5% f.s. ±1% rdg. +3% f.s.
dB
Modes +007 HR ±dBf.s. -dBrdg ±0 15dR± dBf.,-dBrd ,±n.l dR± dBf.s. -dBrde.
250 15 10
Automatic, operated by front-panel key switch
With all 4210-4 series sensors: 1riW/h, max., on 10 nW range
With all 4210-5 series sensors: 10 nW/h, max., on 100 nW range
With 4210-7E sensor: 1/xW/h, max., on 10 (JW range
With 4210-8E sensor: 1/xW/h, max., on 100 jliW range
Range Instrument
21° Cto 25° C0dB
18° Cto 30° C0dB
10° Cto 40° C±0.2 dB
Sensor
0dB
±0.1 dB
±0.2 dB
Range 1.10 dB to -1.10 dB, entered via calibrated front-panel control
With all 4210^1 series sensors: True average power to 20 /xW; above
20 /uW, average power of sine wave
With all 4210-5 series sensors: True average power to 200 /xW; above
200/xW, average power of sine wave
Measurement Speed
With 4210-7E/8E sensor: True average power
With 4210^4 and -5 sensors: Typically 1.0s to 2.5s. Worst case below
-40dBm, 8s for increasing and 27s for decreasing levels
Display
With 4210-7E and 4210-8E sensors: Typically 2s to 5s for increasing
levels and 2s to 23s for decreasing levels
4-digit LED. 3-1 /2digit display of power, 4-digit display of dB with 0.01
dB resolution
Annunciators
Error Indication
Power Consumption
Weight
Size
Auxiliary analog display, uncalibrated, proportional to power (PWR
mode) or dB (dB mode)
LED display of nW, /xW, mW, dBm and dBr
Display shows overrange condition
100, 120, 220, 240 V, 50 -400 Hz, 18 VA
2.27 kg (5 lbs.), approx.
114 mm high x216 wide x257 deep (4.5 in. x8.5 x10.1)
1-3

Section I
Introduction
TABLE 1-2. SENSOR CHARACTERISTICS
S«fiaor
Typo Full-wave dfode Thermocouple
type
Model 4210-4A 4210-4B 4210-4C 4210-4E 4210-5B 4210-5E 4210-7E 4210-8E
Input son so n75 £1 50fi so n5012 so n
Frequency
Range 200kHz-7GHz 200kHz-12.4 GHz 200k Hz-1 GHz 200kHz-18GHz 200kHz-12.4GHz 200kHz-18GHz 10MHz-18GHz
Power Range 1nW to 10 mW 10 nW to 100 mW 1/jW to 10 mW 10 pW to 10 mW
Sun of
Calibration
Factor
Uncertainty
1%, 0.2-300 MHz
1,3%,300MHz-2GHz
3.0%,
2G Hz-4 GHz
3.5%,
4GHz-7GHz
1%, 0.2-300MHZ
1.3%, 300MHz-2GHz
3.0%, 2G Hz-4 GHz
3.5%, 4GHz-8GHz
4.0%, dGHz-IOGHz
4.5%, 10GHz-12GHz
6.0%, 12GHz-18GHz
Add 0.05 dB/mW above 4GHz
1%, 0.2-300 MHz
1.3%, 300MHx-2GHx
3.0%, 2GHz-4GHz
3.5%, 4GHz-8 GHz
4.0%, 8GHz-l0GHz
4.5%, 10GHz-12GHz
6.0%, 12GHz-18GHz
Add 0.005 dB/mW above 4GHz
1%, 10-300MHz
1.3“/*, 300MHz-2GHz
3.0%, 2GHz-4GHz
3.5%, 4GHz-8GHz
4.0%, 8GHz- 10 GHz
4.5%, 10GHz-12GHz
6,0%, 12GHz-18GHz
Max. SWR 1.12,
200kHz-2GHz
1.2,
2GHz-4GHz
1.4,
4GHz-7GHz
1.12,
200kHz-2GHz
1.2,
2G Hz-4 GHz
1.4,
4GHz-1 1GHz
1.6,
11 GHz-12.4 GHz
1.18,
20 0k Hz-1 GHz 1.3,
200kHz-4GHz
1.5,
4GHz-10GHz
1.7,
10GHz-18GHz
1.07,
200kHz-1 GHz
1.10,
1GHz-2GHz
1.12,
2GHz-4GHz
1.18,
4GHz-12.4GHz
1.07,
200kHz-1GHz
1.10,
1GHz-2GHz
1.12,
2G Hz-1 GHz
1.18,
4GHZ-12.4GHZ
1.28,
12.4GHz-18GHz
1.5,
10 MHz-15MHz
1.35,
15MHz-10GHz
1.6,
10GHz-18GHz
|Max Average Power 10 mW {+10 dBm) 100 mW (+20 dBm) 10 mW (+10 dBm) 100 mW (+20 dBm} |
Overload Bating 300 mW (+25 dBm) 2W (+33 dBm) 30 mW (+14 dBm)’ 200 mW (+23 dBm) |
RF Connector Precision Type Nmale
Calibration
Factor Individually calibrated at up to 9frequencies, depending on sensor.
1-4

Section I
Introduction
MAXIMUM RESPONSE TIME IN SECONDS WITH 4210-4/5 SENSORS
LI
(dBm)
L2 (dBm)
+10 0-10 -20 -30 -40 -50 -60
+io-
0
-10
-20
-30
-40
-50
-60
1.5
1.5
2.5 2.5 1.75
2.5 2.5 2.5
2.5 2.5 2.5 2.5 2.5
INCREASING LEVEL
LI TO L2
NOTE
For Series 5sensors increase levels by 10 dB.
MAXIMUM RESPONSE TIME IN SECONDS WITH 4210-4/5 SENSORS
LI
(dBm)
L2 (dBm)
+10 0-10 -20 -30 -40 -50 -60
+10-
0-
-10-
-20-
-30-
-40-
-50-
-60-
1.5
1.5
1.75
1.5 1.75
1.25
27
18
15
10
10
11
DECREASING LEVEL
LI to L2
NOTE
For Series 5sensors increase levels by 10 dB.
Figure 1-2 Response-Time Chart for Series 42 10A/ 5Sensors
1-5

Section I
Introduction
MAXIMUM RESPONSE TIME IN SECONDS WITH 42I0-7E/8E SENSORS
LI dBm
L2dBm
INCREASING LEVEL
LI to L2
NOTE
For Series 8E sensors increase levels by 10 dB.
MAXIMUM RESPONSE TIME IN SECONDS WITH 4210-7E/8E SENSORS
L2 dBm
Figure 1-3 Response-Time Chart for Instrument and 4210-7E/8E Sensor
1-6

Figure 1-4 Outline Dimensions
1-7


Section II
Operation
SECTION II
OPERATION
2-1. GENERAL.
2-2. This section provides instructions for installation and
operation of the instrument. Although the design of the
instrument emphasizes ease of operation, it is recom-
mended that the operator familiarize himself thoroughly
with the material in this section before attempting to oper-
ate the instrument; otherwise, the full capabilities of the
instrument may not be realized in use.
2-3. INSTALLATION.
2-4. Unpacking. The instrument is shipped complete with
sensor, and is ready for use upon receipt. Packaging details
are shown in Figure 2-1. Unpack the instrument carefully,
and inspect it for any signs of shipping damage. Should any
damage be noted, notify the carrier and the factory
immediately. NOTE
Save the packing material and container for
possible use in reshipment of the instrument.
2-5. Mounting. For bench use, choose aclean, sturdy,
uncluttered surface. See Figure 1-4 for space requirements.
2-6. Power Requirements. The instrument has atapped
power transformer which permits operation from 100, 120,
220, or 240 volt ±10%, 50 to 400 Hz, single-phase a.c.
power sources. Power consumption is approximately 18
volt-amperes at 60 Hz.

Section II
Operation
2-7. Cable Connections. Aline cord and sensor cable are
supplied with the instrument. Any other cables required
must be supplied by the user. Cable connections that may
be required are:
a. Sensors. The sensor cable supplied with the basic
instrument connects directly to the front-panel SENSOR
connector, and the sensor that is to be used for power
measurements connects directly to the other end of the
sensor cable. Although the sensors are insulated against
extreme temperature variations, it is advisable to locate the
sensor away from heat sources when using the most-
sensitive ranges of the instrument. If the instrument is to be
used to measure the output of equipment that generates
heat significantly above the ambient temperature, ashort
length of coaxial cable or solid line having the same charac-
teristic impedance as the sensor may be used between the
sensor and the equipment undergoing test to allow heat to
dissipate before reaching the sensor. If such acable is used
,
the length must be kept as short as possible for operation at
the high end of the frequency range; cable losses and an
increase in s.w.r. will tend to degrade measurement
accuracy.
2-8. OPERATING CONTROLS, INDICATORS,
AND CONNECTORS.
2-9. Controls, indicators, and connectors used during op-
eration of the instrument are shown in Figures 2-2 and 2-3.
Table 2-1 lists their functions.
2-10. SENSOR CALIBRATION DATA.
2-11. Low-frequency calibration corrections for sensors
ordered with the instrument are written into microproces-
sor memoryat thefactory before shipmentof the instrument
and sensor. High-frequency calibration data appear on the
chart on the sensor barrel and the proper dB correction is
entered using the CAL FACTOR dB control. For the
procedure for determining the calibration factor, refer to
paragraph 4-21. The field replacement of any sensor with
TABLE 2-1. OPERATING CONTROLS, INDICATORS, AND CONNECTORS
Control, Indicator,
or Connector
Figure and
Index No. Function
METER 2-2, 1Provides relative indication of power or dB for peaking and
nulling operations.
LED display 2-2,2 Four-digit LED display with minus sign and decimal
points; provides numerical indication of measured power,
dBm, or dBr.
mW, /AV, and nW
annunciators
2-2, 3Indicate units of power when instrument is operating in
power mode.
dBm and dBr annunciators 2-2,4 Indicate mode of dB operation.
CAL FACTOR control 2-2, 5Provides means of entering calibration factors in dB.
LINE switch 2-2,6 Provides means for switching a.c. line power on and off.
REF key 2-2, 7Provides means for storing adisplayed dBm reading as the
reference for future dBr measurements.
dBr key 2-2,8 Provides means for displaying dB measurements offset by
the selected reference (see 2-2, 7).
PWR/dBm keys 2-2,9 Provide means for selecting power or dBm mode of display.
ZERO key 2-2, 10 Provides means for generating and storing zero corrections
for all ranges with zero input to sensor.
SENSOR connection 2-2, 1
1
Provides means for connecting sensor.
Power connection 2-3, 1Provides connection for a.c. power cord.
FI fuse 2-3,2 Accepts 0.3 A(100/120 Va.c.) or 0.2 A
(220/240 Va.c.) fuses.
A.C. power switch 2-3, 3Provides means for selecting a.c. power of 100, 120, 220, or
240 V.
Fuse chart 2-3,4 Describes required fuse value for various a.c. line voltages.
2-2

Section II
Operation

Section II
Operation
another of the same type requires only asimple recalibra-
tionprocedure (see Section IV). If asensor is replaced with
one of adifferent type, areplacement PROM is also re-
quired to reconfigure the 4210 to the new sensor.
a. General. Power sensors used with the Model 4210
can be thought of as four-part items: the power sensor
itself, an EPROM, and two resistors. If you change the type
of sensor from that with which the 4210 was originally
supplied, it may be necessary to change the EPROM and
the resistors as well. The following table gives the part
number for ordering anew sensor; it is in fact the part
number for akit that includes the sensor, an EPROM and
two resistors.
In some cases you may receive an EPROM with the same
part number as that of the EPROM already installed in the
instrument. However, since the new one may be an updated
version, it is preferable to install the new EPROM. Note
that even if neither the EPROM nor the resistors need be
changed, it will always be necessary to recalibrate the 4210
when changing sensors.
Model 4210 Power-Sensor Configuration
Part No. Sensor
Type EPROM Resistors
95 101801A 42 10-4A53427600A 341325000
95 101901A 4210-4B 53427600A 341325000
95102001A 4210-4C 53427600A 341325000
95 102101A 4210-4E 53427600A 341325000
95 102201A 4210-5B 53428300A 341325000
95 102301A 4210-5E 53428300A 341325000
95102401
A
4210-7E* 53429200A **
95102501A 4210-8E* 53430700A **
534388000 **
534389000 **
*Add two (2) (343729000) 20M 5%1/4 Wresistors to
the Chopper Board.
** Aselected resistor value between 4.32K to 8.25K must
be used.
b. Installation.
(1) Remove line power from the 4210.
(2) Remove the instrument’s top cover.
(3) Replace U29 (EPROM) in the instrument with
the EPROM supplied in the kit. Note that if you are
replacing asensor with one of the same type, you do
not have to replace U29 but, as noted earlier, it may
be desirable to do so.
(4) Use the Overlay drawing on page 6-7 to help
locate resistors R21 and R23. (They are at the very
bottom of the drawing, just to the right of center.)
Replace these resistors with the ones that are supplied
in the kit: 1.8 k-ohm for diode-type sensors; and 7.5
k-ohm for thermal sensors. Note that if you are
replacing asensor with one of the same type, there is
no need to change R21 and R23.
(5)
If parts have been replaced or if you are changing
sensors (even though the sensors are the same type),
the Model 4210 must be recalibrated. Refer to page
4-2,4-14.
2-12. POWER APPLICATION.
2-13. The basic instrument is designed for operation from
a.c. line voltages of 100, 120, 220, or 240, 50 to 400 Hz,
single phase. To apply a.c. power, proceed as follows:
a. Determine the line voltage at the a.c. power output
receptacle.
b. Position the two voltage-selector slide switches on the
rear panel to agree with the a.c. line voltage.
c. Check the rating of the fuse in the rear-panel fuse-
holder. For 100- or 120-volt operation, the fuse should be a
0.3-ampere, MDL Slo-Blo type; for 220- or 240-volt opera-
tion, it should be a0.2-ampere, MDL Slo-Blo type. If the
rating of the fuse is incorrect, install afuse of the required
rating in the fuseholder.
WARNING |
The instrument is designed to operate from a
3-terminal (one ground) a.c. power receptacle.
If only a2-terminal a.c. power receptacle is
available, use a3-prong-to-2 prong adapter.
Connect the ground wire of the adapter to the
power receptacle ground, to eliminate apoten-
tial shock hazard to the operator.
d. Connect the power cord between the a.c. power con-
nector on the rear panel of the instrument and the a.c.
power receptacle (with adapter, if necessary).
2-14. PRELIMINARY CHECK OF
INSTRUMENT.
NOTE
The following checkout procedure is intended
merely to demonstrate that the major circuits of
the instrument are operating, before the in-
strument is placed in service. For adetailed
check of the instrument against performance
specifications, refer to paragraph 2-28.
2-4

Section II
Operation
2-15. To perform apreliminary operational checkout,
proceed as follows:
a. Set the LINE switch to the ON position. The LED
annunciator directly above the switch should light.
b. Immediately at power-on all the LED display digits,
the minus sign, and all annunciators should light for ap-
proximately 1second, blank for 0.5 second, and then
commence normal indications. Their failure to exhibit this
sequence is an indication of instrument malfunction.
c.Connect the correct power sensor to the front-panel
SENSOR connector.
d. With no signal connected to the sensor, press the
PWR key and then press the ZERO key. A“good zero” is
indicated by equal positive and negative excursions of the
display, and by the minus sign flashing on and off. If
necessary, press the ZERO key asecond time to obtain a
good zero.
NOTE
Always have the instrument in the power dis-
play mode before executing azero. This assures
that the quality of the zero correction can be
monitored by observing the fluctuations of the
display around zero. If the instrument is in the
dBm mode, the error signal LO appears on the
display for signals that are less than -70 dBm,
and the quality of the zero therefore cannot be
observed.
e. Connect any suitable signal source of frequency
greater than 200 kHz to the sensor input and verify aproper
display of power.
f. Press the dBm key and verify an equivalent dBm
display.
g. Press the REF key to enter the dBm level displayed in
(f) above,as the reference for all subsequent dBr displays,
h. Press the dBr key and verify that the dB display has
been offset by the reference established in (g), above.
i. Press the dBm key, check the displayed reading, and
then rotate the CAL FACTOR control by agiven amount.
Verify that the dBm display changes by that amount.
j. Reset the CAL FACTOR control to 0.
k. This concludes the preliminary operational checkout.
To check the instrument for minimum performance stand-
ards, refer to paragraph 2-28.
2-16. OPERATING PROCEDURES.
2-17. Programming Measurement Parameters.
a. General. Measurement parameters are entered into
the microprocessor through the front-panel controls.
When the instrument is turned on, the PWR key is auto-
matically activated and no dBm offset is stored for dBr
measurements.
b. Mode Selection. Two mode keys select either power
units or dBm. When the PWR key is pressed, measured
power levels are displayed in mW, juW, or nW; the annuncia-
tors associated with the LED display indicate the appro-
priate unit.When the dBm key is pressed, measurement
values are displayed in terms of dBm (0 dBm is equivalent
to 1mW across 50 ohms). An annunciator associated with
the LED display indicates when the dBm mode is selected.
c. Two mode keys select adB display offset by arefer-
ence value. Any displayed dBm reading may be stored as
the reference by pressing the REF key. When the dBr key is
then pressed, all future dB readings will be offset by that
reference. As an example, if the instrument is displaying a
reading of- 10.00 dBm, pressing the REF key will store this
value. When the d Br key is pressed, assuming no change in
the input power level to the sensor, the display will indicate
0.00 dBr [- 10.00 dBm -(- 10.00 dBm)].
NOTE
Since the difference of two dB values is the
same as the ratio of the two equivalent power
values, offset measurements provide ratio ca-
pabilities. Additionally, an offset dB display is
aconvenient means for normalizing future
readings to the reference value.
d. Range Selection. Range selection is entirely auto-
matic and always results in the best possible display resolu-
tion.
e. CAL FACTOR Selection. The sensors used with the
instrument are frequency-sensitive; that is, with aconstant
input power level applied, their output signal level does not
remain constant as the measurement frequency is changed
.
Each sensor is marked with its required corrections as a
function of frequency. The front-panel CAL FACTOR
rotary control provides the means for entering these correc-
tions into the microprocessor. As an example, if asensor
has aCAL FACTOR of-0.35 dB at aparticular frequency,
setting the CAL FACTOR control to -0.35 dB will correct
the display value for that frequency
2-18 .Zeroing the Instrument. For greatest accuracy, espe-
cially on the most-sensitive ranges, the instrument must be
1-5

Section II
Operation
zeroed. To eliminate tedious and less-accurate manual
zeroing, the instrument incorporates an automatic zeroing
capability. When automatic zeroing is initiated, the mi-
croprocessor reads and averages the offset and stores the
zero correction required on the most sensitive range, as well
as scaled corrections required for the other ranges. The
instrument then applies the proper zero correction for the
range in use for all subsequent measurements. During in-
strument warmup, or when used in an environment with
varying ambient temperatures, the instrument should be
zeroed frequently if measurements are being made on the
lowest ranges. To zero the instrument, proceed as follows:
{CAUTION :
Never press the ZERO key with asignal applied
to the sensor; to do so will result in large,
erroneous zero corrections and grossly inaccu-
rate measurements.
a. Remove all input power to the sensor.
NOTE
If the instrument is subjected to strong r.f.
fields, shield the sensor in accordance with the
instructions in paragraph 2-27.
b. If the instrument is in the power mode, press the
ZERO key. If the instrument is in the dBm or dBr mode,
first press the PWR key, then press the ZERO key. A“good
zero” is indicated by equal positive and negative excursions
of the display and by the minus sign flashing on and off. If
necessary, press the ZERO key asecond time to obtain a
good zero.
2-19. Making Absolute Power Measurements. Once the
instrument is zeroed, it is ready for power-level measure-
ments. Merely connect the sensor to the source whose
power level is to be measured and press the PWR key, for
display in power units, or press the dBm key for display in
dBm units.
2-20. Making Relative or Offset Power Measurements. If
the instrument is in the dBm mode of operation, any dis-
played dBm value may be used as a reference for subse-
quent relative power measurements, as follows:
a. Press the REFkey. This stores the current dBm value
as areference.
b. Press the dBr key. The dBr annunciator will light,
indicating that the instrument is displaying dB values rela-
tive to the stored reference. The stored reference remains
unchanged for all subsequent measurements until anew
reference is entered or the instrument is turned off.
2-21. MAKING MEASUREMENTS.
2-22. Low-Level Measurements. The instrument will pro-
vide reliable, reproducible measurements of c.w., a.m., and
f.m. power levels as low as 1nW (-60 dBm). It can also be
used for pulse measurements but with slightly decreased
accuracy (±1 dB). Peak power levels for pulse measure-
ments should not exceed 200 fJSM (20 fJW for Series 4210-4
sensors); above this level the sensor enters the region where
it operates out of the square-law region, and accuracy at
such signal levels is correct for c.w. and f.m. only.
2-23. High-Level Measurements. Zeroing of the instru-
ment is not critical when making high-level measurements
(10 fx Wto 100 mW). C.W. and f.m. power measurements
can be obtained within the specified accuracy up to 100
mW; accuracy cannot be guaranteed for pulse power mea-
surements with instantaneous peaks exceeding 350 juW (35
iuW for Series 4210-4 sensors).
2-24. High-Frequency Measurements. At frequencies
above 1GHz, the appropriate sensor-calibration factor
must be entered by the CAL FACTOR control if the
specified accuracy of the instrument is to be realized. (Refer
to paragraph 2-17e.)
NOTE
Model 4210-4A, 4210-4B, 4210-4E, 4210-5B,
4210-5 Eand 42 10-7E sensors are calibrated for
use with a50-ohm source; model 4210-4C sen-
sors are calibrated for use with a75-ohm
source. Impedance mismatch results in in-
creased s.w.r., which affects measurement ac-
curacy. (Refer to paragraph 4-30 and Figure
4-7.) This effect can be reduced by inserting a
low-s.w.r. attenuator (s.w.r. less than 1.10) ora
low-loss tuner between the source and the
sensor.
2-25. Temperature Effects. Specified instrument accura-
cies apply over an ambient temperature range of 21° Cto
25° C. Operation outside this temperature range causes
some additional error. Figure 2-4 shows typical tempera-
ture characteristics of aSeries 4210 sensor, and Figure 2-5
shows typical temperature characteristics of the instrument
and sensor combined.
NOTE
For best zero stability of the instrument, allow
the instrument and sensor to reach astable
temperature.
2-26. S.W.R. Measurements. The high upper-fre-
quency limit and sensitivity of the instrument facilitates
s.w.r. measurements with aslotted line. S.W.R. measure-
2-6

Section II
Operation
ments require only comparative, rather than absolute,
measurement values; therefore, the instrument may be used
up to 20 GHz with amodel 4210-4E sensor. The front-panel
meter is especially useful for rapid determination of maxi-
mum and minimum power points. S.W.R. is determined by
measuring the dB difference between amaximum and a
minimum voltage point on aslotted line and converting this
difference to s.w.r. An adapter, usually available from the
slotted-line manufacturer, is required to couple the sensor
to the slotted line. To make slotted-line s.w.r. measure-
ments, proceed as follows:
a. Connect the sensor to the sliding carriage, using a
suitable adapter.
b. Ascertain that the signal source is turned off; then,
zero the instrument.
c. Turn on the signal source and slide the carriage along
the slotted line until apoint of maximum indication is
located. Adjust the source signal level and the probe setting
for the least coupling that yields a-41 dBm reading at the
maximum point. (The incident power should be at least
0dBm.)
d. Slide the carriage along the slotted line until amin-
imum indication is located. Read the level at this point.
Subtract the measured level at the minimum point from
that at the maximum point, ignoring signs. Convert the
resultant AdB into s.w.r., either through use of the s.w.r.
conversion chart (Figure 2-6) or by computation. S.W.R. is
the antilog, base 10, of AdB/ 20.
2-27. Shielding Recommendations. If the instrument is
subjected to strong r.f. fields, accurate zeroing may be
difficult unless the sensor is shielded during the zeroing
operation. The simplest method of shielding is to connect
the sensor to the device whose power level is to be mea-
sured, first making sure that the device is turned off; how-
ever, in some instances, the device may act as an antenna
and introduce additional noise voltage into the sensor. If
this happens, disconnect the sensor from the device, stand
the sensor, end down, on acopper plate, and hold it down
firmly so that the rim of the sensor connector makes good
contact with the copper plate at all points. Alternatively,
wrap apiece of thin copper foil around the body of the
connector body, and crimp the foil around the open end of
the connector, making certain that the center pin of the
connector is not shorted. If frequent zeroing in strong noise
fields is necessary, construct an adapter, using aType N
connector permanently fitted with acopper foil shield.
2-28. MINIMUM PERFORMANCE
STANDARDS.
2-29. Test Equipment Required. For minimum perfor-
mance testing of the instrument, aprecision adjustable
power source, such as the Boonton Model 25A Power
Meter Calibrator, is required.
NOTE
A1MHz power source, such as the Boonton
Model 25A, is recommended for testing the
instrument and its sensors, except when the
instrument is fitted with a4210-7E sensor. In
that case, an equivalent 50 MHz power source
is required.
2-30. Preliminary Setup.
a. Turn on the instrument and the adjustable power
source and allow awarmup period of at least one hour. The
ambient temperature should be 21° C(70° F) to 25° C
(77° F).
b. Set the adjustable power source to zero and connect
the sensor between the power source and the front-panel
SENSOR connector of the Model 4210, using the sensor
cable.
c. If the instrument is in its power mode, as indicated by
the nW, ynW, or mW annunciators, press the ZERO key of
the instrument. If the instrument is in either dBm or dBr
modes, as indicated by those annunciators, first press the
PWR key followed by the ZERO key. Agood zero is
indicated by equal excursions of the display in both the
positive and negative directions, with the minus sign flash-
ing on and off. Repeat the zeroing process, if necessary, to
obtain agood zero.
2-31. Ranging Test. To check the autoranging function of
the instrument, set the output level of the adjustable power
source to each of the values listed below. If the instrumentis
ranging properly, the indications will be approximately as
shown, with correct decimal point and annunciators.
Indications with Sensor
Power 4210-4 4210-5 4210-7E Annunci-
Source ators
10 nW 10.00 nW
100 nW 100.0 100.0 nW
1mW 1.000 1.000 fJLW
io mW 10.00 10.00 10.00
100 mW 100.0 100.0 100.0 mW
1mW 1.000 1.000 1.000 mW
10 mW 10.00 10.00 10.00 mW
100 mW 100.0 mW
2-32. dBm Mode. When the instrument is turned on it
always reverts to the power mode. To check the dBm mode
of the instrument, proceed as follows:
2-7

Section II
Operation

Section II
Operation
2-9
afy
Figure
2-6
dB-SWR
Conversion
Chart

Section II
Opeiation
a. Set the power source to 1mW.
b. Press the dBm key. The indication should be 00.00 dB
±0.07 dB (± 0.1 dB with 4210-7E sensor). The power
annunciators should be off and the dBm annunciator on.
2-33. Basic Instrument Accuracy Test. To check the basic
accuracy of the instrument, proceed as follows:
a. With zero input to the sensor (adjustable power
source turned off), zero the instrument by pressing the
PWR key, then pressing the ZERO key.
b. Press the dBm key.
c. Set the output level of the adjustable power source to
each of the following dBm levels, and check that the display
agrees with the output level of the power source within the
specified dB limits:
Power
Source
4210*4 4210-5 42I0-7E
+10x0-49
dBm -50 to -60
dBm +20 to -39
dBm -40 to -50
dBm -10 to -19
dBm -20 to -30
dBm
F.S.*- 0dBm ±0.07 dB ±0.15 dB ±0.07 dB ±0.15 dB ±0.07 dB ±0.10 dB
-1±0.07 ±0.21 ±0.07 ±0.21 ±0.07 ±0.20
-2±0.08 ±0.23 ±0.08 ±0.23 ±0.08 ±0.30
-3±0.08 ±0.33 ±0.08 ±0.33 ±0.08 ±0.40
-4±0.09 ±0.40 ±0.09 ±0.40 ±0.09 ±0.50
-5±0.09 ±0.46 ±0.09 ±0.46 ±o;o9 ±0.60
-6±0.09 ±0.52 ±0.09 ±0.52 ±0.09 ±0.70
-7±0.10 ±0.58 ±0.10 ±0.58 ±0.10 ±0.80
-8±0.10 ±0.65 ±0.10 ±0.65 ±0.10 ±0.90
-9±0.11 ±0.75 ±0.11 ±0.75 ±0.11 ±1.00
-10 -±0.77 -±0.77 -±1.10
*F.S. Inputs, 421(M: +10, 0,- 10,-20,-30,-40, and -50 dBm
4210-5: +20,+ 10, 0,- 10, -20, -30, and -40 dBm
4210-7E: +10, 0,-10, -20 dBm
2-34. dBr Mode. To check the dBr mode of the instrument,
proceed as follows:
a. Set the power source to 100 juW and the instrument to
the dBm mode. The indication should be- 10.00 dBm ±0.07
dB.
b. Press the REF key. This stores the dBm display of
-10.00 dBm as areference.
c. Press the dBr key. The display should now indicate
00.00 dBr [- 10.00 dBm -(- 10.00 dB)] and the dBr annun-
ciator should be on.
2-35. Analog Meter. To check the analog meter display of
the instrument, proceed as follows:
a. Set the power source to 10 mW and the instrument to
the power mode. The indication of the analog meter should
be approximately 85% of full scale.
b. Reduce the power source in steps of 1dB and note
that the analog meter display decreases.
c. Set the power source to 10 mW and then reduce in
steps of 10 dB. The analog meter should indicate approxi-
mately 85% of full scale in each case.
d. Set the power source to 10 mW (100 mW for the
4210-5 sensor) and press the dBm key of the instrument.
The analog meter display should indicate approximately
85% of full scale.
e. Decrease the power source in steps of 10 dB. The
analog meter display should decrease in approximately
equal steps, approaching zero with zero input.
2-36. Calibration-Factor Test. To check operation of the
calibration-factor function, proceed as follows:
a. Set the power source to 1.0 mW, the CAL FACTOR
control of the instrument to 0, and press the dBm key. The
indication should be 00.00 dBm.
b. Rotate the CAL FACTOR control to +1dBm. The
indication should be +1.00 dBm.
c. Rotate the CAL FACTOR control to -1dBm. The
indication should be -1.00 dBm.
2-10
Other Boonton Measuring Instrument manuals
Boonton
Boonton 1121A User manual

Boonton
Boonton 4541 User manual
Boonton
Boonton 9240 Series User manual

Boonton
Boonton PMX40 User manual

Boonton
Boonton 4500A Installation and operating instructions

Boonton
Boonton 92BD User manual
Boonton
Boonton 92A User manual
Boonton
Boonton 92E User manual

Boonton
Boonton 92EA User manual

Boonton
Boonton 8201A User manual
Popular Measuring Instrument manuals by other brands

Kilews
Kilews KTM-IWT50 operating manual
BRONKHORST
BRONKHORST EL-FLOW Select Series instruction manual

Galvanic Applied Sciences
Galvanic Applied Sciences 943-TGX-CE Operation manual

DriveTest
DriveTest BIA 600 manual
CoaguSense
CoaguSense Coag-Sense Prothrombin Time PT/INR Self-Test User's Manual
Edaphic
Edaphic AZ8215 Operation manual
