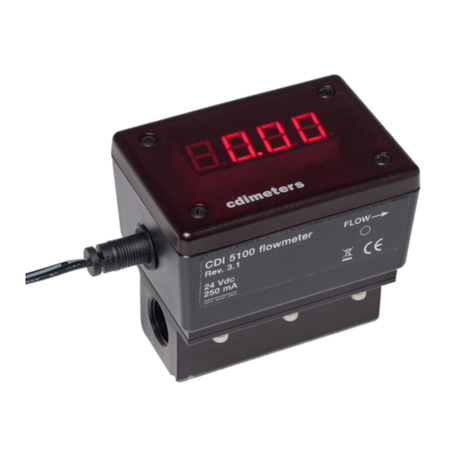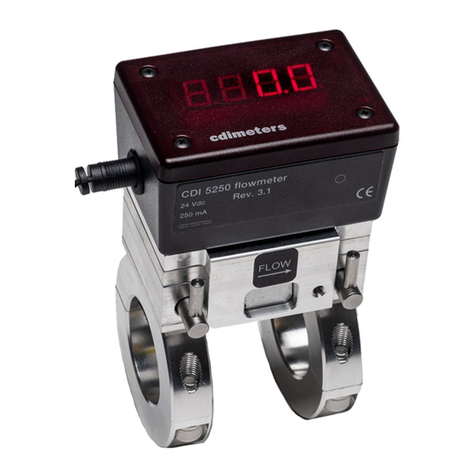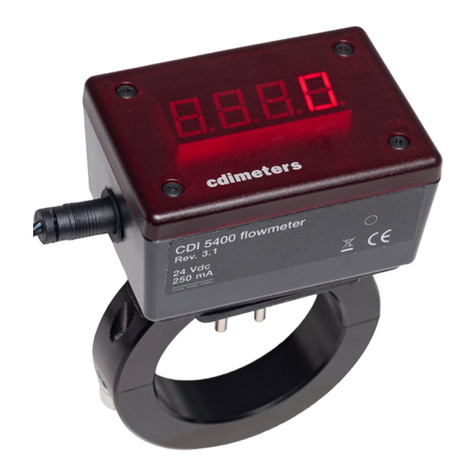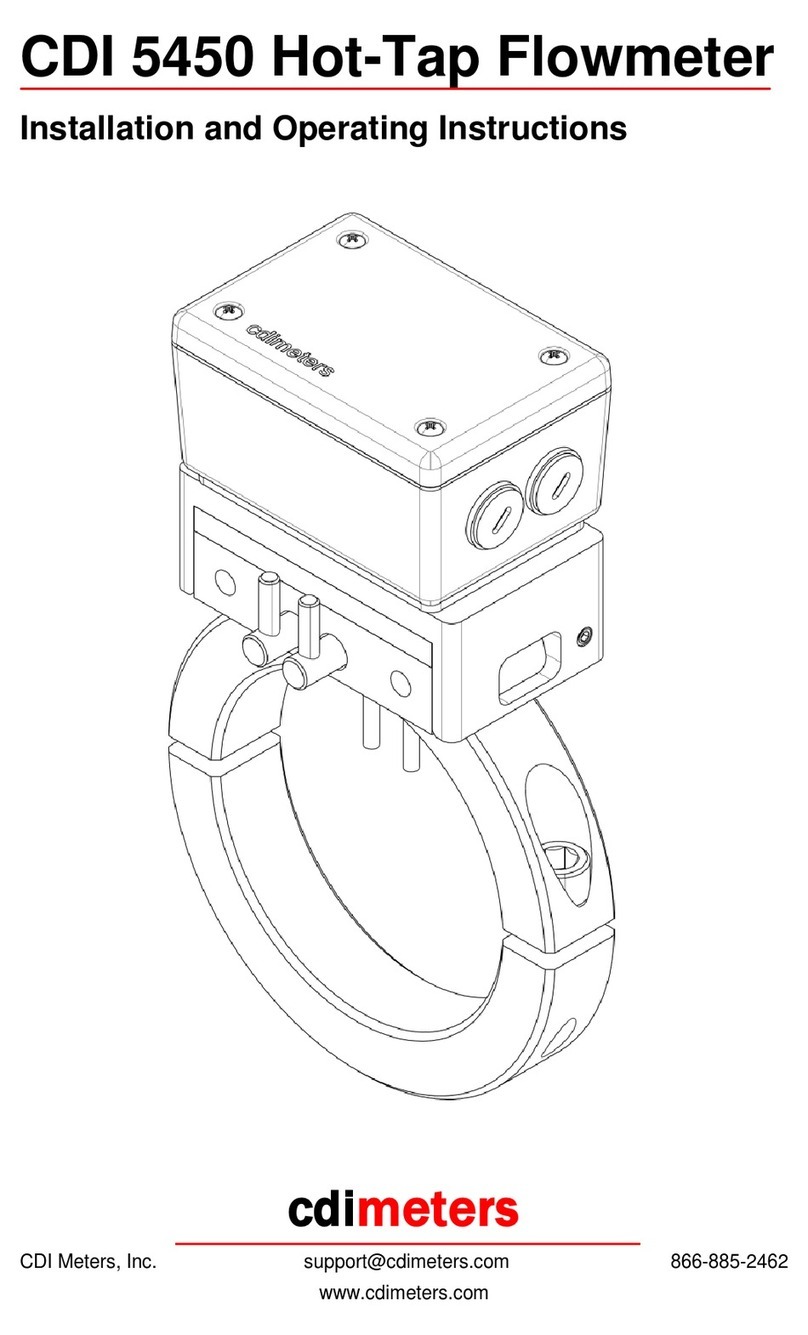
for them and then insert the probes into the holes in the pipe, with the flow arrow
pointing in the proper direction. Engage and tighten the band clamps.
Wiring the Meter
The meter requires 24 Volt dc power. Insert the power-supply cable through the
grommet at the bottom of the meter. Connect the positive lead to the dc+
terminal, the negative lead to the dc- terminal and the shield, if one is present, to
the gnd terminal. If you are using the wall-plug supply and adaptor cable
provided by CDI, the band-marked lead (not the printed lead) is positive.
Programming the Monitoring Functions
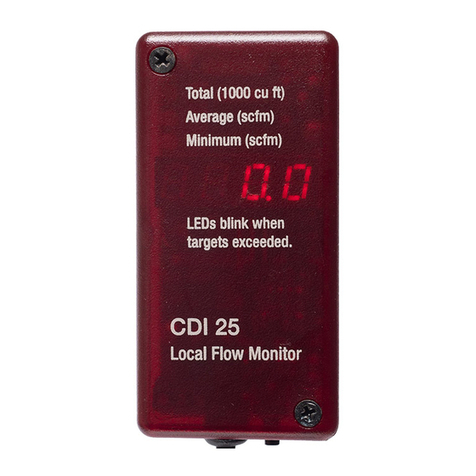
The meter has four display modes: rate, minimum, average and total. The display
is controlled by a button on the underside of the meter. Pressing the button
repeatedly will cycle the display through the four modes; LEDs above the digital
display indicate which mode is active.
Minimum and Average Modes
The minimum and average functions look back over periods of time specified by
the user. Each is based on 360 samples taken over the specified period of time.
Minima and averages are calculated and stored for groups of 36 samples, so the
displayed results are updated at an interval of one tenth of the period specified
by the user. Thus, if the average is computed over 0.1 hour (six minutes), the
flow will be sampled every second and the display will update every 36 seconds.
Please note that, since the minimum and average are based on data stored in
memory, they will not be meaningful until the specified period has elapsed.
Total Mode
Cumulative air usage is displayed in thousands of cubic feet, or thousands of
cubic meters. The total is not resettable.
Filter
A simple digital filter is provided for situations in which flow is continuously
varying and a steady, filtered display is useful. If the filter factor is programmed to
zero (see below) there is no filtering. If it is one, the current value is averaged in
equal parts with the previous filtered value. If it is two, one quarter of the present
value is added to three quarters of the previous filtered value, and so on, with
factors available up to six. Filtered values are used in calculating minima and
averages. Please note that the meter has limited sensitivity to very short pulses
of air flow, and filtering or averaging the output does not alter this.
©Copyright 2011 CDI Meters, Inc. 09.11
Alarms
If user-specified thresholds for minimum or average are exceeded, indicating
excessive air usage, the corresponding LEDs will blink. These blinks are short,
with the LED lit one eighth of the time. If the same LED is lit to indicate the
current display mode, it will blink off for one eighth of the time.
Programming
With the meter displaying rate, press and hold the button. The minimum LED will
light immediately; when the average LED lights, release the button. The display
will now show two letters on the left and two digits, with or without a decimal
point, on the right. The letters indicate which parameter is being programmed;
the digits indicate the current value of the parameter. To advance the parameter,
press and release the button; to advance the parameter rapidly, press and hold
the button. To advance to the next parameter, just wait. Time is displayed in
hours; tenths are displayed for all time and flow values below ten.
symbol meaning description range
LL Low Limit Threshold for minimum flow
alarm 0.1 cfm to
99 cfm
LP Low Period Period over which minimum
flow is calculated (hours) 0.1 hr to
24 hr
AL Average Limit Threshold for average flow
alarm 0.1 cfm to
99 cfm
AP Average
Period Period over which average
flow is calculated (hours) 0.1 hr to
24 hr
FF Filter Factor Degree of filtering 0 – no filtering
6 – maximum
filtering
dd default display 0 – rate
1 – minimum 2 – average
3 - total
