Delta OHM HD31 User manual

Operating manual
Multifunction Data Logger
HD31
www.deltaohm.com
English
Keep for future reference.
Companies / Brands of
GHM

HD31 - 2 - V1.6
TABLE OF CONTENTS
1INTRODUCTION.................................................................................................... 5
2DESCRIPTION....................................................................................................... 6
2.1DISPLAY DESCRIPTION .......................................................................................... 7
2.2KEY TO THE SYMBOLS IN THE STATUS BAR .................................................................... 8
2.3OVERVIEW OF THE FUNCTIONS IN THE COMMAND BAR ...................................................... 9
2.4HELP FUNCTION ............................................................................................... 11
3MEASUREMENT MODE ......................................................................................... 12
3.1SELECTING A MEASUREMENT LINE............................................................................ 13
3.2SELECTING THE MEASUREMENT UNIT ........................................................................ 13
3.3CHANGING THE QUANTITY VIEWED IN THE DISPLAY LINE.................................................. 14
3.4DERIVED QUANTITIES AND NUMBER OF MEASUREMENT LINES DISPLAYED.............................. 14
3.5DISPLAYING THE DIFFERENCE BETWEEN TWO HOMOGENEOUS QUANTITIES ............................. 17
3.6DISPLAYING THE RELATIVE MEASUREMENT (REL) ........................................................ 18
3.7HOLDING THE MEASUREMENT ON THE DISPLAY (HOLD).................................................. 18
3.8MEASUREMENT GRAPH ......................................................................................... 19
4THE PROBES ....................................................................................................... 22
4.1PRT TEMPERATURE PROBES .................................................................................. 22
4.1.1SETTING THE INSTRUMENT TO READ A PRT PROBE WITHOUT SICRAM MODULE .......... 24
4.2THERMOCOUPLE TEMPERATURE PROBES ..................................................................... 25
4.3RELATIVE HUMIDITY AND TEMPERATURE COMBINED PROBES ............................................. 26
4.3.1DISCOMFORT INDEX AND NET INDEX ........................................................... 26
4.4PRESSURE PROBES ............................................................................................. 28
4.4.1ZEROING DIFFERENTIAL PRESSURE PROBES..................................................... 28
4.4.2PEAK VALUE RESET ................................................................................. 29
4.5AIR SPEED PROBES............................................................................................. 30
4.5.1FLOW-RATE MEASUREMENT ....................................................................... 30
4.5.2NOTES ON FLOW MEASUREMENTS ................................................................ 30
4.5.3HOT-WIRE AIR SPEED PROBES AP471S... ..................................................... 31
4.5.4AIR SPEED VANE PROBES AP472S... ........................................................... 34
4.5.5AP473S... MODULES FOR PITOT TUBES ........................................................ 36
4.5.6ZEROING AIR SPEED PROBES ..................................................................... 38
4.6VP472 MODULE FOR THE CONNECTION OF PYRANOMETERS AND ALBEDOMETERS ..................... 40
4.7PHOTOMETRIC AND RADIOMETRIC PROBES WITH SICRAM MODULE .................................... 41
4.7.1INTEGRATION ....................................................................................... 42
4.8CO2PROBES .................................................................................................... 46
4.9VP473 AND IP472 MODULES FOR MEASURING DIRECT VOLTAGE AND CURRENT ...................... 47

HD31 - 3 - V1.6
5RECORD FUNCTION ............................................................................................ 48
5.1SELECTING A QUANTITY FOR THE RECORD FUNCTION ................................................... 48
5.2SAMPLE ACQUISITION .......................................................................................... 49
5.3DISPLAYING MINIMUM,AVERAGE AND MAXIMUM VALUES ................................................. 50
5.4RESETTING AND DISABLING THE RECORD FUNCTION .................................................... 50
5.5RECORD FUNCTION BEHAVIOR AT LOGGING STARTUP ................................................... 51
5.6RECORD FUNCTION AND RELATIVE MEASUREMENT ...................................................... 51
6SETTING DATE AND TIME ................................................................................... 52
7LOGGING ............................................................................................................ 53
7.1SETTING THE AUTOMATIC LOGGING INTERVAL OR THE MANUAL LOGGING............................... 53
7.2SELECTING THE MEASUREMENT LINES FOR LOGGING ...................................................... 54
7.3MANUALLY START/STOP AUTOMATIC LOGGING ............................................................. 55
7.4PROGRAMMING AUTOMATIC LOGGING START/STOP TIME.................................................. 55
7.5AUTO-OFF DURING AUTOMATIC LOGGING ................................................................... 57
7.6MANUAL LOGGING.............................................................................................. 58
7.7PDF REPORT ................................................................................................... 59
7.8DISPLAYING LOGGING SESSIONS IN THE SD MEMORY CARD ............................................. 61
7.9STORED DATA GRAPH .......................................................................................... 63
7.10DELETING LOGGING SESSIONS IN THE SD MEMORY CARD ................................................ 64
7.11DISPLAYING THE AMOUNT OF FREE MEMORY AVAILABLE IN THE SD MEMORY CARD.................... 65
7.12LOGGING AND RECORD AND INTEGRAL FUNCTIONS ................................................... 66
8PROTECTED MODE .............................................................................................. 67
8.1PASSWORD CHANGE FOR THE PROTECTED MODE ........................................................... 67
8.2ENABLING/DISABLING THE PROTECTED MODE .............................................................. 68
9MEASUREMENT SETTINGS .................................................................................. 70
9.1TYPE OF CALIBRATION TO BE USED FOR PROBES ........................................................... 70
9.2TEMPERATURE COMPENSATION ............................................................................... 72
9.3BAROMETRIC PRESSURE COMPENSATION .................................................................... 74
9.4SELECTING THE DUCT FOR FLOW RATE MEASUREMENTS ................................................... 76
9.5PITOT OR DARCY TUBE COEFFICIENT ........................................................................ 78
9.6AIR SPEED MEASUREMENT AVERAGE ......................................................................... 80
10PRINTING MEASUREMENTS ................................................................................ 82
10.1SETTING THE BAUD RATE OF THE INSTRUMENT ............................................................ 82
10.2SENDING MEASUREMENTS FOR PRINTING ................................................................... 83
10.3RECEIVING MEASUREMENTS INTO PC........................................................................ 83
11INFORMATION ON INSTRUMENT AND PROBES ................................................... 84
12USE OF THE BATTERY ......................................................................................... 85
12.1AUTOMATIC SWITCH-OFF FUNCTION ......................................................................... 85
12.2DISPLAY BRIGHTNESS ......................................................................................... 86

HD31 - 4 - V1.6
12.3PROLONGING BATTERY LIFE .................................................................................... 88
12.4REPLACING THE BATTERY....................................................................................... 88
12.5IMPORTANT WARNINGS ......................................................................................... 89
13CALIBRATION ..................................................................................................... 90
13.1CALIBRATION OF TEMPERATURE-ONLY PROBES WITH PRT SENSOR...................................... 90
13.1.1NEW TUNING OPTION FOR PRT SENSORS .................................................... 91
13.1.2PARAMETERS OPTION FOR PRT SENSORS.................................................... 92
13.2CALIBRATION OF THERMOCOUPLE TEMPERATURE PROBES.................................................. 93
13.3CALIBRATION OF COMBINED RELATIVE HUMIDITY AND TEMPERATURE PROBES ............................. 94
13.3.1CALIBRATION OF THE TEMPERATURE SENSOR OF RH/T COMBINED PROBES ................ 94
13.3.2CALIBRATION OF THE RELATIVE HUMIDITY SENSOR ............................................ 95
13.4CALIBRATION OF PP472 MODULE (BAROMETRIC PRESSURE) ............................................. 99
13.5CALIBRATING THE CO2PROBE .................................................................................100
13.5.1ZERO/FRESH AIR OPTION FOR CO2PROBES................................................100
13.5.2LINEAR GAINS OPTION FOR CO2PROBES ...................................................101
13.6CALIBRATION OF VP473 MODULES (VOLTAGE)AND IP472 (CURRENT).................................103
13.6.1DEFINITION OF LINEAR CORRESPONDENCE.....................................................104
13.6.2MEASUREMENT UNIT OF THE ASSOCIATED QUANTITY .........................................105
13.6.3DISPLAYING THE ASSOCIATED QUANTITY.......................................................106
14COMMUNICATING WITH A PC ........................................................................... 108
14.1STORED DATA TRANSFER TO PC.............................................................................110
14.2SERIAL COMMANDS ...........................................................................................111
15FIRMWARE UPDATE.......................................................................................... 116
16RESET OF THE INSTRUMENT ............................................................................. 117
17USAGE INSTRUCTIONS AND WARNINGS .......................................................... 118
18INSTRUMENT STORAGE .................................................................................... 119
19SAFETY INSTRUCTIONS.................................................................................... 119
20TECHNICAL FEATURES ...................................................................................... 120
20.1TECHNICAL FEATURES OF PROBES AND SICRAM MODULES IN LINE WITH THE INSTRUMENT........121
20.1.1TEMPERATURE WITH PLATINUM SENSORS (PRT)..............................................121
20.1.2TEMPERATURE WITH THERMOCOUPLE SENSORS................................................122
20.1.3RELATIVE HUMIDITY AND TEMPERATURE ........................................................126
20.1.4PRESSURE ..........................................................................................127
20.1.5AIR SPEED..........................................................................................129
20.1.6PHOTOMETRY AND RADIOMETRY .................................................................131
20.1.7CO2(CARBON DIOXIDE) .........................................................................138
21ORDER CODES .................................................................................................. 139
APPENDIX .............................................................................................................. 148

HD31 - 5 - V1.6
1INTRODUCTION
HD31 is a portable multifunction and data logger instrument. It has a large (43 x 58 mm) color
graphic LCD display.
It is equipped with 3 independent inputs. Each input can be connected to individual and com-
bined SICRAM probes (intelligent and interchangeable probes capable to store calibration data
into memory) for the measurement of several physical qualities:
•Temperature
•Relative humidity
•Barometric and differential pressure
•Air speed
•Illuminance (lux) and Irradiance
•Carbon dioxide (CO2)
•Direct voltage and current
The type of probes connected to the different inputs is automatically recognized by the instru-
ment. The probes are supplied factory- calibrated and are interchangeable.
By connecting a combined relative-humidity and temperature probe, the instrument calculates
the derived humidity quantities: dew-point temperature, wet-bulb temperature, absolute hu-
midity, mixing ratio, partial vapor pressure, saturated steam pressure, enthalpy. The DI (Dis-
comfort Index) and the NET (Net Effective Temperature) indexes are calculated as well.
The instrument’s inputs can also be connected to non SICRAM probes, by using the relevant
interface modules between instrument and probe.
The display can show up to 36 quantities, three of which can be displayed simultaneously in nu-
meric format. A real-time measured quantity graph is shown in the display.
The measuring unit can be selected according to the measured physical quantity.
Data logging function with data storage in CSV format directly into the SD-type Memory Card, for
a long logging time (for example, with a 4 GB SD-type card, the logging lasts several months
even when recording several quantities with the minimum logging interval of 1 second). User-
configurable storage interval. Manual or programmed logging start/stop. Logging date/time stor-
age of each sample (automatically creates measurement reports in PDF format in the memory
card). Manual RECORD function (acquires the current measurement by simply pressing a button)
or automatic RECORD function (acquires the current measurement once per second) for the cal-
culation of minimum, mean and maximum values of the measured quantities.
HOLD function (holds current measurements on the display), REL function (difference with re-
gard to a stored value) and DIFF function (difference between two homogeneous measure-
ments, e.g., between the measurements of two temperature probes).
Functions reserved through user password. USB port with mini-USB connector for PC connec-
tion, for configuration and download of the acquired data. DeltaLog9 application software
supplied with the instrument.
It is provided with MSD (Mass Storage Device) mode, in which the instrument is seen by the PC
as a SD card reader, thus allowing direct access to the memory card for displaying, copying or
deleting the logging files.
Serial output for the print of the displayed measurements on a RS232C input printer. The Baud
Rate can be set from 1200 to 115200.
Lithium ion rechargeable battery. Automatic switch-off (may be disabled) after user-configurable
downtime (2, 5, 10, 15, 20 or 30 minutes) for preserving the battery life. External power supply
through USB input (with mini-USB connector) by connecting a 5 Vdc power supply unit or a PC
USB port (500 mA at least). With an external power supply unit connected, the battery is re-
charged and the automatic switch-off is automatically disabled.

HD31 - 6 - V1.6
2DESCRIPTION
Fig. 2.1: instrument description
HD31 - 7 - V1.6
1. Input B, 8-pole DIN45326 connector.
2. Input A, 8-pole DIN45326 connector.
3. F2 function key: activates the central command in the command bar.
4. F1 function key: activates the left command in the command bar.
5. SELECT key: scrolls cyclically forward the main commands in the command bar.
6. Skey: in "Measure" mode, scrolls cyclically upwards the measurements on the display;
in the menu, it scrolls through the available options.
7. Tkey: in "Measure" mode, scrolls cyclically downwards the measurements on the dis-
play; in the menu, it scrolls through the available options.
8. SD card housing. To introduce the card, push it into the slot until it clicks into place,
which ensures the correct insertion. To remove the card, push it until you hear the re-
lease click.
CAUTION: to avoid data loss, do not remove the card if logging is active. Stop
logging before removing the card.
9. RS232C serial output with RJ12 (6P6C) connector for connecting the printer.
10. USB port with mini-USB for connecting a PC or external power supply device.
11. HOLD key: holds the measurement to the current value.
12. ON/OFF key: turns the instrument on/off.
13. ESC key: in "Measure" mode, scrolls cyclically backward the main commands in the
command bar; in the menu, it allows returning to the higher menu level; cancels the cur-
rent operation without modifying the instrument parameters.
14. F3 function key: activates the right command in the command bar.
15. Color graphic LCD display.
16. Input C, 8-pole DIN45326 connector.
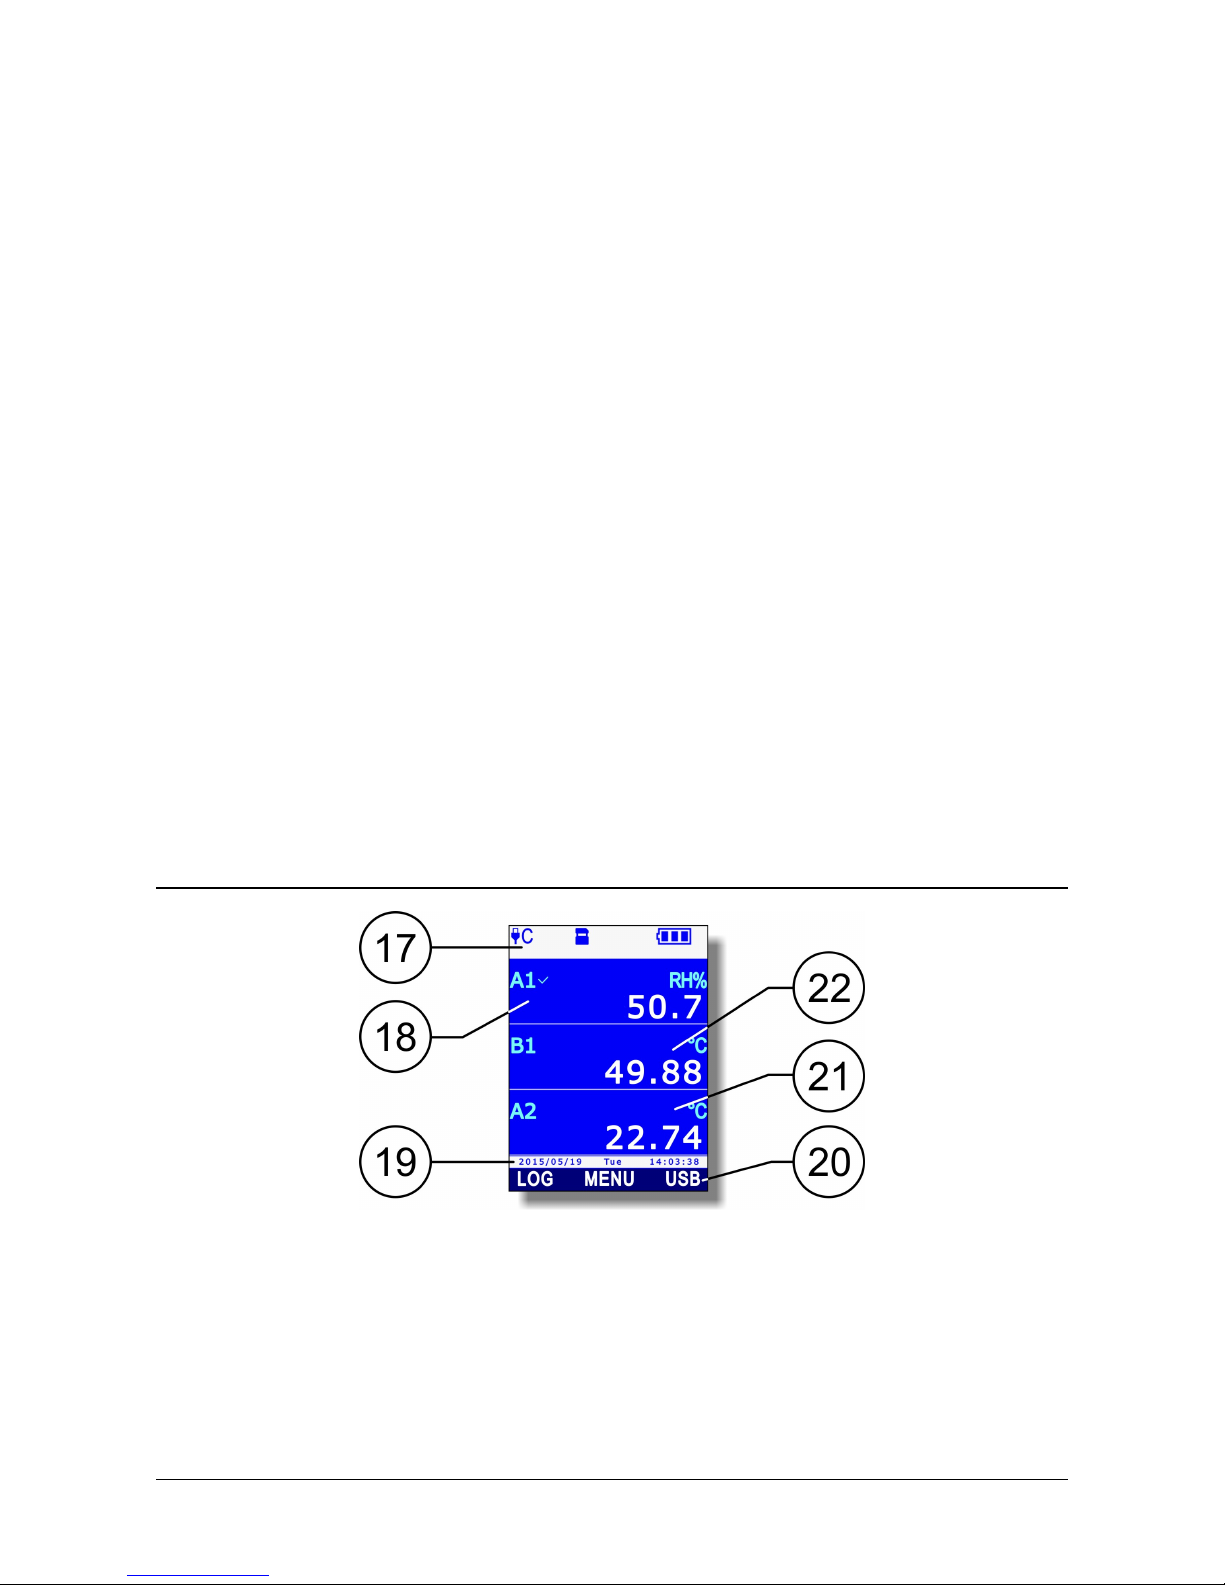
2.1 DISPLAY DESCRIPTION
Fig. 2.1.1:display description
17. Status bar: shows information about logging state, battery charge level, presence of SD
card, USB connection state, etc.
18. Display of the first measurement.
19. Date and time. During execution of the commands the line shows information messages.
20. Command bar (indications vary according to the function enabled).
21. Display of the third measurement.
22. Display of the second measurement.

HD31 - 8 - V1.6
2.2 KEY TO THE SYMBOLS IN THE STATUS BAR
Instrument connected to a USB port on your PC
Instrument connected to a USB port on your PC and communicating
Instrument connected to the external power supply unit
Instrument in MSD mode (Mass Storage Device): connected to the PC, it works as
an SD card reader
SD card inserted in the instrument
Logging session enabled. The logging interval, in the case of automatic recording,
or the MANL indication, in the case of manual recording, is shown under the sym-
bol; the interval background turns light blue during acquisition time.
Auto-off between two logging instants activated
Start and stop logging instants programmed by the user
Only the logging start time is programmed
Only the logging stop time is programmed
"Monitor" function active (enabled by DeltaLog9 software)
The reduced level of brightness for the display is set
Reduced brightness level temporarily suspended following the push of a key (the
level will return to its “reduced” state after a few moments of inactivity)
Auto-off function activated (*)
Auto-off function disabled or temporarily suspended (for example, following the
activation of the logging) (*)
Power supply activated for hot-wire air speed probes or CO2probes
Battery charge between 67% and 100% (**)
Battery charge between 34% and 66% (**)
Battery charge between 4% and 33% (**)
Battery charge less than 4% (**)
(*) The symbol is off if the instrument is connected to the external power supply unit or to the USB port
of the PC.
(**) The symbol flashes when the battery is charging.

HD31 - 9 - V1.6
2.3 OVERVIEW OF THE FUNCTIONS IN THE COMMAND BAR
F1, F2 and F3 keys allow selecting the functions indicated in the display command bar. Press
the SELECT key to scroll cyclically through the main functions available in the command bar (or
alternatively the ESC key to scroll the functions in the opposite direction).
Some features include sub-functions (displayed in the command bar when you select the main
function by pressing the corresponding function key) or opening a menu. The scheme in Fig.
2.3.1 illustrates the functions listed using the SELECT key and the corresponding sub-functions.
Fig. 2.3.1: functions in the command bar
The commands shown in the scheme are briefly outlined below. For a detailed description,
please refer to the sections in the manual for the respective functions.
1. LOG (logging): logging on and off. If logging is not enabled, the following sub-functions
appear:
RUN: manual start of the logging.
PROG (program): setting the programmed start and stop of the logging.
SEL (select): selects the measurement line indicated by the cursor on the display for
logging. If the measurement line has been already selected, the selection is canceled.
If logging is enabled, the following sub-functions appear instead of RUN and SEL:
STOP: manual stop of the logging.
MANL (manual): manual acquisition of a sample (function enabled only if the setting
of the logging interval is MANUAL).
2. MENU: opens the configuration menu of the instrument.
3. USB: activation and deactivation of the MSD (Mass Storage Device) to read the SD card
from the PC (see paragraph 14.1 at page 110).
4. IN (input): selection of the quantities to be displayed. The following sub-functions are
shown:
<<<: scrolls backward the available quantities in the display line indicated by the cursor.
DIFF: displays the difference between the quantity currently indicated by the cursor
and an equivalent quantity, if available. If there are several equivalent quantities,
press repeatedly F2 until the desired quantity is selected.
>>>: scrolls forward the quantities available in the display line indicated by the cursor.
5. UNIT: selects the measurement unit. The following sub-functions are shown:
<<<: scrolls backwards the measurement units available for the quantity shown in the
display line indicated by the cursor.
>>>: scrolls forward the measurement unit available for the quantity shown in the dis-
play line indicated by the cursor.
6. REL: displays the relative measurement, that is the difference between the current value
and the one stored when the key was pressed, in the display line indicated by the cursor.
Configuration Menu
Hot
-
wire power supply
Connection mode
Relative measure
Print of measures
Offset correction
Reset of peak value

HD31 - 10 - V1.6
7. REC (record): calculation of minimum, average and maximum values. The following sub-
functions appear:
AUTO: starts the automatic update, once per second, of the minimum, average and
maximum values.
MANL (manual): updates the minimum, average and maximum values taking into ac-
count the measurement at the time when the command is selected.
SEL (select): selects the measurement line indicated by the cursor on the display for the
REC function. If the measurement line is already selected, the selection is cancelled.
If an integral measurement is selected, (with illuminance or irradiance measurements),
REC function is replaced by ITG function.
ITG (integral): calculation of the integral. The following sub-functions appear:
RUN: starts the calculation of the integral.
SEL (select): selects the measurement line indicated by the cursor on the display for the
ITG function. If the measurement line is already selected, the selection is cancelled.
8. VIEW: views the minimum, average and maximum values (calculated with the REC func-
tion) of the selected quantity. The following sub-functions appear:
MIN: displays the quantity minimum value in the display line indicated by the cursor.
Press the function key again to return to the current measurement value.
AVRG (average): displays the quantity average value in the display line indicated by
the cursor. Press the function key again to return to the current measurement value.
MAX: displays the quantity maximum value in the display line indicated by the cursor.
Press the function key again to return to the current measurement value.
If an integral measurement is selected (with illuminance or irradiance measurements), the
VIEW function is replaced by the V/T function.
V/T (Value/Time): setting integration limits. The following sub-functions appear:
VAL (value): sets the threshold for the stoping of the integral calculation.
TIME: sets the integration time limit.
CLR (clear): sets to zero the integration time and threshold limit.
9. DEL: deletes minimum, average and maximum values (or the integral calculation, with ITG
function). The following sub-functions appear:
CANC (cancel): disables the REC function (or ITG) and deletes the minimum, average
and maximum values (or the integral calculation, in the case of ITG function).
CLR (clear): resets the minimum, average and maximum value calculation (or the in-
tegral calculation, in the case of ITG function).
10. PRINT: sends the three measurements displayed when the key is pressed to the printer
connected with the RS232C output. Also the information about the connected probes (type
of probe, serial number, type of calibration used) are printed.
11. PLOT: displays the real-time graphics of the measurement indicated by the cursor on the
display. The following sub-functions appear:
X: displays the vertical cursors.
ΔX: sets the scale of abscissae.
Y: displays the horizontal cursors and the zoom functions of the axis of ordinates.
12. HOTW (hot-wire): supplies or removes power to the hot-wire air speed probe.
13. ZERO: corrects the offset of the probes provided with this function.
14. PEAK: resets the peak value of the pressure probes.
Note: some functions may appear disabled (grayed out) according to the selected quantity and
the instrument state.

HD31 - 11 - V1.6
2.4 HELP FUNCTION
The instrument is provided with a quick HELP function that briefly describes the meaning of the
symbol appearing in the display status bar and the function of the commands available through
the SELECT key.
To access the HELP function:
1. Press the SELECT key to display
the MENU command in the com-
mand bar.
2. Select the MENU command by
pressing the F2 key.
3. If necessary, select the HELP item using Sand Tkeys, then
press F3 key (OK command) to confirm.
4. The HELP of the commands available with the SELECT key ap-
pears. To cycle through the list of commands, select repeat-
edly “<<<” (F1 key) or “>>>” (F3 key)
5. To display the help of the symbols appearing in the display
status bar, select the ICON command by pressing F2 key.
6. To cyclically scroll the symbols’ list, repeatedly select “<<<”
(F1 key) or “>>>” (F3 key). To return to the Help of the
commands, select the FKEY command by pressing the F2 key.
7. Press ESC key twice to exit the menu and return to the mea-
surement mode.
HD31 - 12 - V1.6
3MEASUREMENT MODE
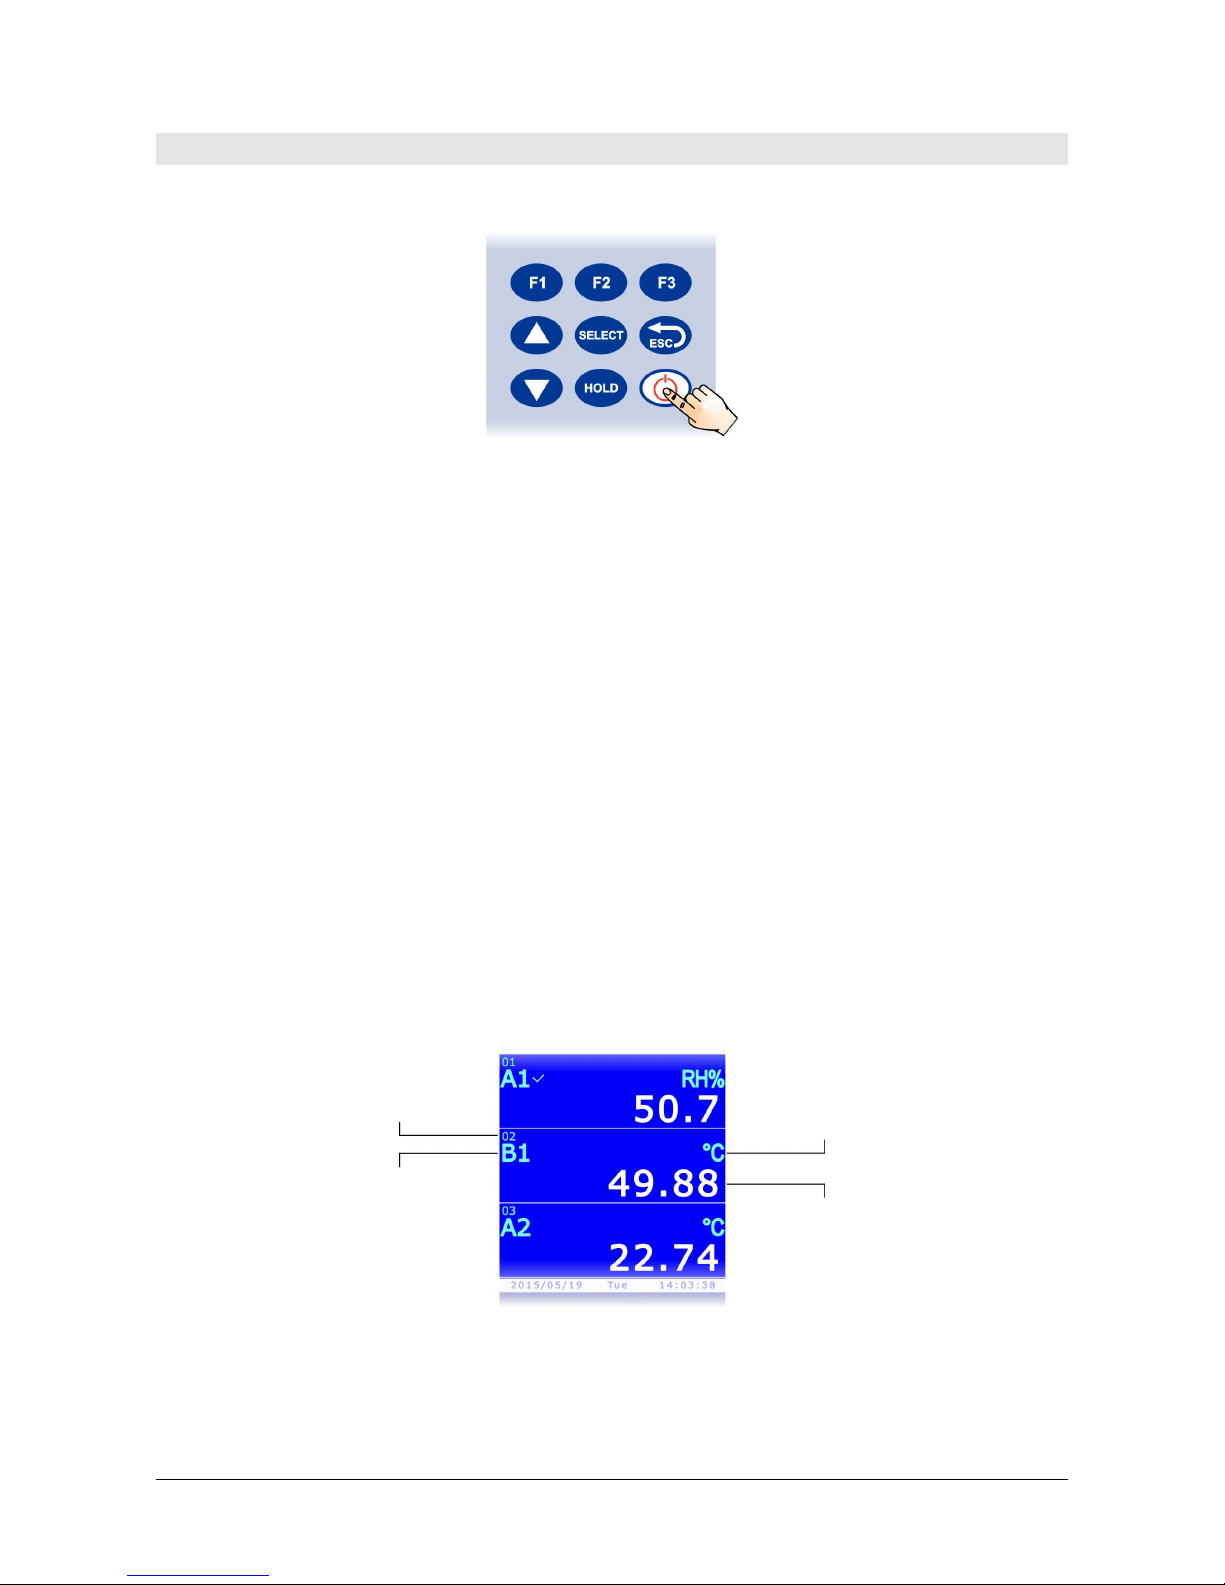
Switching on and off the instrument is obtained by pressing the ON/OFF key.
Fig. 3.1: ON/OFF key
At startup, the instrument checks for the probes connected to inputs and, after a few seconds,
goes to the standard measurement mode, displaying the measured quantities. The instrument
displays three measurement lines at the same time.
The quantities appearing on the display are identified by the letter (A, B or C) corresponding to
the input channel connected to the probe measuring the quantity, followed by a sequential
number helping to differentiate the various quantities measured by the same probe (combined
probes) or any derived quantities.
When the instrument is first switched on, it lists the available quantities depending on the
number and type of the connected probes, choosing among A1, B1, C1, A2, B2, C2, A3, B3,
C3.... For instance, if input A is connected to a humidity/temperature combined probe, and in-
put B to a Pt100 probe, the automatic configuration will organize the display as follows:
•First line (A1): relative humidity in %RH;
•Second line (B1): temperature of the Pt100 single probe;
•Third line (A2): temperature of the combined probe.
By default, derived quantities are not displayed; see paragraph 3.4. for their display.
If there are more than three quantities, use Sand Tkeys to cyclically scroll upward or down-
ward the list of the available quantities. During the scrolling operation, a small sequential
number appears over the quantity identifier, marking the position of the measurement in the
list.
Fig. 3.2: measurements display
With the next switch-on, the instrument displays the list of the quantities as it appears at
switch-off.
Measurement unit
of the quantity
Measurement position
in the displayed list
(during scrolling only)
Quantity
identifier Measured value
HD31 - 13 - V1.6
Note: the recognition of the probes occurs when the instrument is on; if a probe is connected
when the instrument is on, the instrument has to be turned off and on to display the new
probe measures.
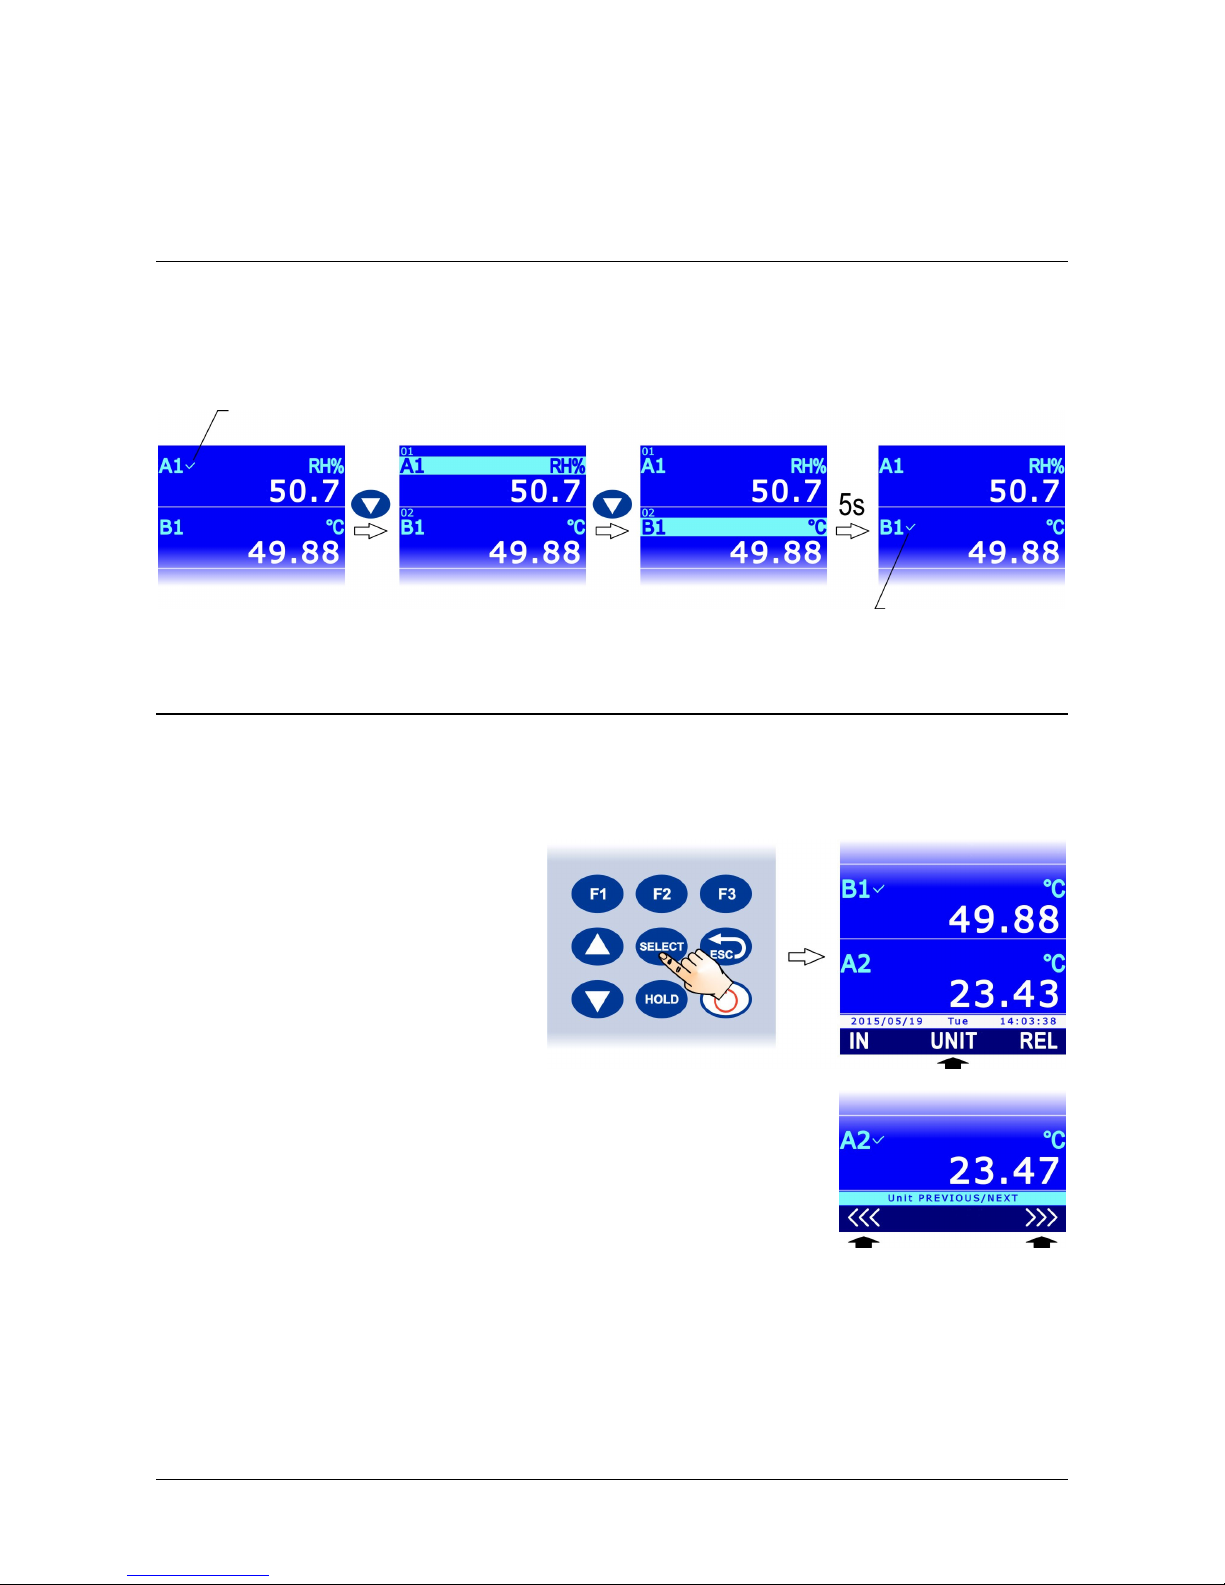
3.1 SELECTING A MEASUREMENT LINE
Some functions of the instrument have effect on the selected measurement line, indicated by a
check mark next to the quantity identifier. Use the Sand Tkeys to select a measurement
line. The currently selected measurement line is highlighted with the first press of the Sor T
key: repeatedly press the Sor Tkey until the desired measurement line is highlighted and
wait some seconds for the checkmark to appear.
Fig. 3.1.1: selecting a measurement line
3.2 SELECTING THE MEASUREMENT UNIT
Several measurement units are available for some quantities (temperature, pressure, air
speed, ...). To change the measurement unit of a quantity in a measurement line:
1. Select the desired measurement line using Sand Tkeys.
2. Press SELECT until the UNIT
command in the command bar is
selected, then select the command
by pressing F2.
Note: if the quantity has no meas-
urement unit available for selection
or RECORD and/or LOG functions
are enabled, the command is dis-
abled.
3. Select “<<<” (F1 key) or “>>>” (F3 key) to cyclically scroll
the available measurement units.
4. Press ESC to exit the UNIT command.
If several quantities of the same type (e.g. several temperatures) are shown in different mea-
surement lines, you can set different measurement units for each measurement line.
The measurement unit change affects the display and the immediate print of the measure-
ments (PRINT command). The data already stored in the SD card maintain the meas-
urement units selected at storage.
Check mark
Check mark
HD31 - 14 - V1.6
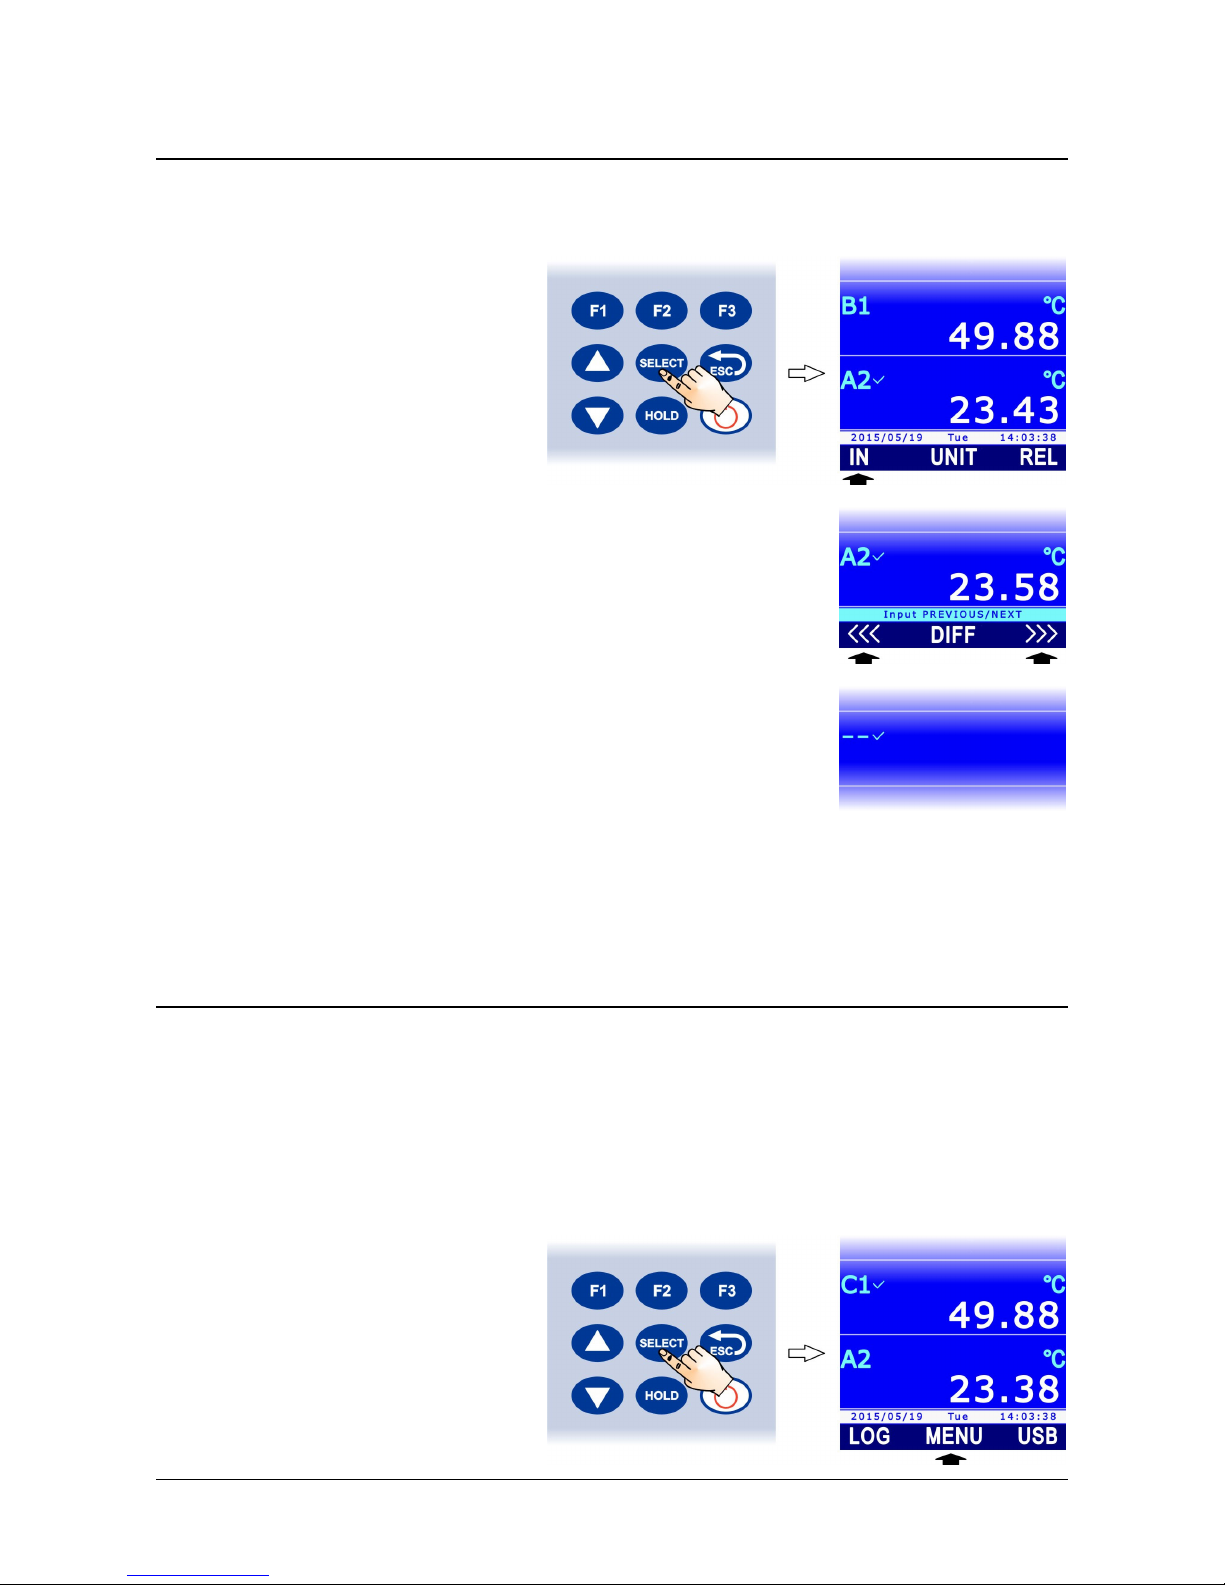
3.3 CHANGING THE QUANTITY VIEWED IN THE DISPLAY LINE
A quantity can be displayed in any measurement line of the display:
1. Select the desired line with Sand Tkeys.
2. Press the SELECT key to display
the IN command in the command
bar, then select the command by
pressing F1 key.
3. Select “<<<” (F1) or “>>>” (F3) to cyclically scroll the
available quantities.
If you don’t want quantities to be displayed in the line, select
"––".
4. Press ESC to exit the IN command.
The same quantity can be displayed in several lines, e.g., for the simultaneous display of mini-
mum and maximum values, or the current value and the average value, etc. (note: to display the
minimum, average and maximum values of a quantity you need to activate the RECORD function,
see chapter 5).
3.4 DERIVED QUANTITIES AND NUMBER OF MEASUREMENT LINES DISPLAYED
The number of measurement lines displayed can be configured. Up to 36 measurement lines can
be displayed. The number of measurement lines displayed at the same time is always 3, further
measurement lines can be seen by scrolling the list upward or downward using Sand Tkeys.
By default, the instrument displays only the quantities measured by the probes and the main
derived quantities. For instance, connecting a combined relative humidity and temperature
probe displays only the temperature, the relative humidity and the dew point temperature, but
not the other derived quantities: absolute humidity, mixing ratio, etc. To enable any other de-
rived quantities as well, or to disable some of the visible quantities, proceed as follows:
1. Press SELECT to display the MENU
command in the command bar, then
select the command by pressing F2.

HD31 - 15 - V1.6
2. Select the SETUP item using Sand T, then press F3 (OK
command) to confirm.
3. Select the CHANNELS item using Sand T, then press F3
(OK command) to confirm.
4. Select the A, B or C input of the instrument, using Sand T,
then press F3 (OK command) to confirm.
5. The list of the available measured and calculated quantities,
relevant to the selected input is displayed. The checkmark
next to a quantity indicates that the quantity measurement is
enabled (appears in the display). Using Sand T, select the
quantity to be enabled or disabled, then press F1 (SEL com-
mand) to toggle between the enabled and disabled states of
the quantity.
6. Press F3 (OK command) to confirm.
Note: the enabled state of several quantities can be changed by selecting them one at a
time, before confirming; the changed quantities are displayed in yellow to highlight
changes.
The instrument allows the setting of the quantity enable state to be saved, so as to be able to re-
store it afterwards and cancel any changes carried out thereafter.

HD31 - 16 - V1.6
Select the BKUP command (F2 key) to save or restore the saved
setting.
Select the SAVE command (F1) to save the setting. Select the
LOAD command (F2) to restore the previously saved setting. Se-
lect the BASIC command (F3) to return to the default setting.
Press F3 (OK command) to confirm the restore operation.
Press ESC to return to the previous menu.
Number of displayed measurement lines:
The number of the displayed measurement lines is automatically updated when quantities are
enabled or disabled. If you want a different measurement number to be displayed, e.g. to
show simultaneously both the current value of a quantity and the relevant statistical informa-
tion (Min, Max, Avg), the number of displayed measurement lines can be set manually:
1. Select the CHANNELS NUM. item in the CHANNELS menu,
using Sand T, then press F3 (OK command) to confirm.
2. Set the number of measurement lines to be displayed using
Sand T(select the RESET command with F2 key to set the
default number), then press F3 (OK command) to confirm.
Note: the current setting is shown in white, while the other
available settings appear in yellow to show that they are not
the current setting.
3. The instrument returns to CHANNELS NUM item, repeatedly press ESC to exit the menu.

HD31 - 17 - V1.6
3.5 DISPLAYING THE DIFFERENCE BETWEEN TWO HOMOGENEOUS QUANTITIES
A measurement line can display the difference between the values of two homogeneous quan-
tities, e.g. the difference between the values measured by two Pt100 probes, by two thermo-
couple probes, by two equal pressure probes etc.
The difference between the measurements of two different probes cannot be calculated, even
if they refer to the same physical quantity, e.g. between the measurement of a Pt100 probe
and a thermocouple probe, or between the measurement of two pressure probes having a dif-
ferent full scale value.
To display the difference between the values of two homogeneous quantities:
1. Select the first of the two quantities (e.g. A2, if you want A2-B1 to be displayed) using S
and Tkeys.
2. Press SELECT to display the IN
command in the command bar,
then select the command by press-
ing F1.
3. Select the DIFF command by pressing F2.
Note: if a quantity consistent with the one selected is not
available, the command is disabled.
4. The selected measurement line shows the difference between
the value of the quantity originally included in the line (e.g. A2)
and the value of another available homogeneous quantity.
If several homogeneous quantities are available, repeatedly
select the DIFF command (F2 key) to display the desired dif-
ference.
To disable the difference display, repeatedly select the DIFF
command (F2 key) to display again the value of the quantity
originally present in the line.
5. Press ESC to exit the IN command.

HD31 - 18 - V1.6
3.6 DISPLAYING THE RELATIVE MEASUREMENT (REL)
The instrument allows the relative measurement of the quantities to be displayed, i.e. the dif-
ference between the current measurement value and a reference value, consisting in the mea-
surement value at the moment of the REL function activation.
To activate the relative measure:
1. Select the quantity you want the relative measure to be enabled, using Sand T.
2. Press SELECT to display the REL
command in the command bar,
then select the command by press-
ing F3.
3. The selected measurement line shows the difference between
the quantity current value and the reference value, consisting in
the measurement value at the moment of the REL command
activation. The reference value is displayed in the upper part of
the measurement line (followed by the symbol REL).
Select again the REL command (F3 key) to disable the display of the relative measure and re-
turn to the current measurement value.
3.7 HOLDING THE MEASUREMENT ON THE DISPLAY (HOLD)
The HOLD function holds the current measurement values on the display. The function affects all
the measurement lines. When the HOLD function is active, the measurement values on the dis-
play are not updated, but remains set to the value present at the moment of the function activa-
tion.
Press HOLD to activate the function. The function activation is highlighted by the orange bars
over and under the measurement area on the display, and by the word HOLD flashing in the
top bar. The clock in the bottom bar remains stopped to the moment the key was pressed.
Fig. 3.7.1: HOLD function activation
Press again HOLD to disable the HOLD function and return to the current measurement val-
ues.
Orange bars
Reference value

HD31 - 19 - V1.6
3.8 MEASUREMENT GRAPH
The graph of a quantity measured by the instrument can be shown in the display. Zoom func-
tions and vertical and horizontal cursors are available during the graphical representation, al-
lowing the graph to be analyzed in detail.
Select the quantity you want the graph to be displayed using Sand T. Press SELECT to display
the PLOT command in the command bar, then press F3.
Fig. 3.8.1: PLOT command
If the graph of another quantity was previously started, a message appears asking to confirm the
change: select YES (F3 key) to continue (or press F1 to select NO and exit). The quantity
graph appears on the display.
Fig. 3.8.2: graph display
The minimum and maximum values of the ordinate axis (y-axis) are shown at the left of the
graph. Over the graph, in the middle, there is the ordinate scale: ΔYis the difference between
two horizontal lines of the graph grid. Under the graph, in the middle, there is the abscissa
scale: ΔXis the difference between two vertical lines of the graph grid.
Horizontal cursors and ordinate axis scale:
By selecting the Ycommand (F3 keys), the horizontal cursors and the zoom commands of the
ordinate axis are displayed.
The CUR command (F2 key) activates alternatively the lower or the upper cursor. The active
cursor is light blue, while the non-active cursor is white. You can move the active cursor using S
and T. The positions of the two cursors appear in the command bar.

HD31 - 20 - V1.6
Fig. 3.8.3: horizontal cursors
The ZOOM command (F3 key) enlarges the graph area included between the two horizontal
cursors: the minimum and maximum values of the ordinate axis are equal to the values indi-
cated by the lower and the upper cursor respectively. The indication AUTO (automatic ordinate
scale) is replaced by the indication ZOOM over the graph, on the right.
The AUTO command (F1 key) allows zooms to be disabled and to return to the automatic or-
dinate scale.
Fig. 3.8.4: AUTO command
Vertical cursors and x-axis scale:
Selecting Xcommand (F1 key) displays the vertical cursors of the abscissa axis (x-axis).
The CUR command (F2 key) activates alternatively the lower or the upper cursor. The active
cursor appears light blue, while the non-active cursor is white. The active cursor can be moved
using <<< (F1 key) and >>> (F3 key) commands. The time distance between cursors (Δx) and
the difference of the two measurements in correspondence with the cursors (Δy) appear over the
command bar.
Fig. 3.8.5: vertical cursors
Press ESC to return to the previous command level.
The time interval between two vertical lines of the graph grid is set by default to 1 minute. Select
ΔXcommand (F2 key) to change the interval.
Upper cursor
Lower cursor
Lower cursor
p
ositionU
pp
er cursor
p
osition
Right cursor
Left cursor
Difference of measures in co
r
re-
spondence with the cursors
Time distance between cursors
Table of contents
Other Delta OHM Other manuals
![Delta OHM HD33[L]M.GSM User manual](/data/manuals/1r/8/1r86k/sources/delta-ohm-hd33-l-m-gsm-manual.jpg "Delta OHM HD33[L]M.GSM User manual")


