DINA SAFELINE VARIO User manual
SAFELINE VARIO
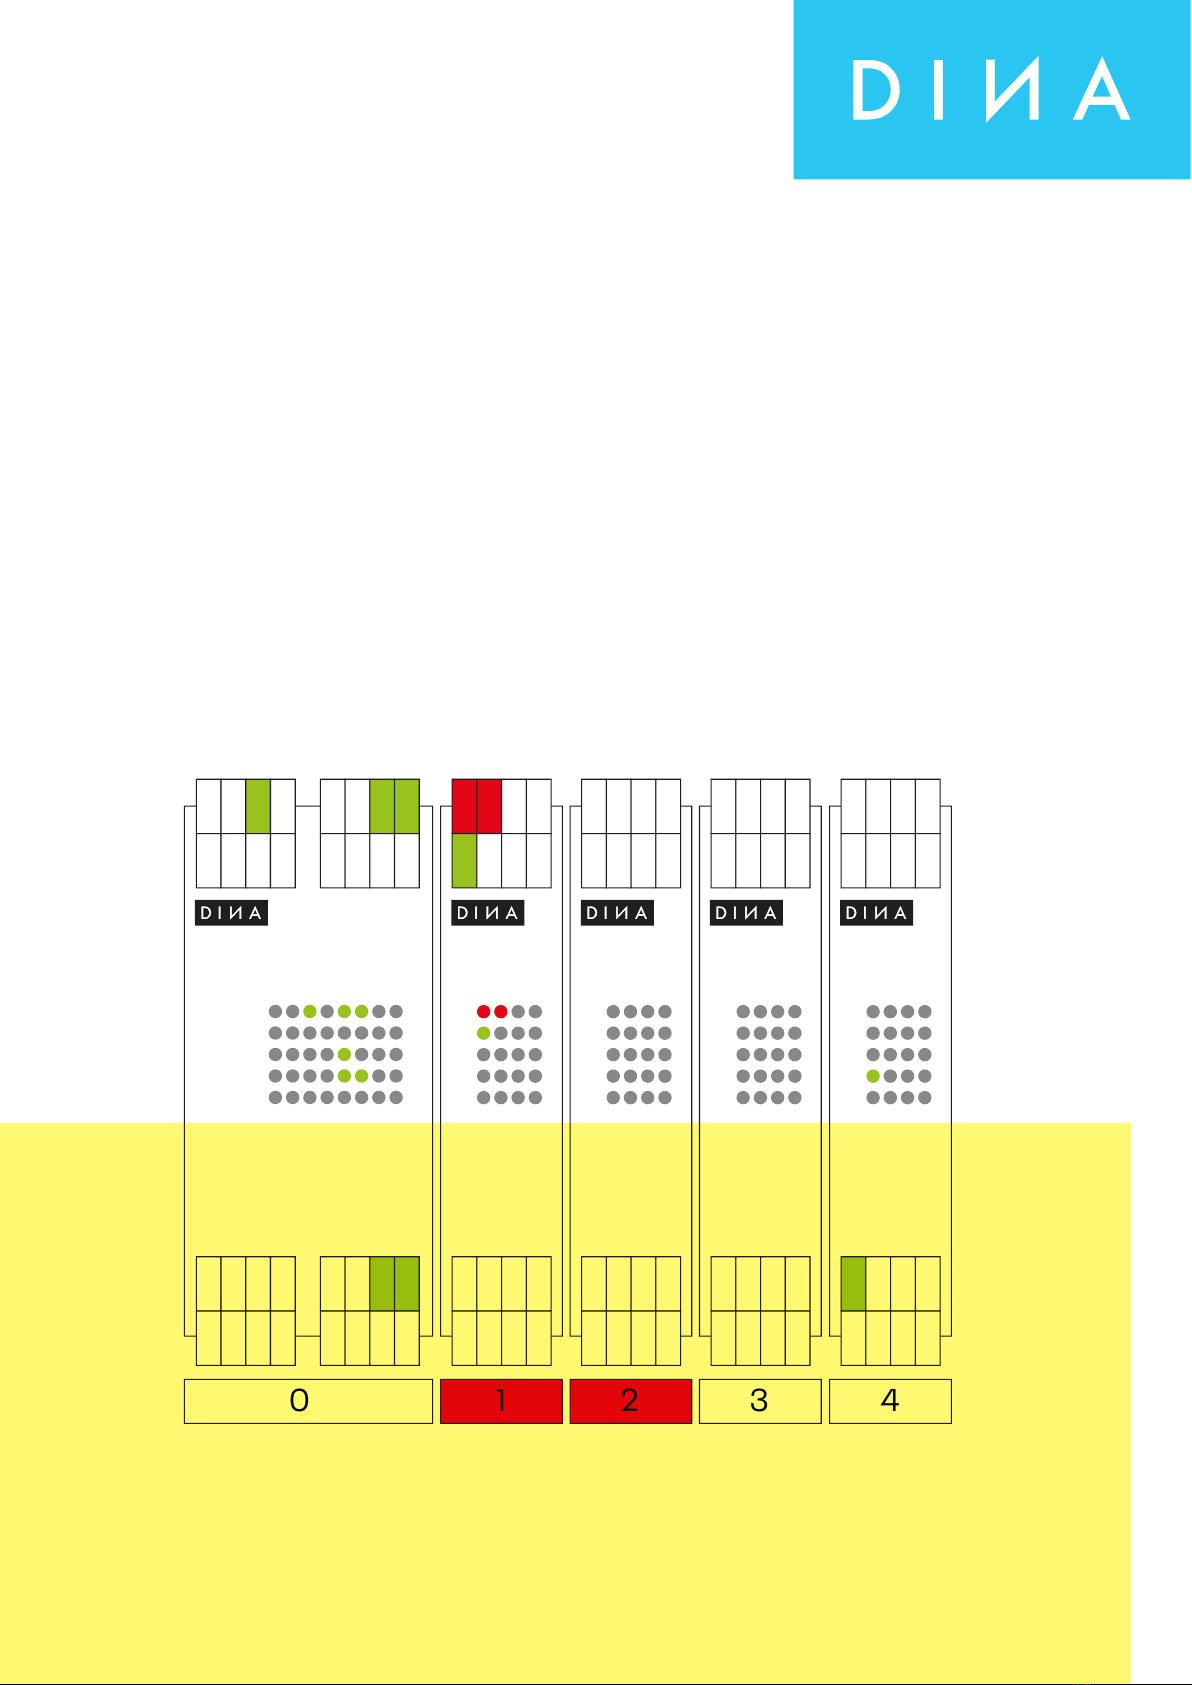
Diagnosis
Instruction Manual
dina.de
0 1 2 3 4

DINA Elektronik GmbH
Esslinger Straße 84
72649 Wolfschlugen
Deutschland
Phone +49 7022 9517 0
Mail inf[email protected]
Web www.dina.de
© Copyright by DINA Elektronik GmbH 2021
All parts of this documentation are protected by copyright.
Any use beyond that permitted under copyright law is not permitted without express written con-
sent from the publisher. This applies in particular to the reproduction, distribution and translation
of this documentation or parts thereof, as well as the storage and processing of this content using
electronic data processing systems.
The information contained in this documentation corresponds to the technical state of the product
at the time these operating instructions were published.
Legal information
Handbook: Instruction manual
Target group: Electricians, electrical designers
Editor: DINAElektronik GmbH
File name: Slvario-diag-en-v0351.docx
Language: ENG
Publication as at: 5. October 2021

Instruction Manual SAFELINE VARIO Diagnostics
Table of contents
Table of contents
1 Online-Diagnostics 6
1.1 Starting the Online Diagnostics
1.2. Display of the symbols in the online diagnostics
2 Rack-Diagnostics 11
2.1. Starting the Rack Diagnostics
2.2. Diagnostics Buttons
2.3. Read out Rack information
2.3.1. Overview of possible representation types of modules
2.4. Module Diagnostics
2.4.1. Overview of possible module terminals representation
2.4.2. Overview of LED display possibilities
2.4.3. Overview of LED display possibilities to speed monitoring
2.5. Status information
2.5.1. Status information central module ZMV
2.5.2. Latch for speed monitoring at ZMV
2.5.3. Status information about timers
2.5.4. Status information about counters
2.5.5. Status information about safety mats
2.5.6. Status information about copier
2.5.7. Status information about cams
2.5.8. Status information about synchronicity comparator
2.5.9. Status information about analog-terminals
2.5.10. Status Information about Analog-Input Comparator
2.5.11. Status Information about Safe brake test
2.5.12. Tables
2.6. Status information for the speed monitoring modules
2.6.1. Latch function
2.7. Status information about Fieldbus Module FBV
2.8. Status information about Input Module INV
2.9. Status information about In/Output Module IOV
2.10. Status information about module RMV
2.11. Status information about network module NIV
3 Error Diagnostics 35
3.1 Show detailed information
4 History 38
4.1. Read out History
4.2. Delete History

Instruction Manual SAFELINE VARIO Diagnostics
Table of contents
SL VARIO Diagnostics
Fast detecting of error and operating states
Product description
The graphical programming software SL VARIO Designer allows extensive diagnostics options. Status
information as well as set points and actual values of the SL VARIO-modules are captured and displayed
by the software.
The use of graphic elements makes it very easy to detect errors and to identify the operational states
of the SL VARIO-modules and errors can be quickly and effectively eliminated.
For the diagnosis the central module ZMK respectively ZMVK needs to be connected to the PC via the
USB port.There are two diagnostic options available:
In the online diagnostic conditions can be detected with an open application.
The rack diagnostics, the states can be read out to the connected modules without opening an application.

Instruction Manual SAFELINE VARIO Diagnostics
1 Online-Diagnostics
1 Online-Diagnostics
In the online diagnosis the logic states of the application can be observed. The system status as
well as the requirements for a fault free operation can be retraced.
1.1 Starting the Online Diagnostics
3Open designer and link SL VARIO
to the computer with the USB interface.
3Open application, if necessary enter
password for authorization to use the
application. (Fig. 1-1)
Fig. 1-1
3Adjust interface in the menu
“transmission-interface” (Fig. 1-2),
see designer manual.
Fig. 1-2
3Select „DIAGN“ in the menu “logic”. (Fig. 1-3)
Fig. 1-3
The diagnostics is started and the actual states of the modules are displayed.
A color change of the button indicates the active diagnostics. (Fig. 1-4)
Fig. 1-4
During the diagnosis not all functions of the Designer are available.
Blocked functions are displyed in grey. (Fig. 1-5)
Fig. 1-5
Table of contents
Popular Safety Equipment manuals by other brands

Lanex
Lanex PB-20 instruction manual

SKYLOTEC
SKYLOTEC ANCHOR ROPES Instructions for use

Besto
Besto Buoyancy Aid 50N Instructions for use

TEUFELBERGER
TEUFELBERGER NODUS Manufacturer's information and instructions for use

Troy Lee Designs
Troy Lee Designs Tbone Product owners manual

Innova
Innova Xtirpa Instruction and safety manual

bolle SAFETY
bolle SAFETY B810 quick start guide

SHENZHEN FANHAI SANJIANG ELECTRONICS
SHENZHEN FANHAI SANJIANG ELECTRONICS A9060T instruction manual

Hiltron security
Hiltron security POWER8E Installation and use manual

Salewa
Salewa MTN SPIKE user manual

Hatco
Hatco B-950P installation guide

Sitec
Sitec TX MATIC operating manual


