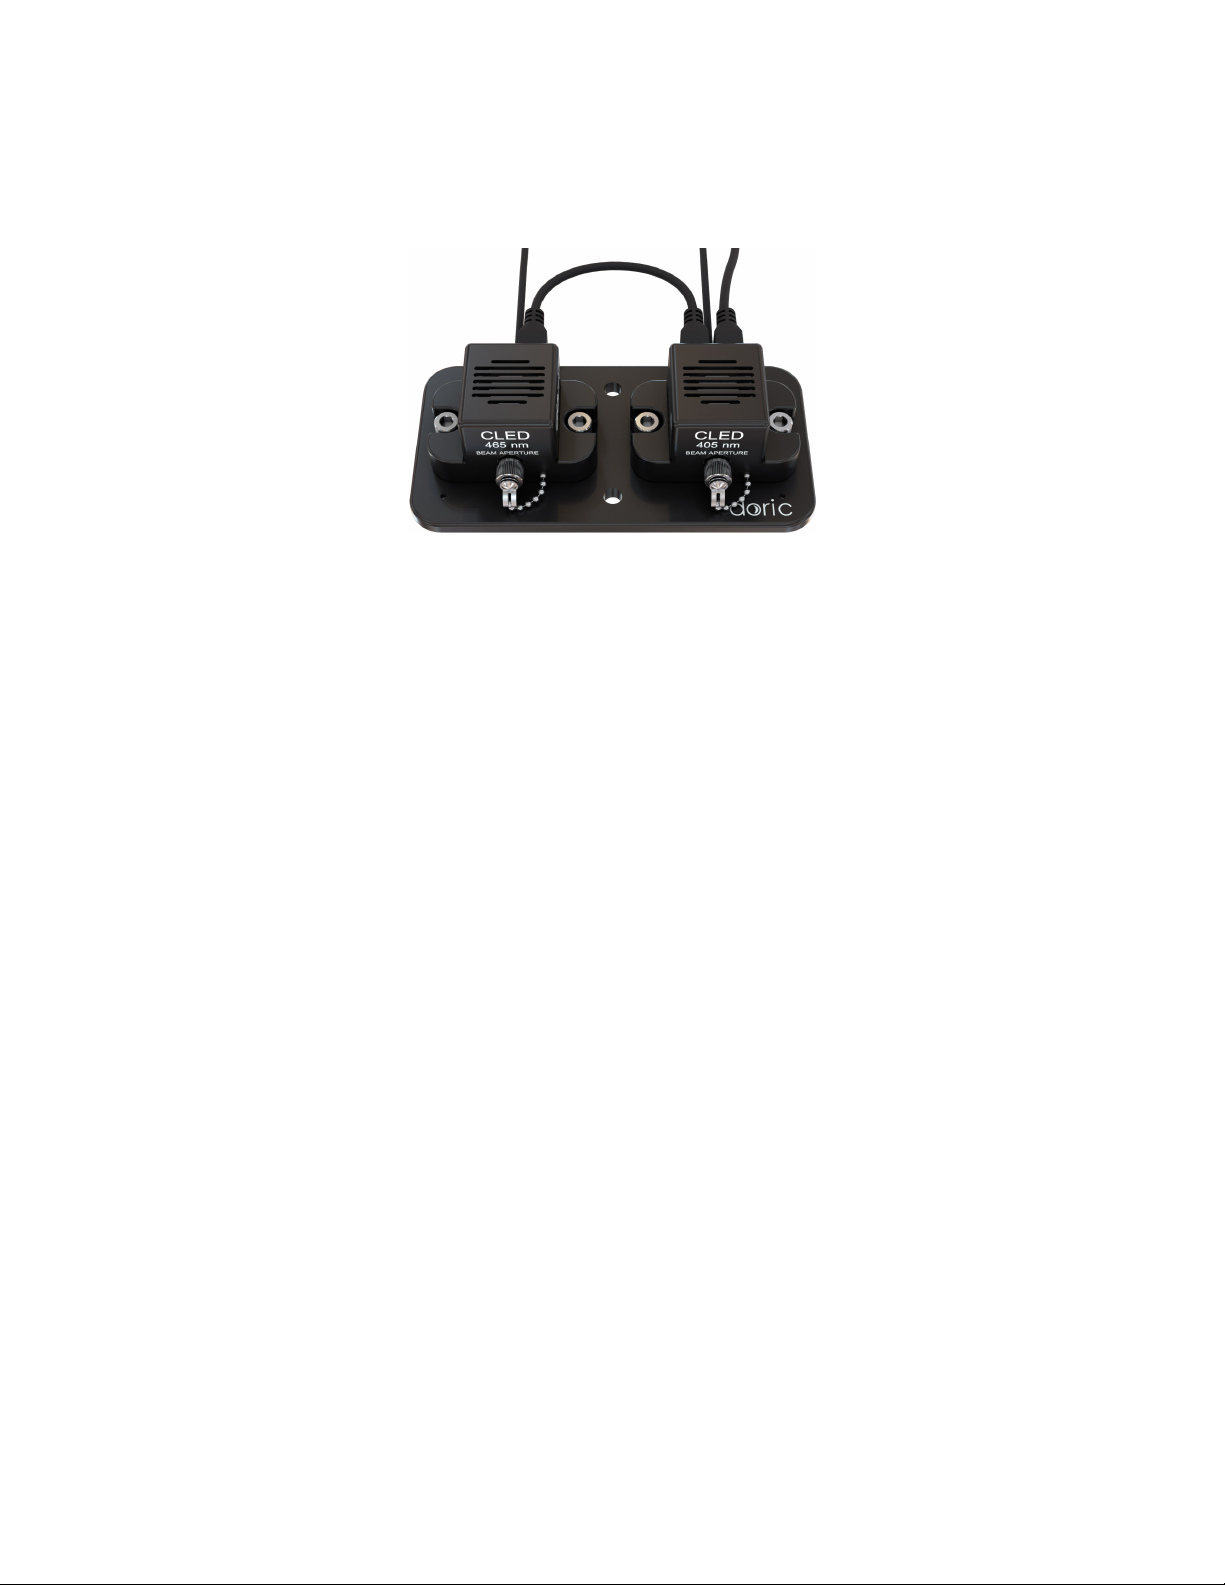
DORIC Connectorized LED Series User manual

Connectorized LEDs & LED Drivers
User Manual
Version 1.1.2

Contents
1 Safety Information 3
1.1 Important Safety Information ............................................. 3
2 Overview 4
2.1 Connectorized LEDs .................................................. 4
2.2 LED Drivers ....................................................... 5
2.3 LED Breadboard ..................................................... 7
3 Operations Guide 8
3.1 Connectorized LED Setup ............................................... 8
3.2 FC Connector Installation ............................................... 9
3.3 Stand-alone mode (without Doric Neuroscience Studio Software) ........................ 10
3.4 Connected to Doric Neuroscience Studio Software ................................ 12
4 Doric Neuroscience Studio 13
4.1 Light Sources ....................................................... 13
5 Specifications 22
6 Annex 1: Safety features 25
6.1 Activation Safety Features ............................................... 25
6.2 Emission Indicator .................................................... 26
7 Support 27
7.1 Maintenance ....................................................... 27
7.2 Warranty ......................................................... 27
7.3 Contact us ........................................................ 27
2

1
Safety Information
1.1 Important Safety Information
Light-emitting diodes (LEDs) used with sufficiently high power levels can be dangerous for the eyes. NEVER LOOK di-
rectly into the beam exiting from the FC connector of an LED module or from any optical fiber connected to the FC
connector.
Doric LED Drivers are provided with a safety interlock connector on its rear panel (Fig. 1.1a). When the interlock circuit
connector is shorted with the interlock plug, the driver is enabled. The shorting electric wire in the interlock plug can be
removed and replaced by the safety interlock circuit of the laboratory. This safety feature is highly recommended with
UV and infrared (IR) LEDs.
The Power Key Switch is located on the left side of the driver (Fig. 1.1b) to control the use of the device. All light sources
connected to the driver can be enabled only when the power key is properly inserted.
To be enabled, LED Drivers must have its interlock circuit connector shorted with the interlock plug and
the power key properly inserted.
(a) Interlock connector plug connected (b) Properly inserted key switch
Figure 1.1: Safety procedure
3

2
Overview
2.1 Connectorized LEDs
Figure 2.1: Connectorized LED
The Doric Connectorized LED is a compact module that couples a high brightness LED into an optical fiber via an FC
receptacle. It is available in wavelengths from 365 nm to 940 nm, as well as white (5500 K temperature). The module
connects to the Doric LED Driver over the pigtailed M8 electrical cable. Each module contains a fan, which is powered
using a micro USB 5 V power supply. This fan cools the LED and allows stable output performance and long device
lifespan. The following elements are found on the outside of the light source.
• The output beam exits from the Beam aperture. The aperture is composed of a fiber coupling assembly that injects
the emitted light into an optical fiber. The standard model uses an FC fiber connector. A safety FC metal cap is
attached to the optical head to block the output light beam when no patch-cord is in place.
• The Fan grids are found on the top and sides of the light source.
• The M8 electrical cable links the light source to the driver. An EPROM within the light source allows the driver to
identify it when the cable is connected.
• The Power input is a 5 V micro-usb port used to power the fan.
• The Power output is a 5 V micro-usb port. A micro-usb/micro-usb cable is used links the port to the Power input
of a different LED.
4

2.2 LED Drivers
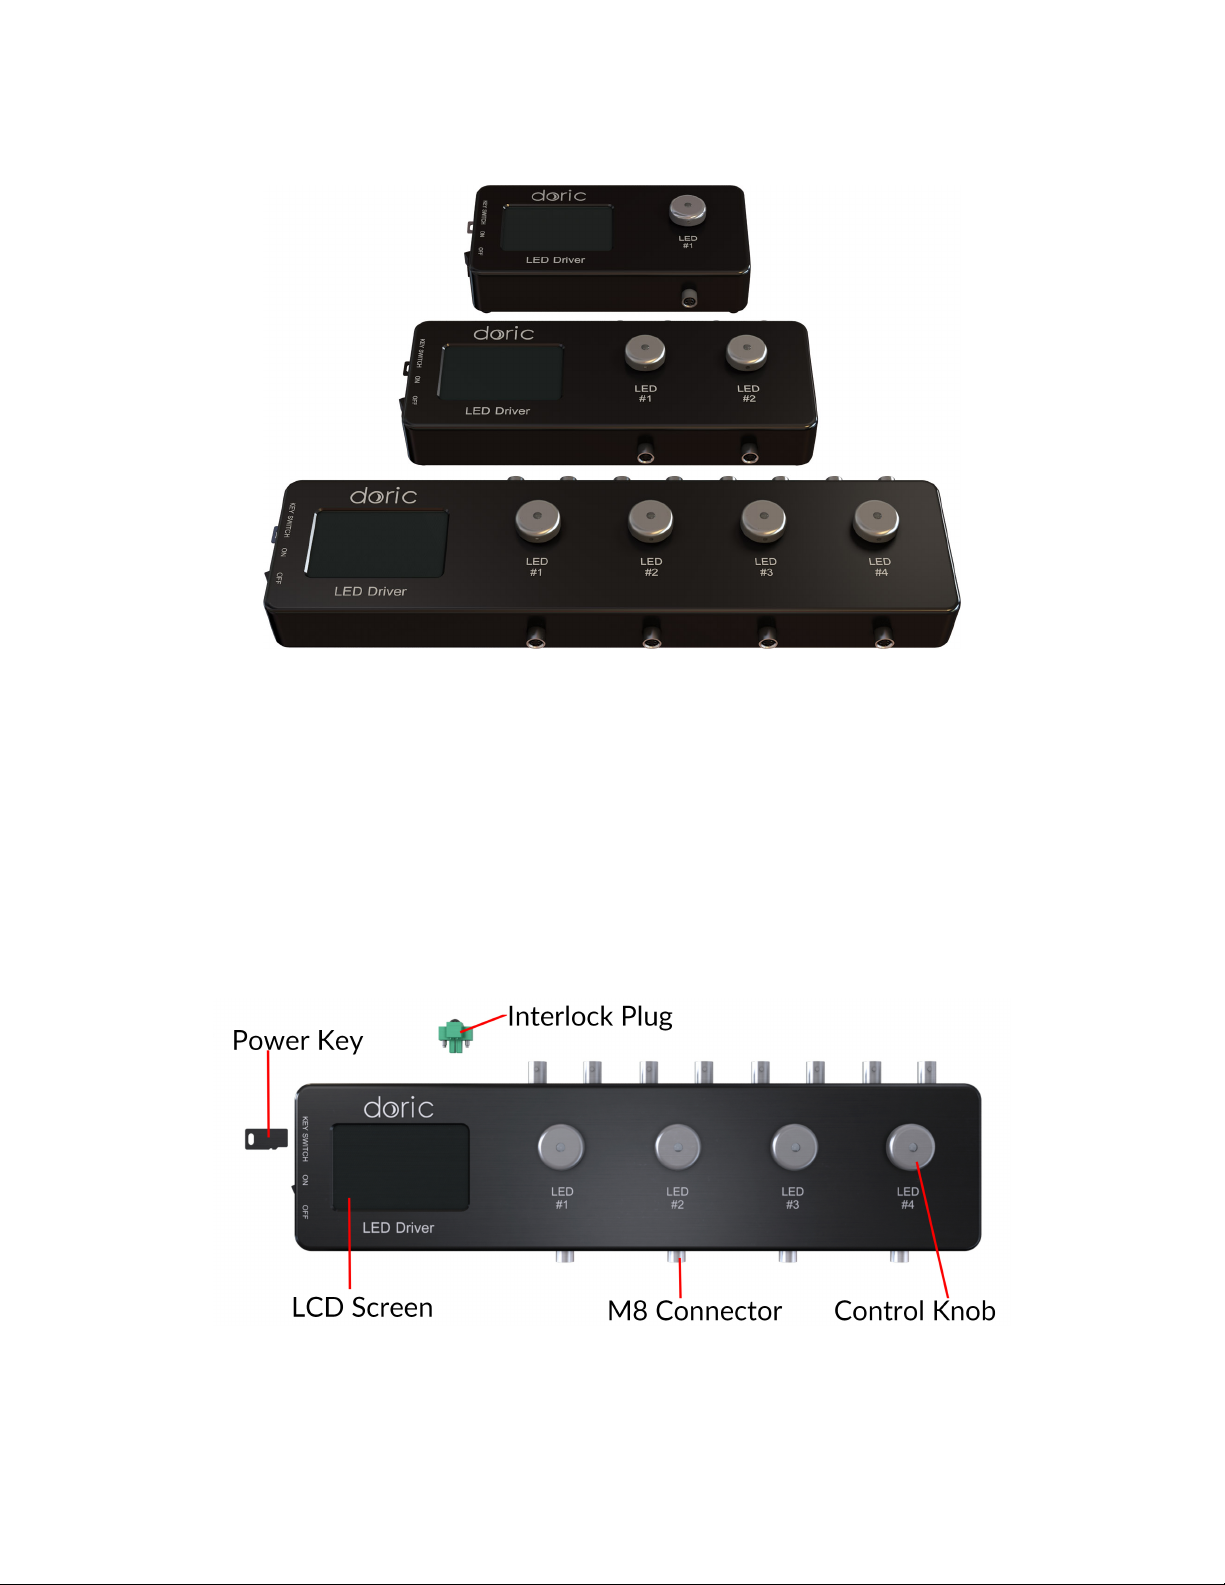
Figure 2.2: LED Drivers; 1-, 2- and 4-channel
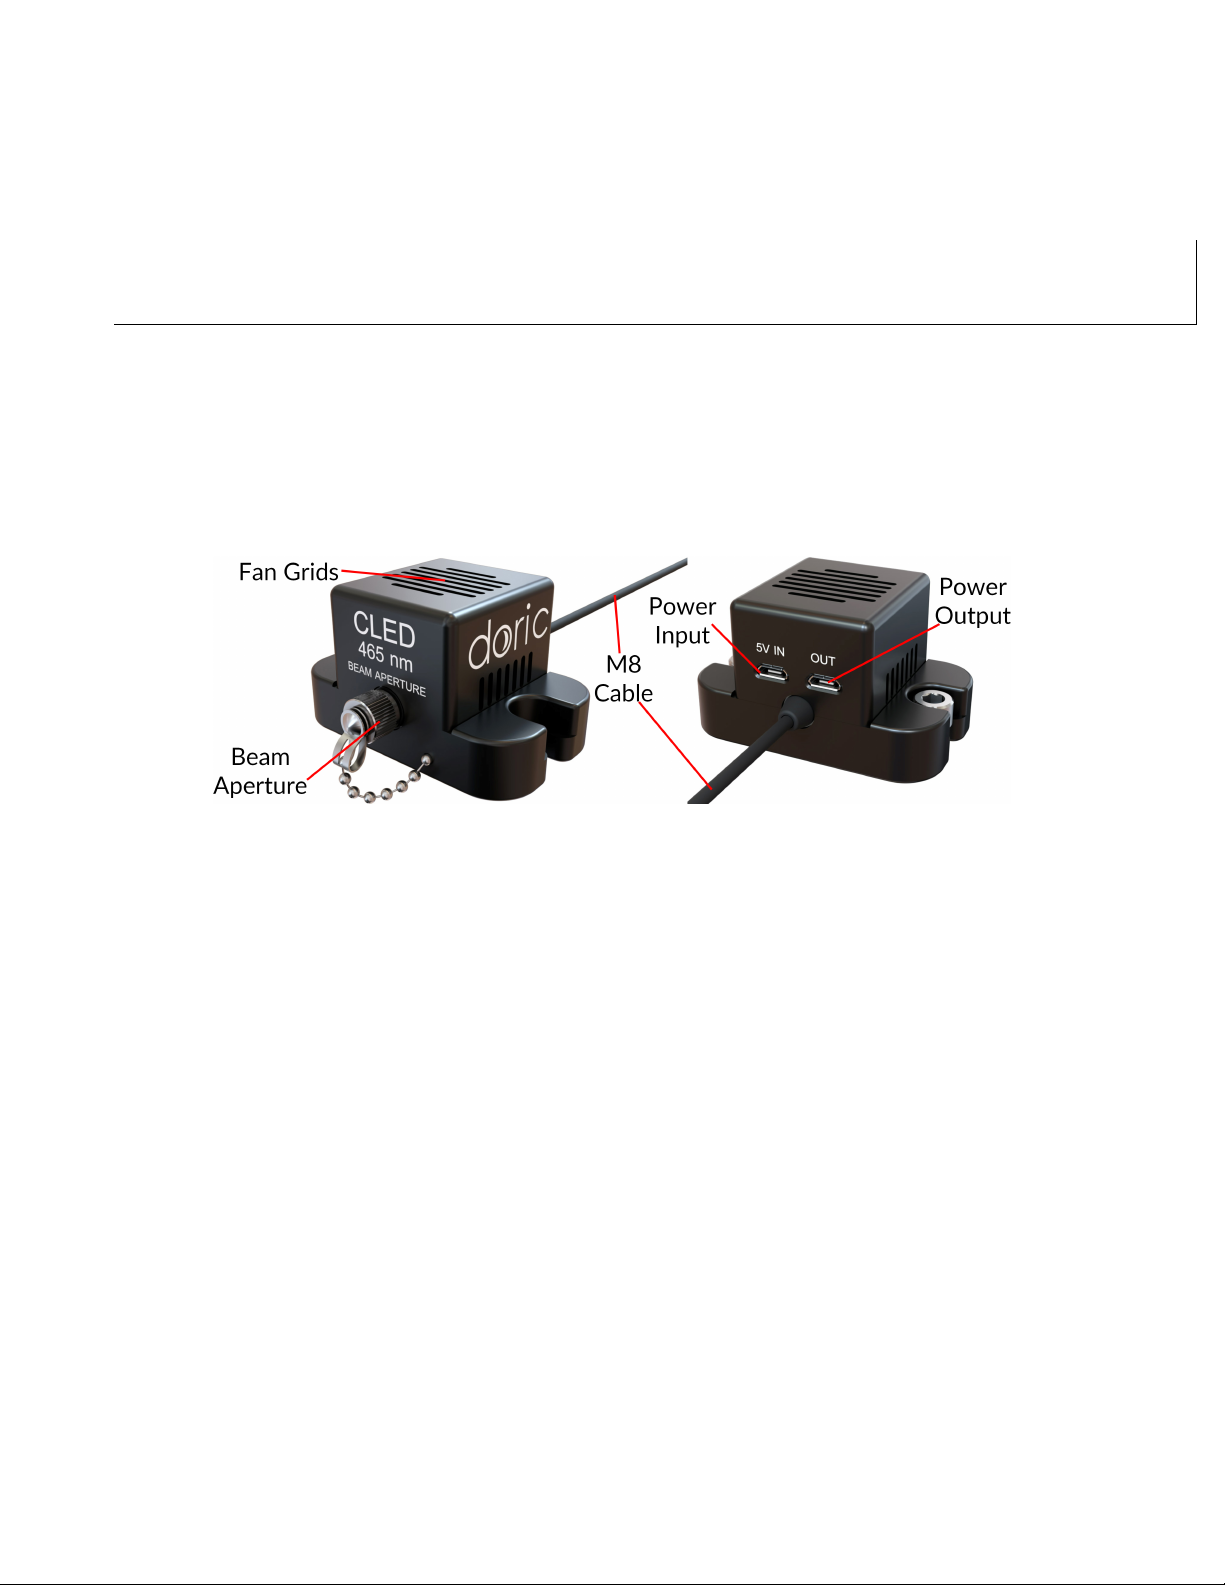
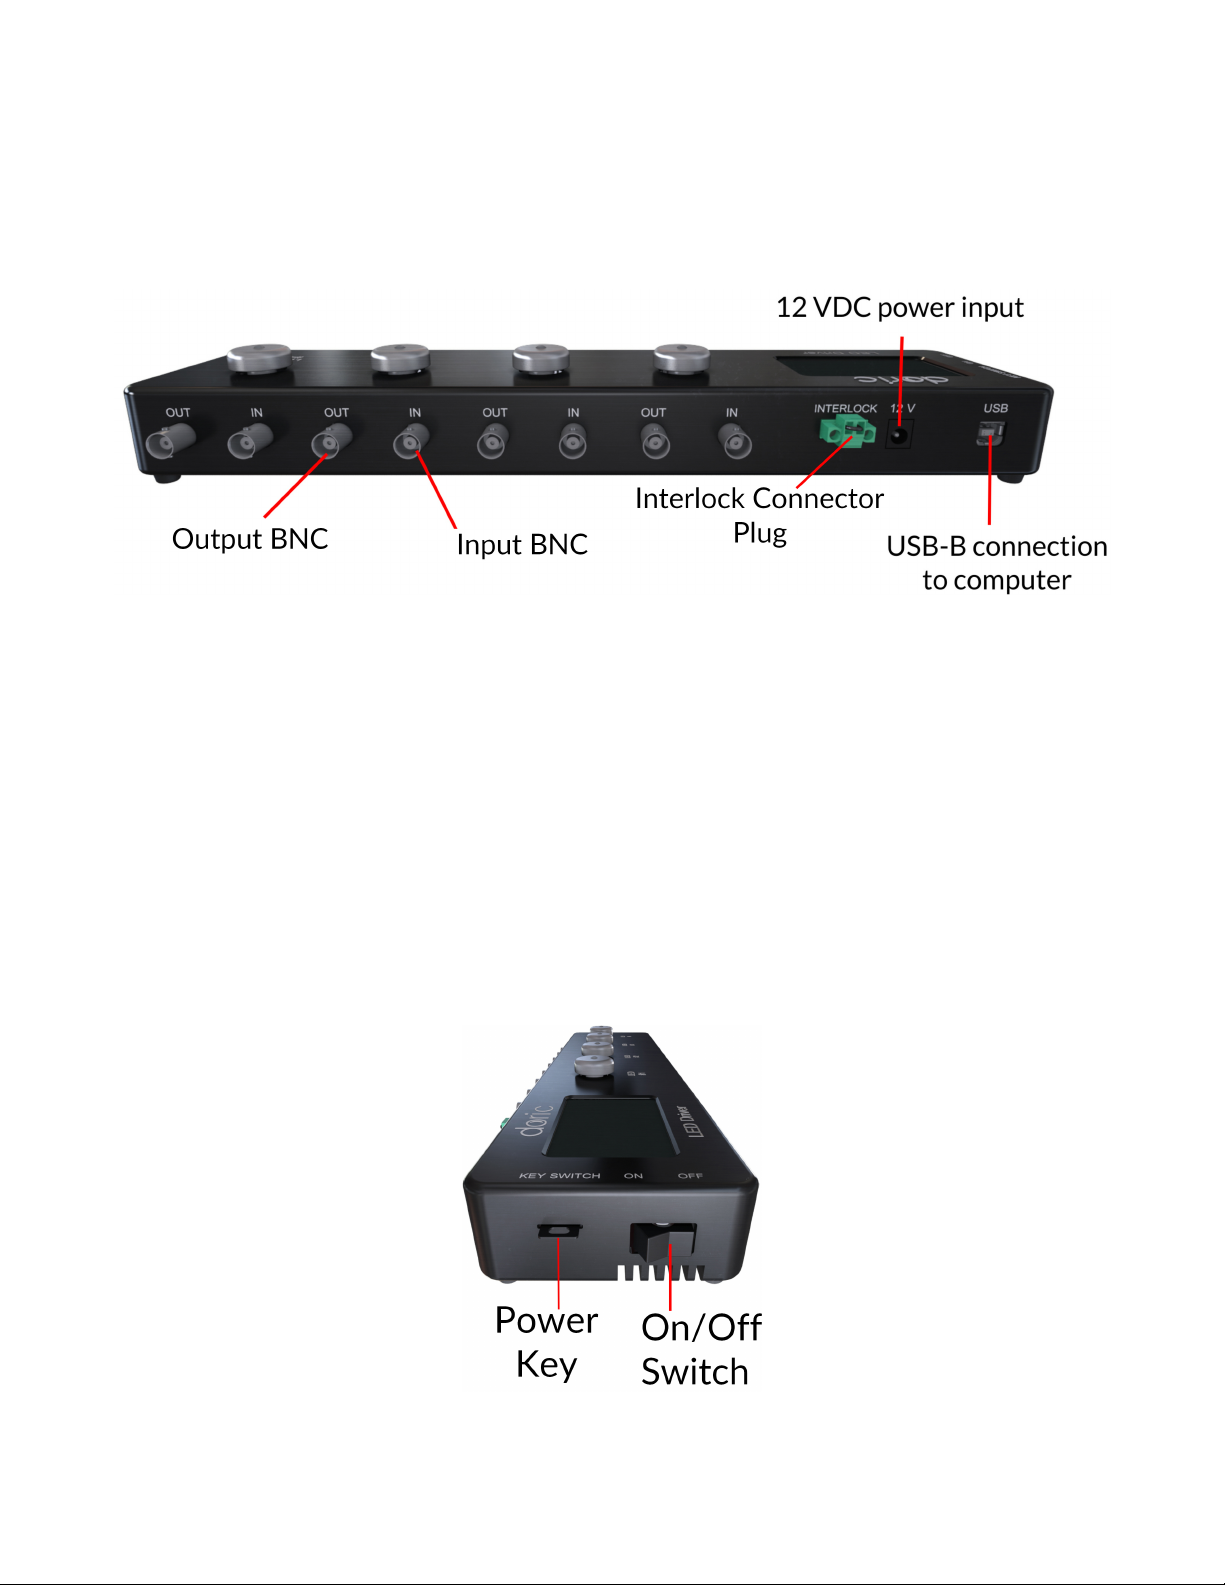
Doric LED Drivers can be used as a stand-alone device or controlled via USB port. Each channel connects to a single
Connectorized LED which can be controlled manually or via the Doric Neuroscience Studio Software.
The LEDs drivers can be used as a stand alone device. During stand-alone operation, it is possible to change the operating
mode (CW or external analog mode) and the current sent to the Connectorized LED. These changes can be done directly
on the device with the control knobs and the LCD display.
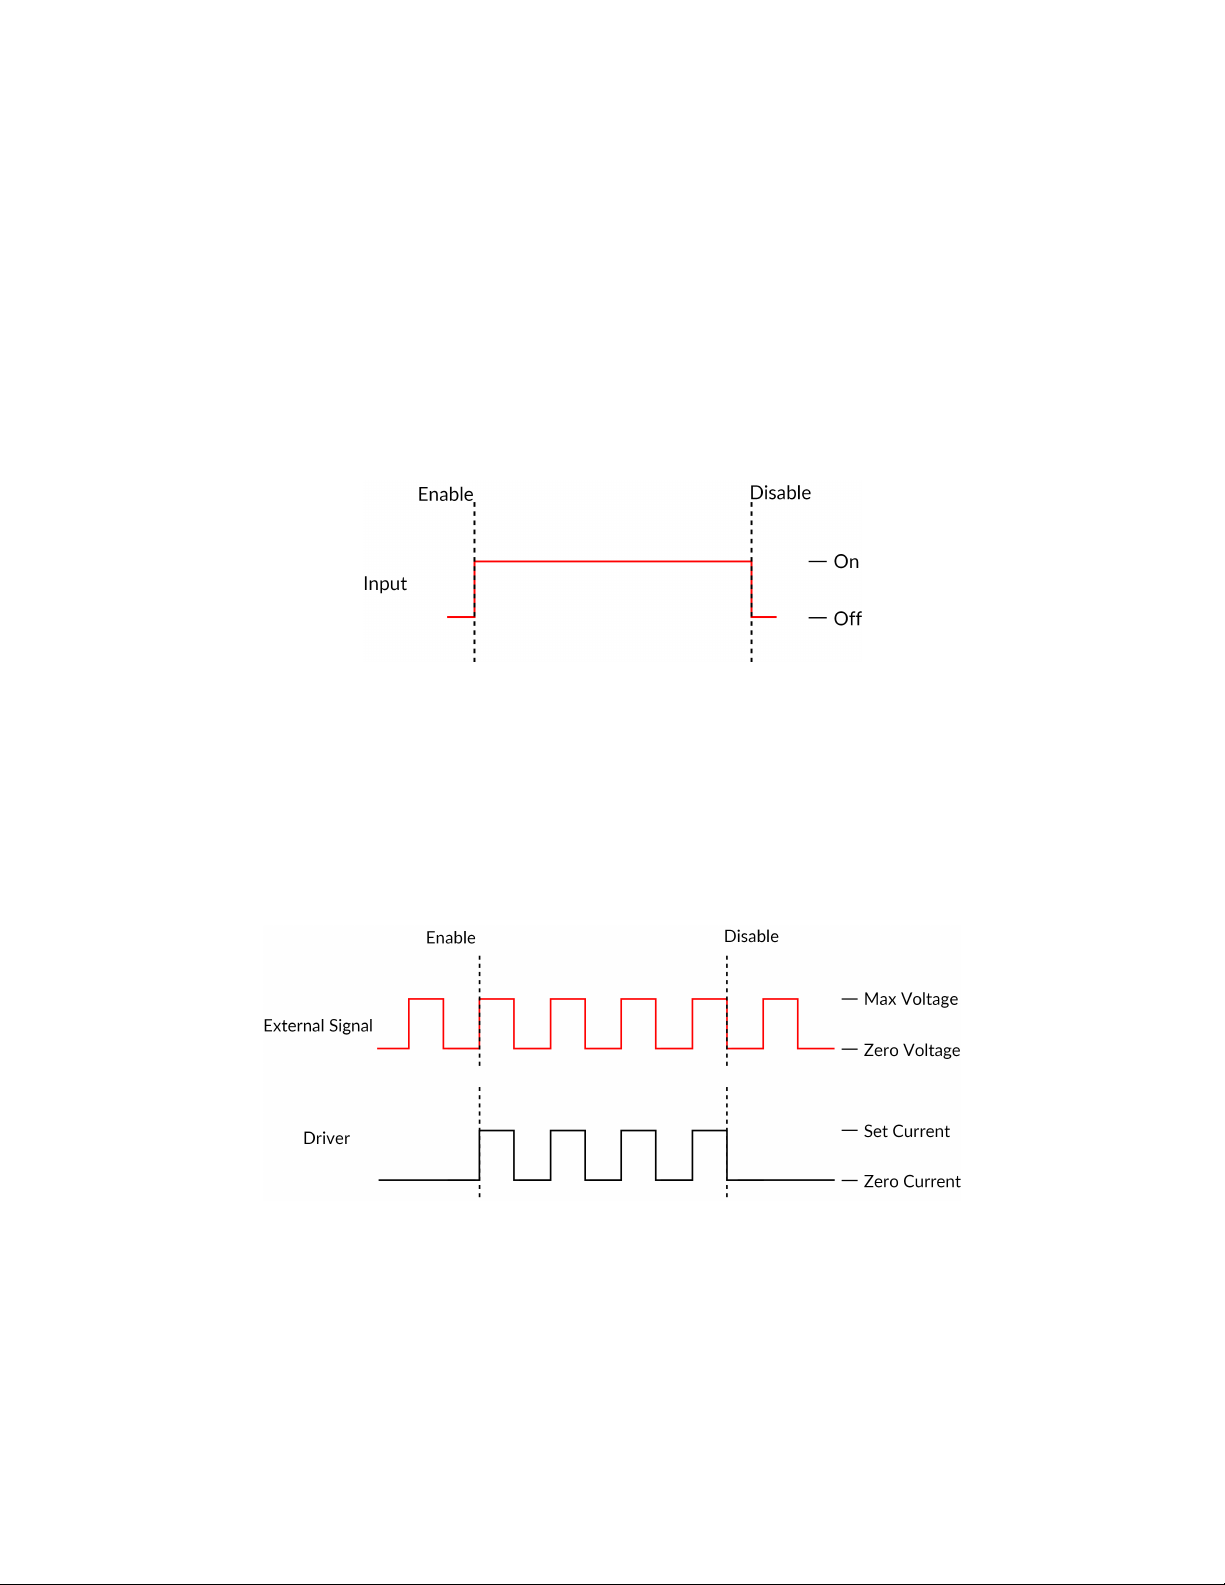
Connecting the LED drivers to a computer provides the user with more options. Doric Neuroscience Studio Software
allows the access to more operating modes like CW, external TTL, external analog, internal TTL and internal Complex
modes. Doric Neuroscience Studio Software enables the creation of different sequences of light source activation. It
also provides the possibility to let these sequences be triggered or paused by an external signal. If more power is needed,
it is possible to overdrive the LED driver with the software. Our LED driver has a live pulse capability allowing the
visualization of the signal modulation on the input BNC in a scope-like manner.
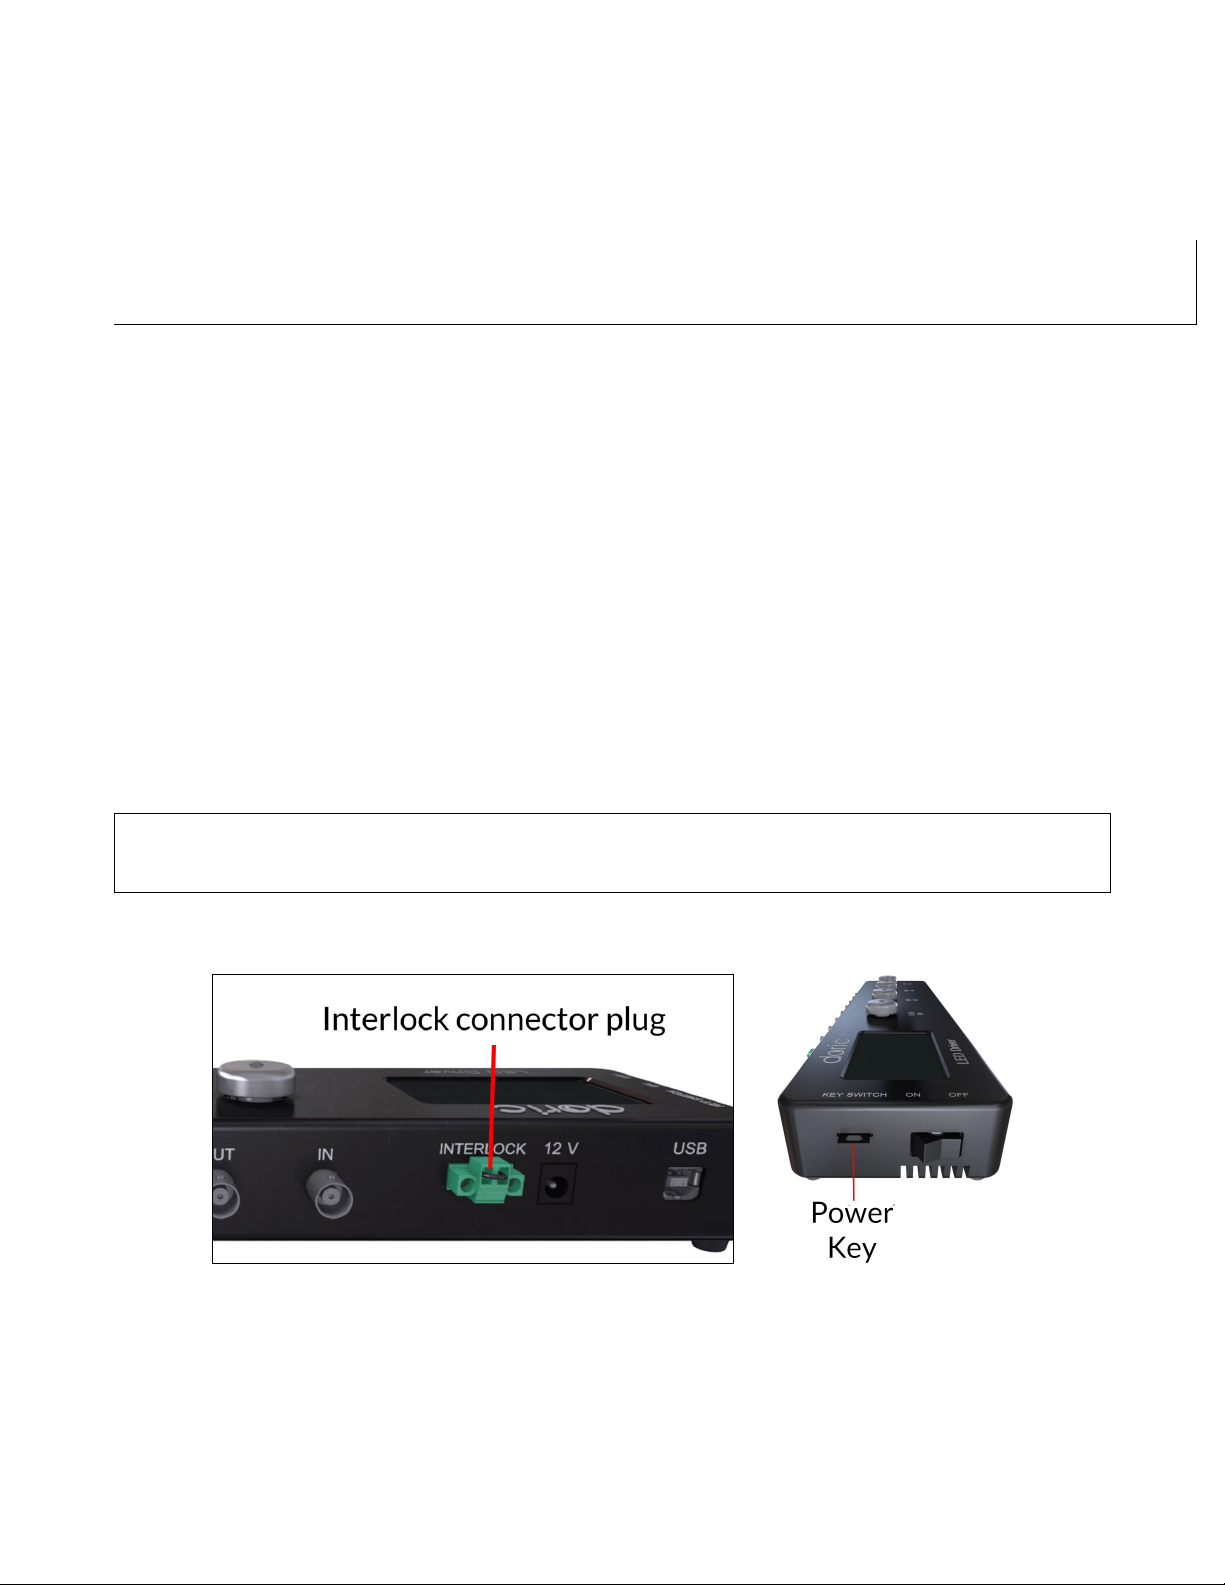
Figure 2.3: Front view of a 4-channel LED Driver
• The LCD display (Fig. 2.3) allows easy operation and monitoring. For each channel, the LCD displays the type of
light source (LED), the operating mode, the center wavelength in nm and the current setting.
Chapter 2. Overview 5

• The Power key must be properly inserted into the key switch to enable operation of the light source(s) connected
to the driver. Note that, despite its similar shape, the power key is not a standard micro SD card such as those used
in some digital cameras. Do not attach the Key to a key fob or similar holder; this may prevent proper insertion of
the Power key.
• The M8 connector is used to link the driver and LED.
Figure 2.4: Rear view of a 4-channel LED Driver
• The Interlock Connector Plug (Fig. 2.4) allows the user to connect the driver to an interlock system. It is recom-
mended to connect the interlock plug to a laboratory interlock system. This is critical when using LEDs in the UV
or Infrared spectrum, as they are invisible to the naked eye.
• The Input BNC allows the control of the LED driving current of the corresponding source with an analog or TTL
signal.
• The Output BNC are used to monitor the driving current of the corresponding light source.
• The 12 VDC power input connects the driver to its 12 VDC power supply.
• The USB-B Connector allows the driver to be connected to a computer using a USB-A/USB-B cable.
• The On/Off switch (Fig. 2.5) turns on/off the driver.
Figure 2.5: Side view of a 4-channel LED Driver
Chapter 2. Overview 6

2.3 LED Breadboard
The LED Breadboard is a small breadboard used to hold two Connectorized LEDs; this allows the light sources to be easily
moved when necessary. It is ordered separately from the light source.
Figure 2.6: LED Breadboard with LEDs Installed
Chapter 2. Overview 7

3
Operations Guide
3.1 Connectorized LED Setup
Figure 3.1: Connections to a 1-channel LED Driver in stand-alone mode
1. Connect the LED Driver to the 12 VDC power supply.
8

2. Connect the Connectorized LED (CLED) to the driver. Align the M8 connector pins in the female receptacle on
the Doric CLED driver, slide in and screw the nut in place.
3. Connect the 5 VDC Micro-USB Power Supply to the 5 V Input of the CLED Fan for proper cooling of the LED.
4. For optimal performances, place the module in a well ventilated area. Overheating will affect LED power and
reduce its lifetime.
•DO NOT connect/disconnect the optical fiber while the light source is ON.
• The CLED can be operated with the driver’s stand-alone capabilities (Section 3.3) or using the Doric Neuro-
science Studio software (Section 3.4).
3.2 FC Connector Installation
1. Clean the optical fiber connector before insertion. Use isopropanol and a lint-free wipe.
2. With an FC connector, the connector key must be oriented to enter within the receptacle slot to ensure proper
connection (Fig. 3.2).
Figure 3.2: FC connector, Fiber Installation
To reduce the risk of eye injury, it is sound practice to NOT CONNECT/DISCONNECT OPTICAL
FIBERS when the light source is turned on.
Chapter 3. Operations Guide 9

3.3 Stand-alone mode (without Doric Neuroscience Studio Software)
The following sections details stand-alone operation of the LED driver. For installation of the LEDC in stand-alone mode,
see section 3.1.
3.3.1 Driver operation modes with the stand-alone device
If the light source driver is used as a stand-alone device, 3 modes are available: constant current (CW), external TTL (Ext.
TTL), and external Analog (Ext. Ana). The operating mode is changed by pressing the Control knob. The maximal driving
current is set by turning Control knob. Use a fast/slow rotation for coarse/fine adjustment. The operating mode and the
maximum driving current setting are independently adjusted for each channel.
Constant current (CW)
Figure 3.3: Constant Current Mode Driver Signal
When using the CW mode, the user simply sets the driving current applied to the light source. The light source is acti-
vated and an output beam will be visible as long as the driving current is above the minimum driving current (Fig. 3.3).
External TTL (TTL)
Figure 3.4: Driver Signal Response to External Source in External TTL Mode
In the External TTL mode, the driver is activated by an input TTL signal coming from an external device. This activation
will follow the TTL pulse waveform. The driving current is set with the control knob, and is constant during each TTL
activation pulse.
Chapter 3. Operations Guide 10

External Analog (Ext. Ana.)
Figure 3.5: External analog pulse sequence behavior
The External Analog mode is similar to the External TTL, except that the driving current is proportional to the voltage ap-
plied on the BNC input connector (Fig. 3.5, top). On the input BNC, a maximum voltage signal corresponds to a maximum
driver current. Should the current set on the light source be less than the maximum current, any voltage corresponding
to a higher current will clip the output waveform (Fig. 3.5, bottom). To avoid any clipping of the output waveform, the
maximum current setting must be equal to or greater than the corresponding maximum analog input voltage.
Low power mode
To enable Low power mode, press the control knob for two seconds and an asterisk will appear indicating the switch to
the current divide mode. This option reduces the current, therefore the optical power. It is useful to get stable signals
in experiments requiring lower power (e.g. fiber photometry experiments). In this mode, the maximal current is 200 mA
(corresponding to a 5 V input) and the minimum is 2.5 mA. This allows a more stable LED power output at lower electrical
currents.
Chapter 3. Operations Guide 11

3.4 Connected to Doric Neuroscience Studio Software
Figure 3.6: 1-channel LED Driver USB connected to Doric Neuroscience Studio Software
1. Connect the LED Driver to the power outlet with the included 12 V AC-DC adapter and turn the LED Driver switch
ON. Always power the LED Driver before connecting the USB cable to the computer for a proper driver in-
stallation.
2. Install the Doric Neuroscience Studio Software on the computer. Double-click on the setup DoricStudioX.X.exe
file located on Doric USB memory stick supplied with the LED driver and follow the on-screen instructions.
3. Connect the USB cable to the driver and the computer.
4. Connect the Connectorized LED to the LED driver using the M8 electric cable. The light source will be recognized
by the software and will indicate the wavelength and the maximum current.
5. Connect the 5 VDC USB Mini-B Power Supply to the 5 V input for proper cooling of the LED.
6. With the system connected, the software can be used to control the device in External TTL, External Analog,
Internal TTL and Internal Complex modes. See section 4.1 for more details on using the software.
Chapter 3. Operations Guide 12

4
Doric Neuroscience Studio
When the LED is controlled by Doric Neuroscience Studio Software, the light stimulation can be synchronized with
other data acquisition.
4.1 Light Sources
Doric Light Sources can be controlled by the Doric Neuroscience Studio. These include LED Modules, Laser Diode Modules
and Ce:YAG Fiber Light Source. The interface is separated into two main sections, Control & settings and the Acquisition
View. Each light source driver has a number of Channels, each one controlling a light source of its given type. These
channels, accessible using the Add Channel will be the first detailed.
Figure 4.1: Light Source Driver Tab
4.1.1 Channels
Each light source driver is separated into a number of Channels. Each channel controls a single light source. While each
channel can be controlled in Stand-alone mode by the driver, additional functions can be accessed for these channels
13

when the driver is connected to the Doric Neuroscience Studio. These function are used through the Channel Config-
uration window (Fig. 4.2).
Figure 4.2: Light Source Channel Configuration Window
1. The Channel Types (Fig. 4.2) are displayed on the left side of the window. These include Laser light sources,
Ce:YAG light sources and LED light sources, as well as the Scope to measure signal using the driver.
2. The Channel Options box (Fig. 4.2) includes Light Source Options and Trigger Options for the given channel.
a) The Channel (Fig. 4.2) drop-down list identifies which driver channel is currently being edited, assuming a
driver with multiple channels.
b) The Mode (Fig. 4.2) drop-down list includes each possible driver mode. These are used to control the pulse
sequences emitted by the light source. The options related to this mode are detailed with the Sequence
Options.
c) The Current Options (Fig. 4.2) includes the slider used to control the current sent to the light source.
• When using a LED Driver module, the Overdrive checkbox will appear. When selected, this allows the
system to exceed the normal safe current limit of the light source. THIS SHOULD ONLY BE USED WITH
PULSED SIGNALS, AS IT CAN OTHERWISE DAMAGE THE LIGHT SOURCE.
• When using a LEDD, the Low-Power checkbox will appear. When selected, this allows reduced-power
signaling for the same voltage. This mode is only available for CLED modules. This allows low-power
signals to be more stable in time. The maximal current is reduced to one tenth of light source’s normal
maximal current. If the BNC Output is used, the voltage of the signal is proportional to the current pass-
ing through the light source, and not the voltage sent to it. For example, a driver with a normal maximum
current of 2000 mA for a 5 V signal (400 mA/V) will have a maximum current of 200 mA for a 5 V signal
(40 mA/V). The BNC output of the driver will still relate LED current with a 400 mA/V conversion factor.
d) The Trigger Options (Fig. 4.2) allow the selection of a number of trigger modes to activate a pulse sequence.
• The Manual trigger mode is standard, and allows direction activation by the user.
Chapter 4. Doric Neuroscience Studio 14

• The Triggered trigger mode is active when an input greater than 4 V is detected on the BNC input. Fol-
lowing input pulses will be ignored while the sequence is running. The sequence will restart with the
arrival of the first input pulse after the sequence has finished.
• The Gated trigger mode is active as long as there is a high TTL signal (4 V or more) on the input modu-
lation BNC. This signal comes from a different light source or device driver. When the TTL signal is low
(0.4 V or less), the sequence stops and waits for another high TTL signal to continue.
• If the TTL Output option is checked, the output BNC channel can be used as a TTL generator. The mon-
itoring signal will provide a TTL signal instead of an analog voltage output proportional to the LED cur-
rent. The output will send out a 5 V signal whenever the input current is >0 mA. This can be used even if
a light source is not connected.
3. The Sequence options box (Fig. 4.2) is where sequence options are defined depending on the mode. The Contin-
uous wave, External TTL and External Analog modes have no additional sequence options.
Figure 4.3: Constant Current Mode Driver Signal
a) The Continuous Wave mode (Fig. 4.3) produces a continuous signal at the chosen current. This mode can
only be triggered manually. When this mode is active, the driver channel will show CW under MODE. This
mode has no additional sequence options.
Figure 4.4: Driver Signal Response to External Source in External TTL Mode
b) The External TTL mode (Fig. 4.4) has the light source follow a TTL signal provided by an external source
connected to the BNC Input. When this mode is active, the driver channel will show TTL under MODE. This
mode has no additional sequence options.
c) The External Analog mode (Fig. 4.5) is similar to the External TTL, except that the current will be set by the
voltage on the BNC input (Fig. 4.5, top). On the input BNC, a maximum voltage signal corresponds to a max-
imum driver current. Should the current set on the light source be less than the maximum current, any volt-
age corresponding to a higher current will clip the output waveform (Fig. 4.5, bottom). To avoid any clipping
of the output waveform, the maximum current setting must be equal to or greater than the corresponding
maximum analog input voltage. See the corresponding light source manual to find the voltage/current rela-
tionship. This mode has no additional sequence options.
Chapter 4. Doric Neuroscience Studio 15

Figure 4.5: Driver and Light Source in External Analog Mode
Figure 4.6: Light Source Channel Configuration Window, square sequence options
d) The Square sequences mode has the light source follow a square pulse sequence.
i. The Starting Delay (Fig. 4.6) sets the delay (in hh:mm:ss:zzz format) before the first pulse.
ii. The Frequency/Period (Fig. 4.6) sets the frequency (in Hz) or period (in ms) for the pulse sequence.
For example, a signal at 10 Hz (frequency) will output one pulse every 100 ms (period), whereas a pulse
sequence at 0.5 Hz (frequency) will output one pulse every 2000 ms (period).
iii. The Time ON/Duty Cycle (Fig. 4.6) sets the time (in ms) or the duty cycle (in %) for each pulse. The Time
ON must be lower than (1/frequency)+0.005 ms, while the Duty cycle must be below 100 %. These
squares will appear red should an impossible Frequency/time ON be selected. Should the Smoothing
option be selected, this feature becomes inaccessible.
Chapter 4. Doric Neuroscience Studio 16

iv. The Smoothing option is used to change the pulse slope in square pulse sequences. The Edit Edges
button opens the Smoothing Edge(s) window (Fig. 4.7).
Figure 4.7: Light Source Smoothing Edge(s) Window
A. The Rise Time box is used to define the duration to rise from 0 to the pulse maximum.
B. The Plateau Time box is used to defined the duration the pulse is at its maximum value.
C. The Fall Time box is used to define the duration to descend from the pulse maximum to 0.
D. The Pulse Graph displays the pulse shape.
E. The Active Time box displays the total duration of the pulse. While the Smoothing option is active,
the Time ON is fixed at this value.
v. The Pulses per sequence (Fig. 4.6) sets the number of pulses per sequence. If it is set to 0, the pulse will
be repeated indefinitely.
vi. The Number of sequences (Fig. 4.6) sets the number of times that the sequence will be repeated. If it is
set to 0, the sequence will be repeated indefinitely.
vii. The Delay between sequences (Fig. 4.6) sets the delay (in hh:mm:ss:zzz format) between each sequence
if the Number of Sequences is greater than 1.
viii. The Total Duration (Fig. 4.6) displays the total time of the experiment. The different values can be Inf
for infinite, a valid time value or Err if the Time ON value is greater than 1/frequency.
Figure 4.8: Complex Sequences Window
Chapter 4. Doric Neuroscience Studio 17

e) The Complex Sequences mode mode allows the design of complex pulse sequences. Multiple sequences can
be combined to create a more elaborate pulse sequence. These are displayed in a spreadsheet format.
i. The Starting Delay (Fig. 4.8) sets the delay (in hh:mm:ss:zzz format) before the first pulse sequence.
ii. The Max Current (Fig. 4.8) sets the maximum current (in mA) for the given sequence.
iii. The Number of sequences (Fig. 4.8) sets the number of times that the sequence will be repeated, with a
minimum of 1.
iv. The Pulses per sequence (Fig. 4.8) sets the number of pulses per sequence, with a minimum of 1.
v. The Delay between sequences (Fig. 4.8) sets the delay (in hh:mm:ss:zzz format) between each sequence
if the Number of Sequences is greater than 1.
vi. The Frequency/Period (Fig. 4.8) sets the frequency (in Hz) or period (in ms) for the pulse sequence.
These two values are linked, and when one is changed the other will adjust automatically. For example,
a signal at 10 Hz (frequency) will output one pulse every 100 ms (period), whereas a pulse sequence at
0.5 Hz (frequency) will output one pulse every 2000 ms (period).
vii. The Time ON/Duty Cycle (Fig. 4.8) sets the time (in ms) or the duty cycle (in %) for each pulse. These
two values are linked, and when one is changed the other will adjust automatically. The Time ON must
be lower than (1/frequency)+0.005 ms, while the Duty cycle must be below 100 %.
Figure 4.9: Internal Complex Mode Pulse Sequences
viii. The Types of pulses (Fig. 4.8) sets the pulse type. Pulses can be Square, triangular (Triangle), Ramp
up Ramp down or Delay (Fig. 4.9). The Delay pulse type is used to create a delay between different
sequence
ix. The Sequence controls (Fig. 4.8) allow the addition (+) or removal (-) of sequences to the spreadsheet.
x. The Total Duration (Fig. 4.8) displays the total time of the experiment. The different values can be Inf
for infinite, a valid time value or Err if the Time ON value is greater than 1/frequency.
f) The Scope mode allows the measurement of electrical signal using the driver (Fig. 4.10). The signal is received
by the Input BNC of the chosen channel on the light source driver.
Figure 4.10: Scope
i. The Channel drop-down list indicated which driver channel will be used to receive signal. The chosen
can be used to drive a light source while serving as a scope.
ii. The Sampling Rate drop-down list allows the selection of the rate (in kilosamples per second) at which
measurements are taken.
4. The Preview box (Fig. 4.2) displays a preview of the chosen sequence while in the Continuous Wave,Square
Sequences and Complex Sequences mode.
5. The Apply button (Fig. 4.2) will generate the defined channel OR update an already configured channel with any
changes.
Chapter 4. Doric Neuroscience Studio 18

4.1.2 Control & Settings
The Control & settings sections is used to control the light source. It includes the following elements.
Figure 4.11: Control & Settings
1. The Add channel button (Fig. 4.11) opens the Channel Configuration window 4.2. See section 4.1.1 for more
details.
2. The Clear Configuration button (Fig. 4.11) clears all configuration channels. Cleared channels cannot be recov-
ered unless previously saved.
3. The Save configuration button saves all currently configured channels in .doric format.
4. The Load configuration button loads a file in .doric format that contains a previously saved set of configured
channels.
5. The Start All button (Fig. 4.11) starts all currently configured channels.
6. The Time Series button opens the Time Series window. This tool allows all channels to share the same timing.
Figure 4.12: Control & Settings, Time Series Window
• The Number of series (Fig 4.12) sets the number of times that the sequence will be repeated, with a minimum
of 1.
• The Time Active sets the duration of each series in hh:mm:ss:zzz format. If the Time series is used in combi-
nation with a sequence, the Time Active should be greater than the sequence Total Time If the Time Active
is shorter, the sequence will be stopped after the Time Active.
• The Interval between series sets the duration between each series in hh:mm:ss:zzz format.
• The Total Duration displays the total duration of the sequence in hh:mm:ss:zzz format.
• The Progression bar displays the progression of the sequence in %, while the Time Elapsed counter displays
the progression in hh:mm:ss:zzz format.
• The Launch button starts the sequence.
7. The Autoscrolling button activates the autoscroll function. When active, the Graph in the Acquisition View will
follow a section as wide as the time defined beside the button.
Chapter 4. Doric Neuroscience Studio 19

8. The Reset Zoom button resets the axes in the Graph to their standard values.
9. The Interlock indicator displays when the interlock is correctly connected, and when discon-
nected.
10. The Ce:YAG Temp indicator displays the temperature of the Ce:YAG source in real time. This indicator will only
appear when a Ce:YAG driver is connected to the computer. Should the temperature be too high the temperature
will appear in red. Should the temperature be too low, the temperature will appear in blue.
4.1.3 Experiment View
The Experiment View box is used to display information related to the usage of each channel. This section allows limited
control of the light source while it is active.
Figure 4.13: Experiment View, Light Source Channel
1. The Light Source Channel box (Fig. 4.13) contains all elements related to a single light source channel.
2. The Scope Channel box (Fig. 4.14) is used to control and configure an active Scope.
Figure 4.14: Experiment View, Scope Channel
3. The Controls View displays all elements to control/configure the channel.
a) The Start/Stop button activates/deactivates the light source connected to the Light Source Channel.
b) The Edit button opens the Channel configuration window to edit the pulse sequence. This button is only
accessible when the channel is deactivated.
c) The Current Box box allows the current to be changed exactly (in mA).
d) The Current Slider allows the light source current to be adjusted.
e) The Status box displays the status of the channel (Light source or Scope). The Status will display RUN-
NING... when active and STOPPED when deactivated.
Chapter 4. Doric Neuroscience Studio 20
This manual suits for next models
4
Table of contents
Other DORIC Lighting Equipment manuals
Popular Lighting Equipment manuals by other brands

American DJ
American DJ Quad Phase HP User instructions

GFS
GFS NETLIGHT Quattro-Industry manual

Turo Light
Turo Light TL-EMRM24 installation instructions

Testrite Visual
Testrite Visual Charisma SEG 3D Lit XS Series manual

Costco
Costco 310659 instructions

ORACLE LIGHTING
ORACLE LIGHTING OWP-FC-311-LED instructions