Droplet CAS-DPOL User manual

Cloud Aerosol Spectrometer
Depolarization Option
(CAS-DPOL)
Operator Manual
DOC-0167 Revision E-3
2400 Trade Centre Avenue
Longmont, CO 80503 USA
A L L R I G H T S R E S E R V E D

DOC-0167 Rev E-3
© 2018 DROPLET MEASUREMENT TECHNOLOGIES
2
General Information
In no event will Droplet Measurement Technologies, LLC (DMT) be liable for direct, indirect, special,
incidental or consequential damages resulting from any defect or omissions in this manual.
DMT reserves the right to make changes to this manual and the products it describes at any time,
without
notice or obligation. Revised editions are found on the manufacturer’s website.
All DMT product names and the Droplet Measurement Technologies Logo are trademarks of Droplet
Measurement Technologies, LLC.
All other brand and product names are trademarks, or registered trademarks, of their respective owners.
Software License
DMT licenses its software only upon the condition that you accept all of the terms contained in this
license agreement.
This software is provided by DMT “as is” and any express or implied warranties, including, but not
limited to, the implied warranties of merchantability and fitness for a particular purpose are disclaimed.
Under no circumstances and under no legal theory, whether in tort, contract, or otherwise, shall DMT or
its developers be liable for any direct, indirect, incidental, special, exemplary, or consequential damages
(including damages for work stoppage; computer failure or malfunction; loss of goodwill; loss of use,
data or profits; or for any and all other damages and losses). Some states do not allow the limitation or
exclusion of implied warranties and you may be entitled to additional rights in thosestates.
Warranty
The seller warrants that the equipment supplied will be free from defects in material and workmanship
for a period of eighteen months from date of shipment or 12 months from the date of either installation
or first use whichever comes first. When returning the equipment to DMT for warranty or service
procedures, the equipment owner will pay for shipping to DMT, while DMT will pay the return shipping
expense. Consumable components, such as tubing, filters, pump diaphragms, and Nafion humidifiers
and dehumidifiers are not covered by this warranty.

Cloud Aerosol Spectrometer-Depolarization Option (CAS-DPOL) Manual
DOC-0167 Rev E-3 3
© 2018 DROPLET MEASUREMENT TECHNOLOGIES
C O N T E N T S
Software License............................................................................................................. 2
Warranty........................................................................................................................ 2
Overview........................................................................................................................ 5
Theory and Implementation ........................................................................................... 5
1.1 CAS Design.............................................................................................................................5
1.2 Early Evolution of the Instrument .........................................................................................7
1.3 Addition of Polarization Feature ...........................................................................................9
Calibration.................................................................................................................... 12
Processing and Analyzing the Particle by Particle Information ....................................... 15
1.4 Derivation of Refractive Index.............................................................................................15
1.5 Derivation of Asphericity.....................................................................................................19
Appendix A: References................................................................................................ 23
Appendix B: Revisions to Manual.................................................................................. 24
Appendix C: DMT Instrument Locator—Operator Guide ................................................ 25
Purpose............................................................................................................................................25
Installation.......................................................................................................................................25
Operation.........................................................................................................................................25

DOC-0167 Rev E-3
© 2018 DROPLET MEASUREMENT TECHNOLOGIES
4
T a b l e o f F i g u r e s
Figure 1: The Primary Components of the CAS Optical Block ........................................... 6
Figure 2: The Theoretical Relationship between a Spherical Particle's Scattering Cross-
Section and its Size, Refractive Index and Scattering Angle.............................................. 7
Figure 3: Scattering Cross-Sections as a Function of Diameter and Refractive Index......... 8
Figure 4: The Ratio of Forward to Backscattering for the CAS as a Function of Refractive
Index (for Spherical Particles) or of the Aspect Ratio ....................................................... 9
Figure 5: Theoretical Estimates of Light Scattering and Depolarization for Various Ice
Crystal Habits ................................................................................................................10
Figure 6: Theoretical Forward-to-Depolarized-Backscatter Ratios for the Configuration of
the CAS .........................................................................................................................11
Figure 7: Primary Components of the CAS-DPOL’s Optical Block.....................................11
Figure 8: Theoretical Cross-Sections as a Function of Size for the Refractive Indices of
Water and Glass Calibration Beads ................................................................................13
Figure 9: Representative Frequency Distributions for Calibration of the CAS-DPOL
Detectors with 15-μm Glass Beads.................................................................................14
Figure 10: Forward and Backscattering Cross-Sections as a Function of Refractive Index.16
Figure 11: Instrument Locator........................................................................................26

Cloud Aerosol Spectrometer-Depolarization Option (CAS-DPOL) Manual
DOC-0167 Rev E-3 5
© 2018 DROPLET MEASUREMENT TECHNOLOGIES
Overview
The depolarization version of the cloud aerosol spectrometer (CAS-DPOL) is a third-generation
instrument. The first-generation multi-angle aerosol spectrometer (MASP) was developed in 1992
(Baumgardner, 1996), and was followed by the second-generation cloud aerosol spectrometer
(CAS) that is part of the cloud aerosol and precipitation spectrometer (CAPS) developed in 2000
(Baumgardner et al., 2001). The primary difference between the CAS-DPOL and the CAS is the
addition of a method to measure the amount of depolarization caused by aspherical particles so
that the instrument can more sharply differentiate water from ice in clouds or dust and biological
particles from other aerosol particles.
The following sections summarize the theoretical underpinnings of the CAS-DPOL design and then
describe how they are implemented in the optical configuration. The methodology of calibrating
the CAS-DPOL follows in section 3.0 and then examples are discussed to show how the
measurements can be evaluated to estimate the asphericity.
Theory and Implementation
1.1 CAS Design
The CAS was originally developed as an instrument for airborne studies of aerosol and cloud
particle properties (Baumgardner et al., 2001). It uses the measurement of light scattered from
individual particles to derive the diameter assuming sphericity. Mie scattering theory is applied
with the additional assumption of particle refractive index and known wavelength of the incident
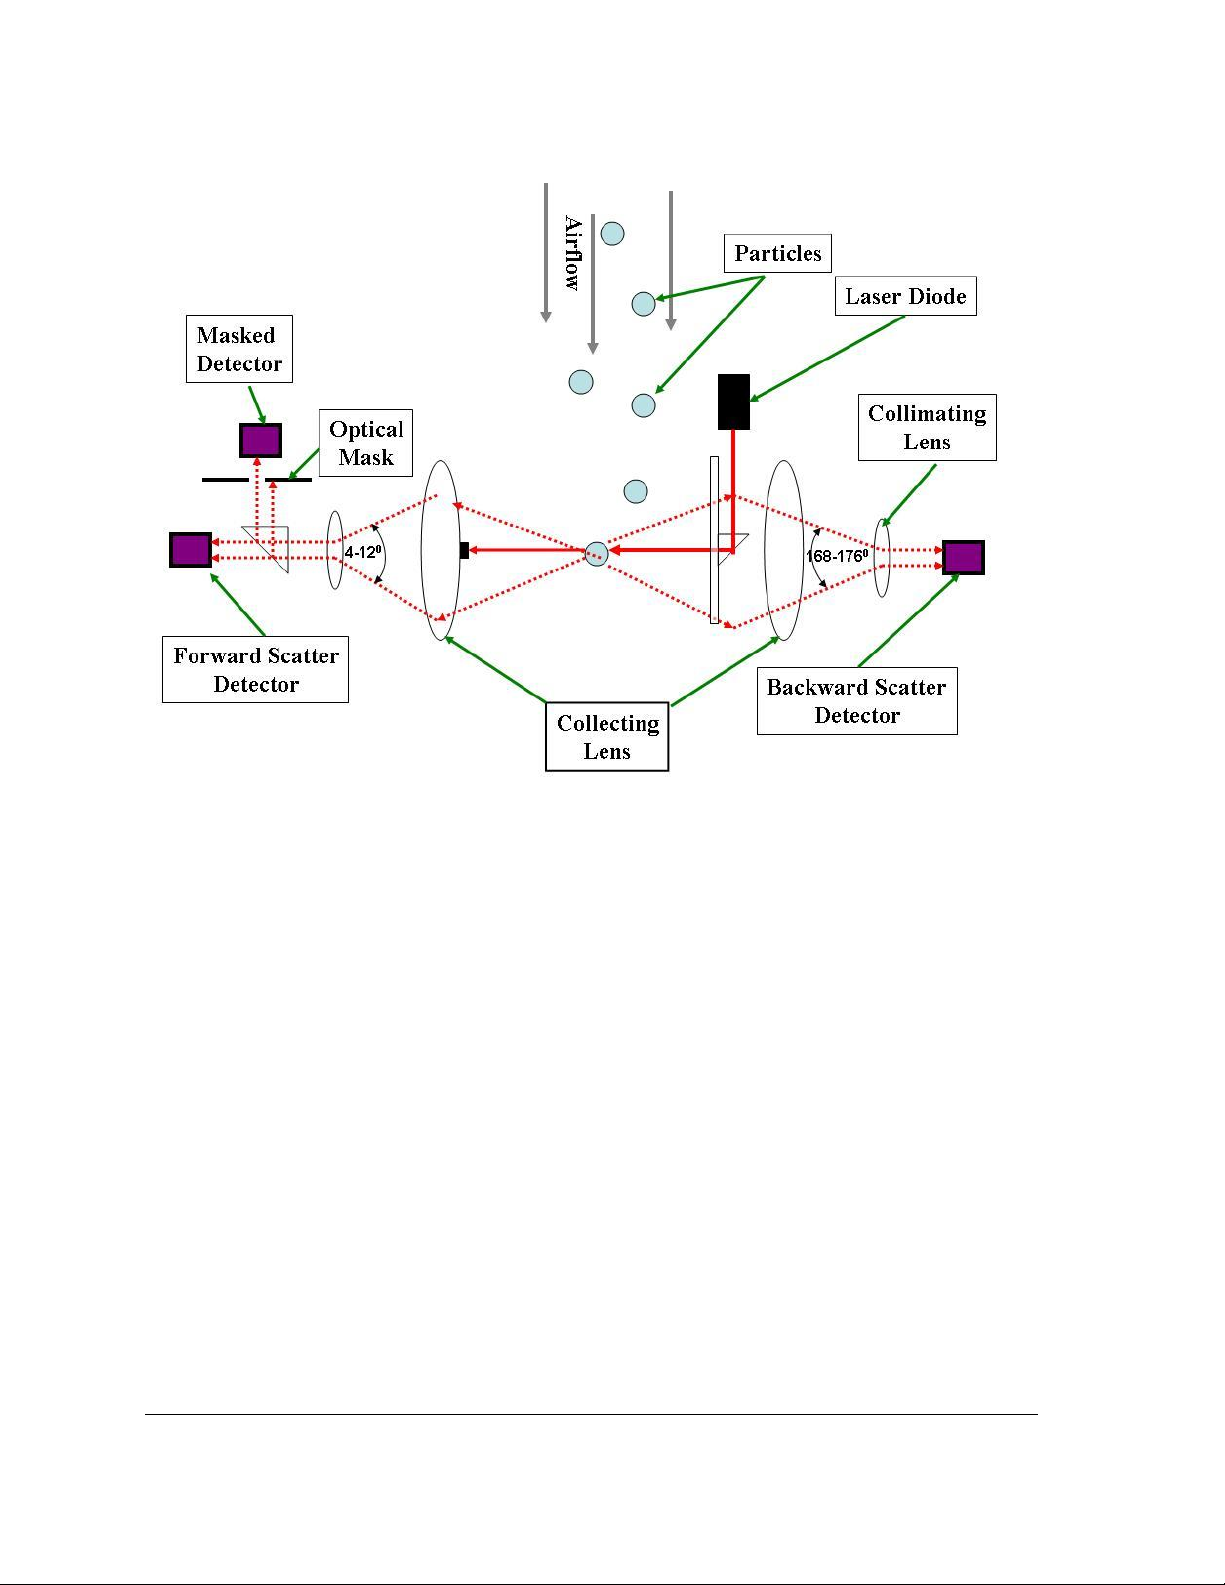
light—in this case, that of the laser used to illuminate the particles. The scattered light in forward
and backward cones of 4 to 12º and 168 to 176º, respectively, is collected by the optical system as
shown in Fig. 1.
The light scattered in the forward direction is measured by two detectors, one with an optical mask
that restricts scattered light from particles that are farther than 0.75 mm either side of the center
of focus (COF) and one that will see light scattered from particles in all parts of the beam. A masked
detector, called the qualifier, is used to qualify particles in the Depth-of-field (DOF), where the DOF
is the region ± 0.55 mm either side of the COF. The detector without the mask, the sizer, generates
a signal that is compared to the qualifier and particles are only accepted when the qualifying signal
is larger than the sizer. Note that the beam splitter that divides the scattered light and delivers it to
the qualifier and sizer is 70/30; this means 70% is delivered to the qualifier, and 30% to the sizer.
This is done to ensure a sharp cut-off for particles outside the DOF.

DOC-0167 Rev E-3
© 2018 DROPLET MEASUREMENT TECHNOLOGIES
6
The signals from the detectors are digitized at a sample rate of 20 MHz. If the qualifier signal
exceeds the forward signal, the peak amplitude is recorded from the forward and back detectors.
The peak amplitudes are serially stored on a particle by particle (PBP) basis in a buffer, along with
the measured inter-arrival time (IAT), i.e. the time period that has elapsed between the current and
previous particle. This IAT is recorded in milliseconds.
The peak amplitudes are also used to increment one of the 30 channels of a frequency distribution.
The 3072 possible A/D counts are distributed among the 30 channels using a lookup table. The
lower and upper threshold of each channel represents a particular size range that is predetermined
by calibration (see section 3.0). Each particle event counts as a single increment in one of the 30
channels of the three detectors such that each sampling interval, there will be three histograms of
30 channels each that contain the sum of all particles detected during that interval. These
histograms are sent to the PADS data system at the end of the sampling interval.
The forward-sizing signal is used to derive the diameter of the particles as determined from Mie
theory (see section 3.0). The signal from the back detector is used to derive information about the
particle’s shape or refractive index. This is based on the fact the angular pattern of light from a
particle is a function of the wavelength of light, diameter, shape and refractive index. Figure 2
illustrates this for two sizes and two refractive indices.
Figure 1: The Primary Components of the CAS Optical Block

Cloud Aerosol Spectrometer-Depolarization Option (CAS-DPOL) Manual
DOC-0167 Rev E-3 7
© 2018 DROPLET MEASUREMENT TECHNOLOGIES
1.2 Early Evolution of the Instrument
The relationship between a particle’s light pattern, diameter, shape and refractive index was first
utilized in an airborne instrument with the multiangle aerosol spectrometer (MASP) that was
designed to measure aerosol particles in the stratosphere and derive their composition from
estimates of the refractive index (Baumgardner et al., 1996). The MASP collected light from the
angles of 30-50º and 120-150º. The ratio of signals from the forward and back detectors changes as
a function of the refractive index, a relationship that was used to show how the mixture of sulfuric
acid and water changed as a function of latitude in the stratosphere from meridional
measurements with the MASP mounted on the NASA R-2 (Baumgardner et al., 1996). These
evaluations, which use Mie theory, require that the particles are spherical.
The design of the CAS follows a similar concept but maintains the forward-scattering angles that
were used in the Forward Scattering Spectrometer Probe (FSSP-100), an instrument that has been
the workhorse for cloud physics measurements since the early 1970’s (Knollenberg, 1981) so that
cloud measurements with the CAS could be directly compared with earlier measurements. This
required a different geometry than the MASP and led to engineering that put the backscattering
detectors in a configuration to measure 168-176º. The refractive index can be derived in a similar
manner as from the MASP, although the relationships are different due to the change in collection
angles. Figure 3 illustrates how the scattering cross-section varies with size and refractive index for
the collection angles of the CAS.
Figure 2: The Theoretical Relationship between a Spherical Particle's Scattering Cross-
Section and its Size, Refractive Index and Scattering Angle

DOC-0167 Rev E-3
© 2018 DROPLET MEASUREMENT TECHNOLOGIES
8
Subsequent to derivation of refractive indices from the evaluation of forward to backward signals,
calculations were carried out using T-matrix theory for light-scattering from aspherical particles. It
was shown that the pattern of scattered light also changes with particle shape and that these
changes are more marked in the backward direction than in the forward. Calculations of this sort
were first carried out to make corrections to the FSSP-300 for measurements in cirrus clouds,
where it was shown that the FSSP-300 (a 0.3-20 μm version of the FSSP-100) under-sizes aspherical
ice particles (Borrmann et al., 2000). The calculations for the CAS showed that the aspect ratio of
particles could also be estimated by comparing the forward to backscattering signal, with the
assumption that the refractive index was known. This was further refined by calculations
specifically for ice crystals habits of different types and applied to measurements made with the
CAS and CIP (i.e. the CAPS) during the CRYSTAL-FACE program (Baumgardner et al., 2005; Chepfer
et al., 2005).
Figure 4 shows an example of how the signals from the forward and back detectors can be used to
estimate either refractive index, assuming the particles are spherical, or aspect ratio, assuming the
particles have the refractive index of ice. In this example the particle has an effective diameter of 5
μm. The region marked with the dashed square is where the ratio of forward to back is ambiguous
and cannot be used to determine the refractive index or the aspect ratio. For the example of 5 μm
particles, forward to back ratios less than 60 are only for spherical particles and greater than 80 are
only for aspherical ice particle.
Figure 3: Scattering Cross-Sections as a Function of Diameter and Refractive Index
0.1 1 10
Particle Diameter (
m)
1E-012
1E-011
1E-010
1E-009
1E-008
1E-007
1E-006
Scattering Cross Section (cm
2
)
n = 1.33 : Forward Scatter
n = 1.33 : Backward Scatter
n = 1.44 : Forward Scatter
n = 1.44 : Backward Scatter

Cloud Aerosol Spectrometer-Depolarization Option (CAS-DPOL) Manual
DOC-0167 Rev E-3 9
© 2018 DROPLET MEASUREMENT TECHNOLOGIES
1.3 Addition of Polarization Feature
Whereas the forward to backscattering has now been established as useful for both refractive index
and shape determination, it is somewhat limited in the number of sizes where unique information
can be extracted. As a result, the addition of a polarization detector was researched. This concept
was based upon the technique used by the lidar community to use polarization to differentiate
spherical from non-spherical particles, particularly in cirrus and in the polar regions to measure
polar stratospheric cloud properties where polarization has been used to distinguish particles of
nitric acid trihydrate (NAT) from ternary mixtures of water, sulfuric acid and nitric acid (Brooks et
al., 2004). Professor Yang Ping (personal communication) and his doctoral student Qian Feng
calculated phase functions for a variety of ice crystal habits. These phase functions included the
polarization components and, as shown in Figure 5, the theory showed that scattering angles
greater than 90º show the greatest sensitivity to depolarization of various crystal habits. The
P22/P11 ratio is a measure of the degree with which incident, polarized light is rotated by an ice
crystal. All ice crystals have their maximum degree of depolarization between 140 and 160º,
although there is more than a factor of three depolarization at the angles where the CAS measures
in the backward direction.
Figure 4: The Ratio of Forward to Backscattering for the CAS as a Function of
Refractive Index (for Spherical Particles) or of the Aspect Ratio

DOC-0167 Rev E-3
© 2018 DROPLET MEASUREMENT TECHNOLOGIES
10
The theoretical results were then applied to the optical design of the CAS to see what the
forward to backward scattering ratio would be if the backscatter detector were used to measure
the amount of depolarization. Figure 6 illustrates the optimum ratio that could be measured for
various crystal types as a function of effective diameter.
From theoretical considerations it appeared that it was practical to implement a polarization
technique within the same optical bench of the CAS. This was done as shown schematically in
Figure 7.
The new design adds a detector and a beam splitter in the backscattering optical path and a
polarization filter, rotated 90º from the polarization of the laser, is placed in front of the second
backscattering detector.
Figure 5: Theoretical Estimates of Light Scattering and Depolarization for Various Ice Crystal Habits
040 80 120 160
Angle
2
4
6
8
10
P22/P11
Size (
m)
5
20
30
40
50
Rosette - 4 bullets
040 80 120 160
Angle
2
4
6
8
10
Rosette - 6 bullets
040 80 120 160
Angle
2
4
6
8
10
Rosette - 6 rough bullets
040 80 120 160
Angle
2
4
6
8
10
P22/P11
Plate
040 80 120 160
Angle
2
4
6
8
10
Rosette - 6 bullets
040 80 120 160
Angle
2
4
6
8
10
Very rough aggregates

Cloud Aerosol Spectrometer-Depolarization Option (CAS-DPOL) Manual
DOC-0167 Rev E-3 11
© 2018 DROPLET MEASUREMENT TECHNOLOGIES
Figure 6: Theoretical Forward-to-Depolarized-Backscatter Ratios for the
Configuration of the CAS
010 20 30 40 50 60
Maximimum Length (
m)
0
1000
2000
3000
4000
5000
Forward to Backscatter Ratio
Cloud Particle Type
Bullet Rosette (4)
Bullet Rosette (6)
Rough Bullet Rosette (6)
Plate
Solid
Very rough aggregate
Figure 7: Primary Components of the CAS-DPOL’s Optical Block

DOC-0167 Rev E-3
© 2018 DROPLET MEASUREMENT TECHNOLOGIES
12
As in the regular CAS, all signals, forward sizer and both regular and polarized backscatter signals
are qualified by the forward scattering masked detector. Also, as in the regular CAS, due to the
wide range of scattering signals over the nominal size range of the CAS and CAS-DPOL, the
conditioning and digitization of the detector signals requires three stages of amplification,
designated high, medium and low. The peak signals from each of the gain stages from each of the
detectors, as the particle passes through the beam, is digitized by a 10-bit analog to digital
converter (A/D) so that the number of counts possible from each detector is 0-3072. However, as
explained in the next section, because of the three gains, the scale factor between counts and
scattering intensity varies from stage to stage, i.e. the high gain stage with counts from 0-1024 has
a different conversion factor than the second gain stage with counts from 1025-2048. This is
explained in more detail below.
Calibration
Since it is the scattered light that is being measured, we need a way to relate this to the particle
size. We first assume that the particle is spherical and then select the particle refractive index, the
intensity and wavelength of the illumination, the angles over which the light is collected, the
efficiency of the detector, and the electronic gain. With this information we can use Mie scattering
theory to calculate the relationship between pulse height measured and particle size. We don’t
precisely know the illumination and detector efficiency, so an empirical calibration is required to
assign sizes to the pulse height that is measured.
With calibration particles whose size we can strictly control, we sample these particles with the CAS
and get a relationship between particle size and peak signal voltage. For example, commercially
available glass beads, with well controlled sizes, are the normal calibration particle used. In
principle, we should be able to select a range of glass bead sizes, convert them to their water (or
ice) equivalent size (glass and water scatter light differently, so we have to know what size water
particle will scatter the same amount of light as a particular glass bead size), and perform the size
calibration as described above.
Two issues complicate this concept. One, the amount of scattered light is dependent on the index
of refraction of the particles, as well as their size. Two, in certain size ranges the scattered light
does not increase monotonically with size. Figure 8 illustrates these two points.

Cloud Aerosol Spectrometer-Depolarization Option (CAS-DPOL) Manual
DOC-0167 Rev E-3 13
© 2018 DROPLET MEASUREMENT TECHNOLOGIES
In this figure, we see that glass particles (refractive index n = 1.51) in the size range shown scatter
less light than water droplets (n = 1.33). Secondly, it can be seen that at some sizes, larger particles
scatter less light than smaller particles. This complication leads to a big problem in trying to use
glass beads as a surrogate for water. In Fig. 8, a commercially available glass bead with a size of
20.6 m has a scattering cross-section of approximately 5x10⁻⁷ cm-2 for the incident light
wavelength of the CAS and scattering angles. We can see that several sizes of water droplets
scatter the same amount of light, i.e. 16.5, 17, and 18 m water droplets have approximately the
same scattering cross-sections (the intersection points of horizontal blue line). In addition, the sizes
of the calibration beads are only controlled to approximately ±1% and inhomogeneities in the
intensity of the laser beam add to the uncertainty in measured light, so a conversion to water
equivalency could produce a range of possible water droplet sizes from approximately 15 - 19 m.
If we believe the Mie scattering theory, and we do since it has been verified experimentally in many
laboratory studies, we can convert the signal voltage of the CAS with only a single point
measurement. The procedure is as follows:
Step 1 Select a glass bead particle, D0, whose size is approximately in the midsize range of the
instrument.
Figure 8: Theoretical Cross-Sections as a Function of Size for the Refractive Indices of
Water and Glass Calibration Beads

DOC-0167 Rev E-3
© 2018 DROPLET MEASUREMENT TECHNOLOGIES
14
Step 2 Sample these beads until a statistically reasonable number of particles have been
counted and a well-defined peak is seen in a frequency histogram as illustrated in
Figure 9 using 15 μm glass beads.
Step 3 Convert the average channel number, where the peak counts occur, into a A/D counts,
C0. In figure 9, these are 170, 1200 and 2080, respectively for the backscatter polarized,
backscatter non-polarized and forward scatter detectors
Step 4 In the Mie scattering lookup table, find the scattering cross section, I0(Fig. 8) of the D0
calibration particle.
Step 5 Calculate the scale factor, SF, that relates scattering cross section to A/D, i.e. SF = I0/C0.
Step 7 Convert this scale factor to the other gain stages using the ratio of gains between the
gain stage of the calibration and the other two stages.
Step 8 Apply these scale factors to the A/D counts from the detectors for each particle
detected to convert to an equivalent scattering cross section that can be used to
calculate size of scattering ratio. For example, for a peak count, C, the equivalent
scattering cross section, I, would be I=C*SF.
Figure 9: Representative Frequency Distributions for Calibration of the
CAS-DPOL Detectors with 15-μm Glass Beads
1800 1850 1900 1950 2000 2050 2100 2150 2200
Forward Scattering Counts
0
0.1
0.2
0.3
0.4
Frequency
1000 1050 1100 1150 1200 1250 1300 1350 1400 1450 1500
Backward-NonPol Scattering Counts
0
0.02
0.04
0.06
0.08
0.1
Frequency
50 100 150 200 250 300 350 400 450 500 550 600
Backward Scattering Polarized Counts
0
0.02
0.04
0.06
0.08
Frequency
15
m glass beads

Cloud Aerosol Spectrometer-Depolarization Option (CAS-DPOL) Manual
DOC-0167 Rev E-3 15
© 2018 DROPLET MEASUREMENT TECHNOLOGIES
Processing and Analyzing the Particle by Particle Information
1.4 Derivation of Refractive Index
The refractive index is derived using a look-up table that has the theoretical values for the forward
and backward scattering cross sections as a function of refractive index. As shown for three
refractive indices, in Fig. 10, there are various pairs of forward and backscattering cross sections
that are unique to specific refractive indices. Table I also lists these pairs as a function of particle
diameter and refractive index. In the PBP file for the forward and non-polarized scattering data, the
information is listed as counts. These data must be converted to equivalent scattering cross section
values as discussed in the section of this manual on calibration (section 3).
The approach to deriving refractive indices is to first convert the particle’s forward and
backscattering counts into the corresponding scattering cross sections. The second step is to search
the table for all occurrences of the forward scattering value. Since an exact match will not
necessarily be found, a range of values around the measured value can be prescribed that is plus
and minus some percentage of the measured value. For each of the forward scattering values
found in the table, compare the corresponding backscatter values with the one measured. Again, a
plus or minus range should be prescribed prior to the search. When a pair of forward and backward
scattering cross sections is found that match those measured within the specified error for
acceptance, this will indicate the refractive index for that particle.
In many cases, there may not be a unique answer, i.e., as seen in Figure 10, there are overlapping
regions in the graph where particles with different refractive indices will have similar forward to
backward relationships. In those cases where more than one match is found, the investigator can
choose to throw his information out or keep all the matches but in a separate analysis category that
indicates the possibility of more than a single refractive index. If the particle population is assumed
to be composed of approximately the same composition, then for an ensemble of particles of many
sizes, those sizes that have a unique forward to backward relationship will help decide the correct
refractive index for those particles whose size is associated with more than one forward to
backward scattering pair.
Note that the refractive index can be derived only if the particles are assumed spherical. In
addition, the Mie scattering tables that have been supplied with this manual for forward and
backward scattering cross sections as a function of refractive index do not take into account any
light absorption by the particles, i.e. the complex refractive indices only include the real
component. Tables can also be calculated to include imaginary components, but this increases the
complexity of the analysis as well as the resulting uncertainty.

DOC-0167 Rev E-3
© 2018 DROPLET MEASUREMENT TECHNOLOGIES
16
Table I: Sample Table of Scattering Cross Sections
Size
(um)
fwdrf1.3
3
bckrf1.3
3
fwdrf1.4
0
bckrf1.4
0
fwdrf1.5
1
bckrf1.5
1
fwdrf1.6
0
bckrf1.6
0
0.3
8.96E-12
7.40E-
13
1.35E-11
9.50E-
13
2.31E-11
1.15E-
12
3.38E-11
1.10E-
12
0.5
1.93E-10
5.69E-
12
2.76E-10
8.11E-
12
4.37E-10
9.49E-
12
6.13E-10
8.22E-
12
1
7.00E-09
3.01E-
11
7.49E-09
2.85E-
11
6.75E-09
1.62E-
10
4.67E-09
3.81E-
10
2.01
1.65E-08
2.24E-
10
9.11E-09
4.02E-
10
3.90E-08
4.72E-
10
2.87E-08
1.23E-
09
3.01
8.07E-08
1.22E-
09
6.16E-08
1.67E-
09
4.24E-08
1.46E-
09
6.20E-08
2.88E-
09
4.01
5.03E-08
2.16E-
09
8.06E-08
1.48E-
09
4.30E-08
4.10E-
09
7.80E-08
5.88E-
09
Figure 10: Forward and Backscattering Cross-Sections as a Function of Refractive
Index
1E-009 1E-008 1E-007 1E-006
Forward Scattering Cross Section (cm
2
)
1E-011
1E-010
1E-009
1E-008
1E-007
Back Scattering Cross Section (cm
2
)
= 1.33
= 1.44
= 1.60

Cloud Aerosol Spectrometer-Depolarization Option (CAS-DPOL) Manual
DOC-0167 Rev E-3 17
© 2018 DROPLET MEASUREMENT TECHNOLOGIES
Size
(um)
fwdrf1.3
3
bckrf1.3
3
fwdrf1.4
0
bckrf1.4
0
fwdrf1.5
1
bckrf1.5
1
fwdrf1.6
0
bckrf1.6
0
0.3
8.96E-12
7.40E-
13
1.35E-11
9.50E-
13
2.31E-11
1.15E-
12
3.38E-11
1.10E-
12
0.5
1.93E-10
5.69E-
12
2.76E-10
8.11E-
12
4.37E-10
9.49E-
12
6.13E-10
8.22E-
12
1
7.00E-09
3.01E-
11
7.49E-09
2.85E-
11
6.75E-09
1.62E-
10
4.67E-09
3.81E-
10
2.01
1.65E-08
2.24E-
10
9.11E-09
4.02E-
10
3.90E-08
4.72E-
10
2.87E-08
1.23E-
09
3.01
8.07E-08
1.22E-
09
6.16E-08
1.67E-
09
4.24E-08
1.46E-
09
6.20E-08
2.88E-
09
4.01
5.03E-08
2.16E-
09
8.06E-08
1.48E-
09
4.30E-08
4.10E-
09
7.80E-08
5.88E-
09
5.01
8.51E-08
2.83E-
09
7.56E-08
2.66E-
09
8.15E-08
4.72E-
09
7.71E-08
1.10E-
08
6.01
1.14E-07
1.89E-
09
8.92E-08
4.66E-
09
8.28E-08
7.24E-
09
6.67E-08
1.44E-
08
7.01
8.88E-08
2.85E-
09
1.01E-07
4.09E-
09
7.12E-08
9.88E-
09
6.90E-08
1.90E-
08
8.01
1.72E-07
3.01E-
09
1.28E-07
4.09E-
09
1.19E-07
9.79E-
09
9.04E-08
2.44E-
08
9.01
1.22E-07
4.83E-
09
1.09E-07
5.66E-
09
1.63E-07
1.58E-
08
1.23E-07
2.18E-
08
10.01
2.55E-07
7.41E-
09
2.12E-07
1.08E-
08
1.93E-07
1.34E-
08
1.51E-07
3.06E-
08
11.01
2.43E-07
4.64E-
09
2.67E-07
7.00E-
09
2.04E-07
1.35E-
08
1.76E-07
3.52E-
08
12.01
3.13E-07
5.05E-
09
2.53E-07
8.66E-
09
2.04E-07
1.88E-
08
2.11E-07
4.02E-
08
14.01
3.91E-07
6.14E-
09
2.93E-07
1.49E-
08
2.97E-07
2.17E-
08
2.53E-07
6.07E-
08
16.01
4.17E-07
8.14E-
09
3.57E-07
9.74E-
09
3.39E-07
3.99E-
08
2.56E-07
8.23E-
08
18.01
5.62E-07
8.46E-
09
4.69E-07
1.90E-
08
4.36E-07
4.12E-
08
3.40E-07
9.44E-
08

DOC-0167 Rev E-3
© 2018 DROPLET MEASUREMENT TECHNOLOGIES
18
Size
(um)
fwdrf1.3
3
bckrf1.3
3
fwdrf1.4
0
bckrf1.4
0
fwdrf1.5
1
bckrf1.5
1
fwdrf1.6
0
bckrf1.6
0
0.3
8.96E-12
7.40E-
13
1.35E-11
9.50E-
13
2.31E-11
1.15E-
12
3.38E-11
1.10E-
12
0.5
1.93E-10
5.69E-
12
2.76E-10
8.11E-
12
4.37E-10
9.49E-
12
6.13E-10
8.22E-
12
1
7.00E-09
3.01E-
11
7.49E-09
2.85E-
11
6.75E-09
1.62E-
10
4.67E-09
3.81E-
10
2.01
1.65E-08
2.24E-
10
9.11E-09
4.02E-
10
3.90E-08
4.72E-
10
2.87E-08
1.23E-
09
3.01
8.07E-08
1.22E-
09
6.16E-08
1.67E-
09
4.24E-08
1.46E-
09
6.20E-08
2.88E-
09
4.01
5.03E-08
2.16E-
09
8.06E-08
1.48E-
09
4.30E-08
4.10E-
09
7.80E-08
5.88E-
09
20.01
6.82E-07
8.95E-
09
6.36E-07
1.79E-
08
4.84E-07
5.27E-
08
4.25E-07
1.08E-
07
22.01
8.46E-07
1.06E-
08
6.39E-07
3.36E-
08
5.81E-07
7.05E-
08
4.92E-07
1.45E-
07
24.01
8.77E-07
9.59E-
09
8.66E-07
2.38E-
08
6.41E-07
8.89E-
08
5.27E-07
1.72E-
07
26.01
1.05E-06
1.22E-
08
8.90E-07
4.32E-
08
7.76E-07
8.56E-
08
5.84E-07
1.88E-
07
28.01
1.18E-06
1.26E-
08
1.01E-06
2.99E-
08
8.47E-07
9.70E-
08
7.32E-07
2.24E-
07
30.01
1.47E-06
1.22E-
08
1.17E-06
5.74E-
08
9.15E-07
1.12E-
07
8.18E-07
2.56E-
07
32.01
1.63E-06
1.76E-
08
1.29E-06
4.22E-
08
1.09E-06
1.19E-
07
8.97E-07
2.88E-
07
34.01
1.85E-06
1.75E-
08
1.53E-06
6.94E-
08
1.18E-06
1.47E-
07
9.93E-07
3.20E-
07
36.01
1.94E-06
2.10E-
08
1.68E-06
5.51E-
08
1.27E-06
1.59E-
07
1.11E-06
3.45E-
07
38.01
2.17E-06
2.83E-
08
1.88E-06
6.10E-
08
1.38E-06
1.88E-
07
1.25E-06
3.85E-
07
40.01
2.36E-06
2.70E-
08
1.97E-06
6.76E-
08
1.65E-06
1.93E-
07
1.34E-06
4.33E-
07

Cloud Aerosol Spectrometer-Depolarization Option (CAS-DPOL) Manual
DOC-0167 Rev E-3 19
© 2018 DROPLET MEASUREMENT TECHNOLOGIES
Size
(um)
fwdrf1.3
3
bckrf1.3
3
fwdrf1.4
0
bckrf1.4
0
fwdrf1.5
1
bckrf1.5
1
fwdrf1.6
0
bckrf1.6
0
0.3
8.96E-12
7.40E-
13
1.35E-11
9.50E-
13
2.31E-11
1.15E-
12
3.38E-11
1.10E-
12
0.5
1.93E-10
5.69E-
12
2.76E-10
8.11E-
12
4.37E-10
9.49E-
12
6.13E-10
8.22E-
12
1
7.00E-09
3.01E-
11
7.49E-09
2.85E-
11
6.75E-09
1.62E-
10
4.67E-09
3.81E-
10
2.01
1.65E-08
2.24E-
10
9.11E-09
4.02E-
10
3.90E-08
4.72E-
10
2.87E-08
1.23E-
09
3.01
8.07E-08
1.22E-
09
6.16E-08
1.67E-
09
4.24E-08
1.46E-
09
6.20E-08
2.88E-
09
4.01
5.03E-08
2.16E-
09
8.06E-08
1.48E-
09
4.30E-08
4.10E-
09
7.80E-08
5.88E-
09
42.01
2.67E-06
2.99E-
08
2.11E-06
5.94E-
08
1.67E-06
2.40E-
07
1.48E-06
4.75E-
07
44.01
2.89E-06
3.08E-
08
2.38E-06
8.56E-
08
1.79E-06
2.25E-
07
1.58E-06
5.13E-
07
46.01
3.09E-06
4.41E-
08
2.63E-06
6.85E-
08
1.96E-06
2.61E-
07
1.71E-06
5.71E-
07
48.01
3.28E-06
3.12E-
08
2.69E-06
1.31E-
07
2.23E-06
2.94E-
07
1.92E-06
6.11E-
07
50.01
3.61E-06
3.41E-
08
3.16E-06
7.72E-
08
2.30E-06
3.07E-
07
2.04E-06
6.33E-
07
1.5 Derivation of Asphericity
The particle shape is evaluated on a particle by particle basis using the same approach as deriving
refractive index, except in this case the refractive index is assumed constant and the relationship
between the forward to backscatter cross sections changes as a result of shape deviation, i.e.
asphericity. There are two approaches. Both approaches require converting the counts to their
respective scattering cross sections. Similar to the tables for refractive index, a similar table has
been constructed for the relationship between the forward and backscattering as a function of the
aspect ratio, where an aspect ratio of unity designates a sphere, an aspect ratio smaller than one is
an oblate spheroid (disk shaped) and greater than one is a prolate spheroid (football shaped). Table
II shows the ratio of forward to backscattering for particles with radius between 1 –10 μm with the
refractive index of ice (1.31) and a range of aspect ratios.

DOC-0167 Rev E-3
© 2018 DROPLET MEASUREMENT TECHNOLOGIES
20
A slightly different methodology is used than with the estimation of refractive index. First, the
particle effective diameter is calculated from the forward scattering cross section, where the
effective diameter is found by assuming the refractive index of the particle then finding the size in
the Mie lookup table that corresponds to the measured forward scattering signal. Then the ratio is
calculated between the measured forward and backscattering cross sections, after converting the
A/D counts to scattering. The aspect ratio is found from the look up table by going to the column
that represents the size closest to the derived size and finding the ratio closest to the calculated
ratio from the measurements. The value in the first column that is associated with that row will be
the estimated aspect ratio.
An alternative approach is to search the entire table for the forward to back scattering ratios that
most closely match the ratio calculated from the measurements. As seen in the examples in Table
II, there are multiple values that depend on the various pairs of size versus aspect ratio. From all
the matches, the one associated with the particle radius that most closely matches the size derived
from the forward scattering will be used to estimate the aspect ratio.
An empirical approach can also be taken that takes advantage of all three signals, the forward
scattering, non-polarized and polarized backscattering. For every particle, three ratios are
calculated: 1) forward to non-polarized backscatter (F2Bnon), 2) forward to polarized backscatter
(F2Bpol) and 3) nonpolarized to polarized backscatter ratio (noPOL2POL). Given that the prototype
CAS-DPOL generates the two sets of files for the two pairs of forward and back detectors, these two
files need to be merged into a single file before calculating the ratio of nonpolarized to polarized
backscatter.
This latter stratification is done in order to separate out the ambiguities. Figure 11 shows averages
of the three ratios, along with their standard deviations (vertical bars), as a function of the average
forward scattering value for water droplets and quartz and dust particles. From these comparisons,
we can see that there are some particle sizes, represented by the forward scattering value, where
there is a much greater difference between the ratios for the three types of particles than for other
sizes. This figure also shows that the forward scattering values where the greatest separation is
seen as a function of particle type is not the same for each of the three ratios. This means that the
three ratios can be used, in different combinations with respect to the forward scattering values to
differentiate between different shapes.
Table II
Sample Table of Aspect Ratios versus Forward to Backscatter
Particle Radius
Aspect
Ratio
1.0
2.0
3.0
4.0
5.0
6.0
7.0
8.0
9.0
10.0
0.5
307
850
290
506
390
0
0
0
0
0
0.6
338
602
221
462
286
314
352
308
265
204
0.7
310
265
153
303
214
319
256
245
180
164
Table of contents
Other Droplet Measuring Instrument manuals