Furuno CN-24 User manual

COLOR NET RECORDER
CN-24

C
9-52, Ashihara-cho,
Nishinomiya, Japan
Telephone: 0798-65-2111
Telefax: 0798-65-4200
Your Local Agent/Dealer
All ri
g
hts reserved.
PUB. No. SME-13010-A
CN-24
(
MAYA
)
FIRST EDITION : MAY 2001
Printed in Japan

CONTENTS
1.GENERAL.........................................................................................................1-1
1.1 POWER SUPPLY......................................................................................1-1
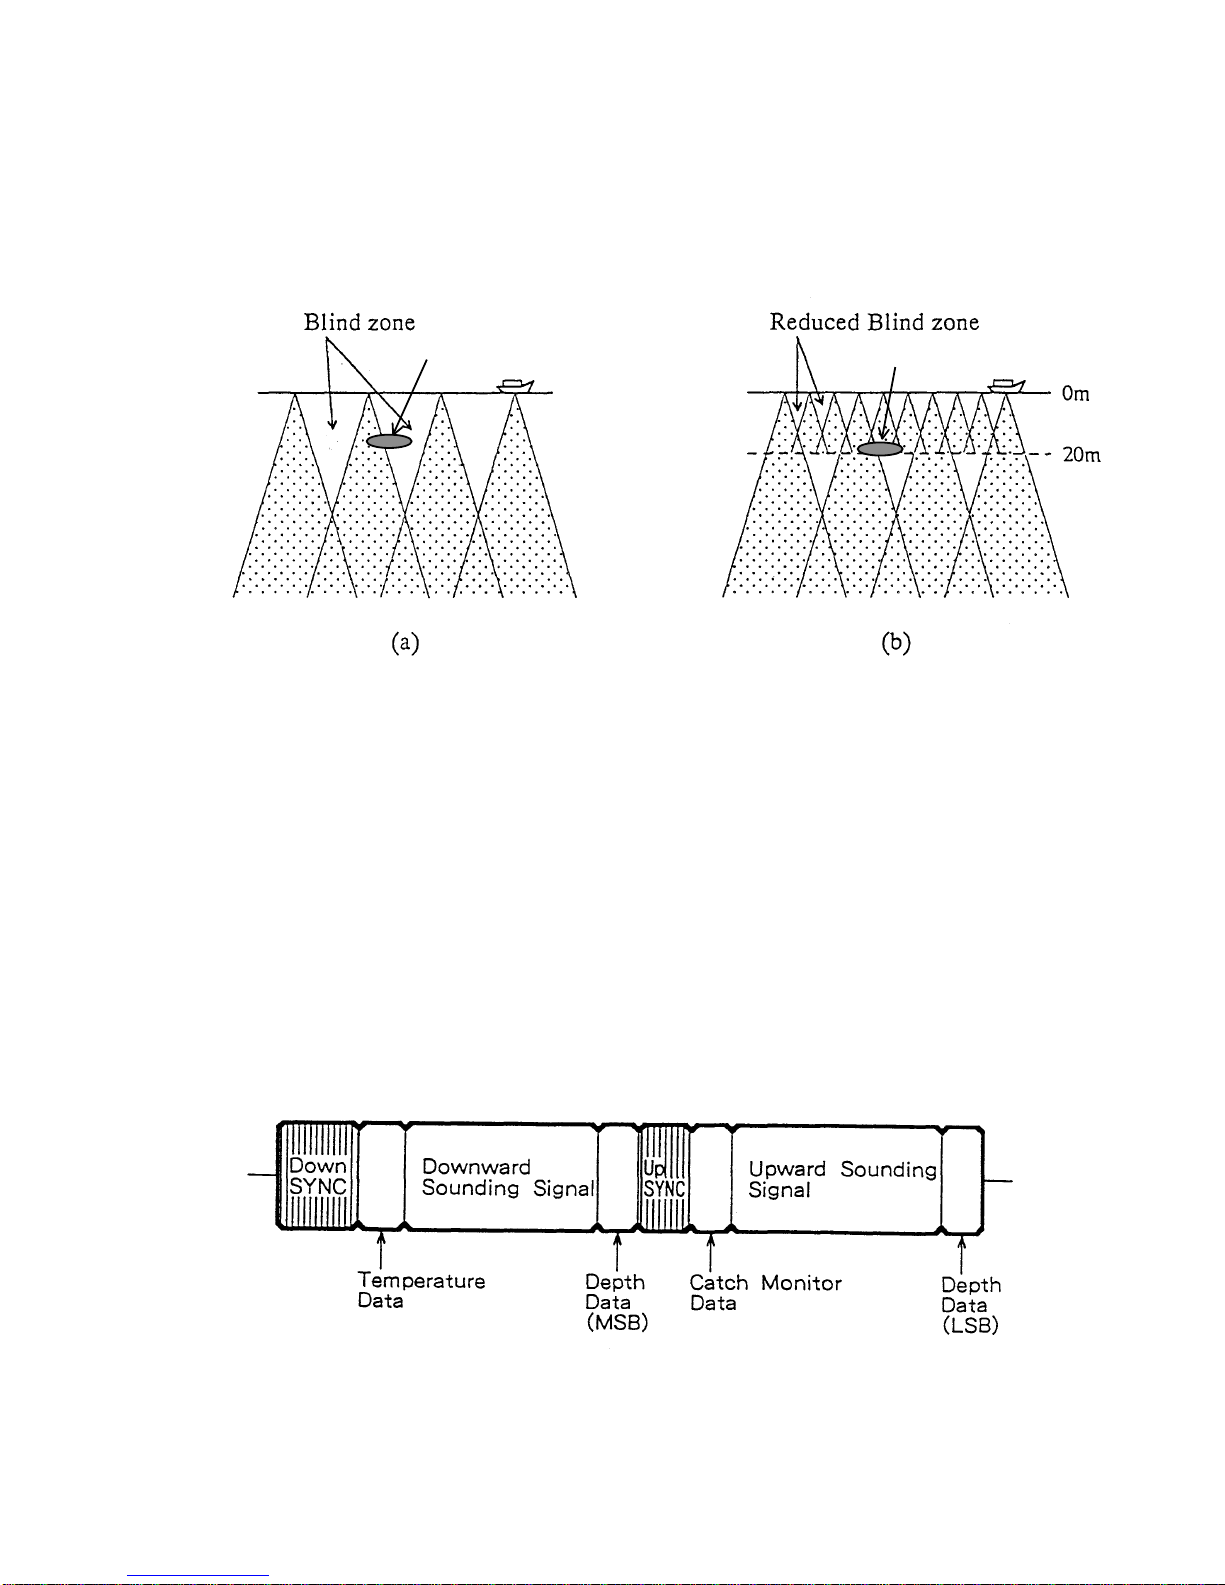
1.2 UPWARD AND DOWNWARD SOUNDING .............................................1-1
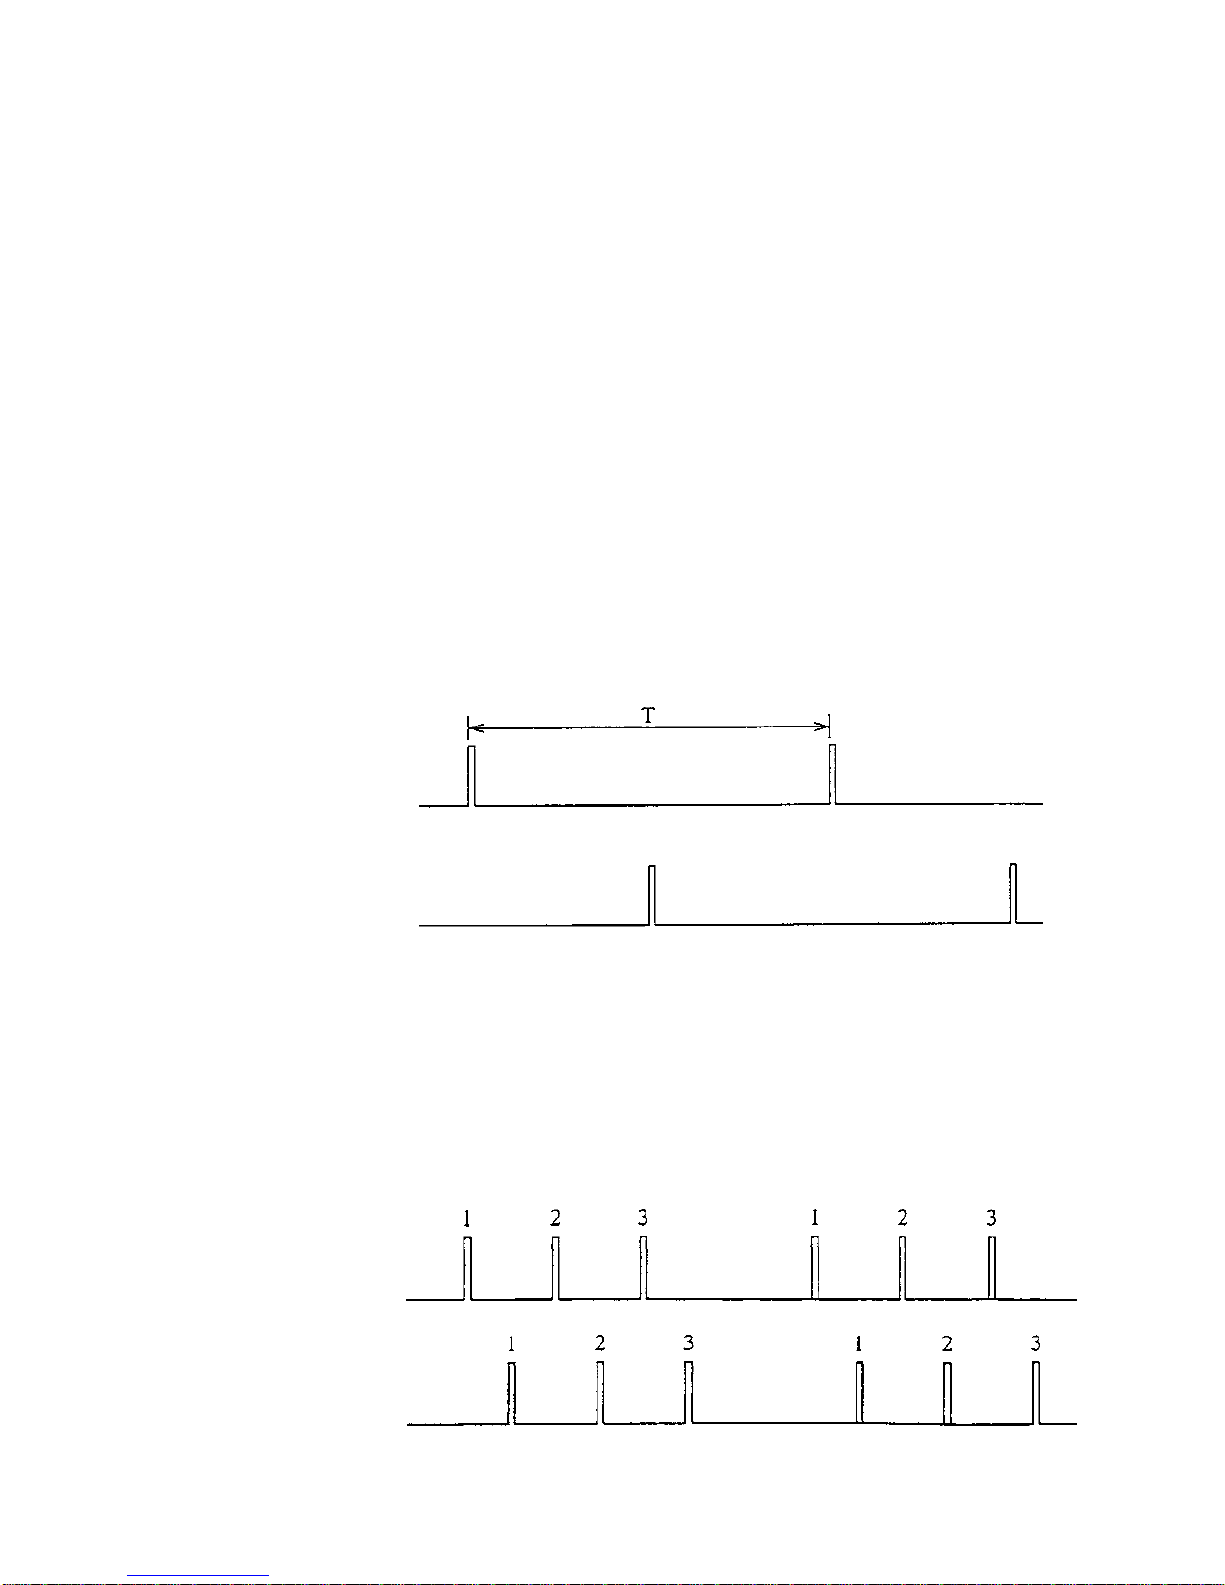
1.2.1 Sounding Rate ................................................................................1-1
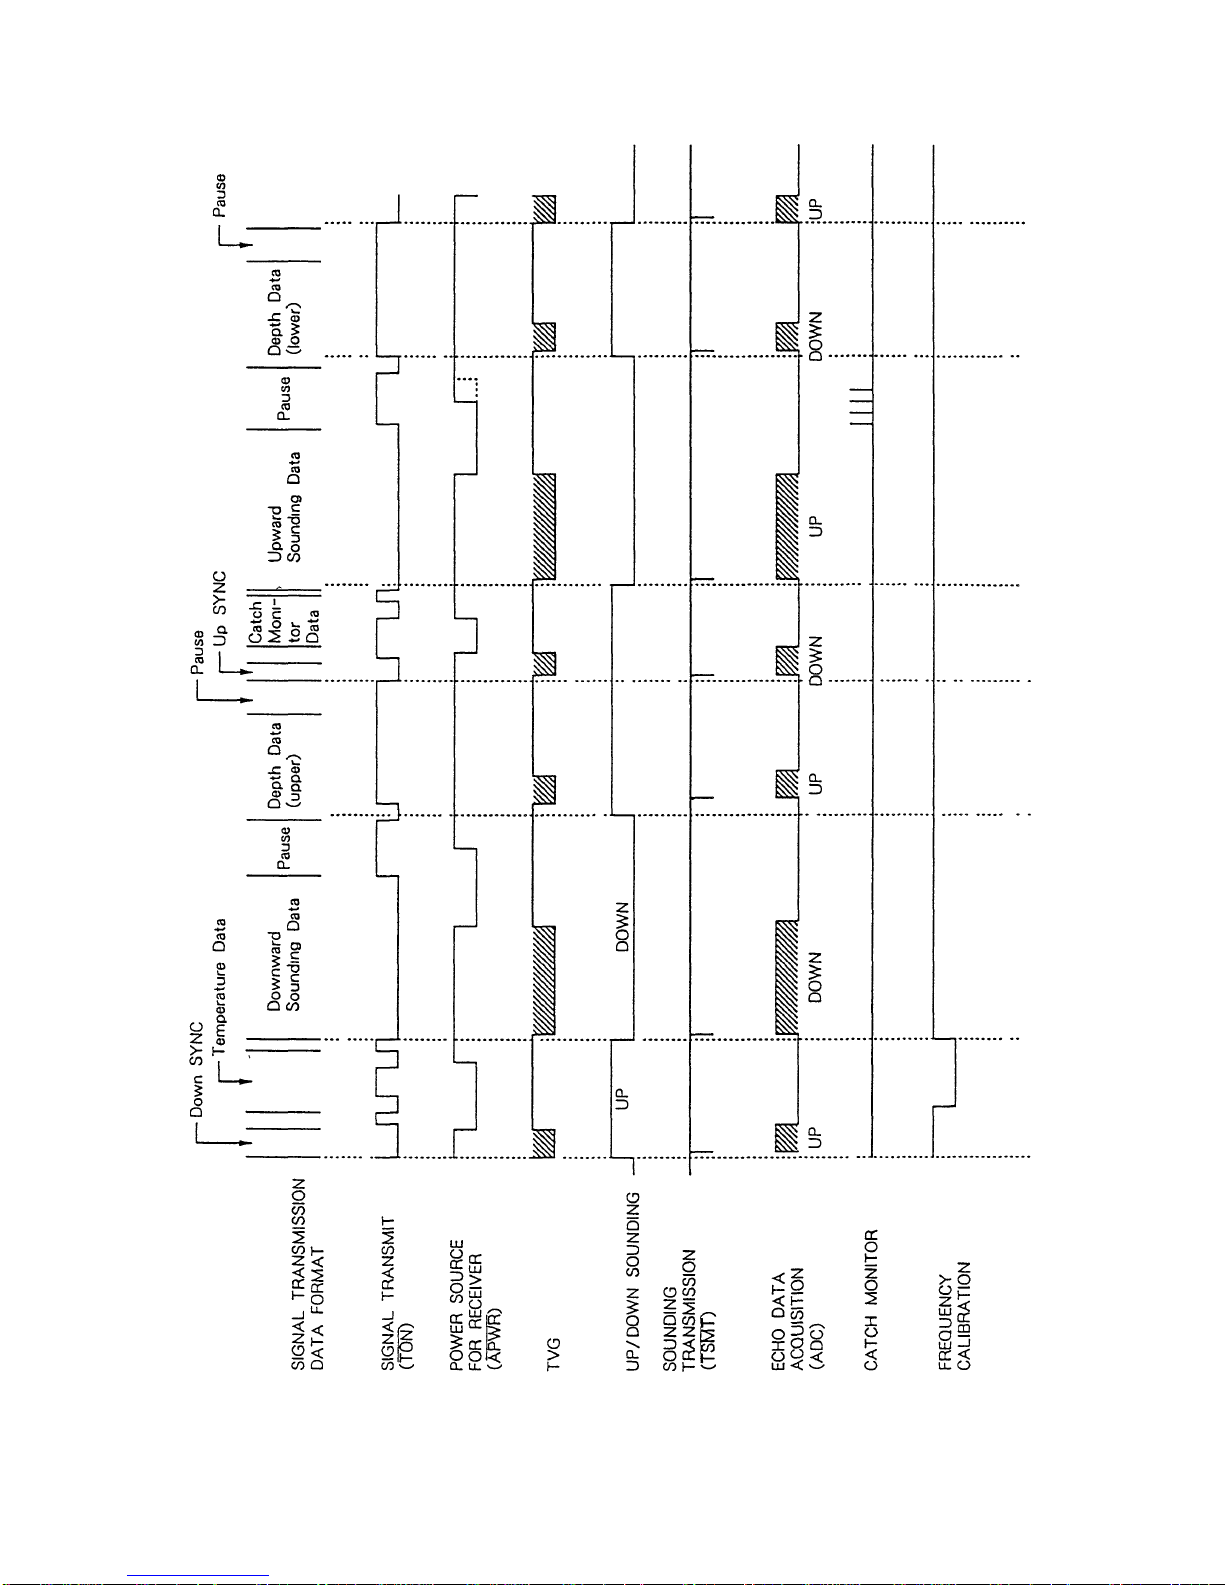
1.3 DATA FORMAT FROM TRANSMITTER UNIT ..........................................1-2
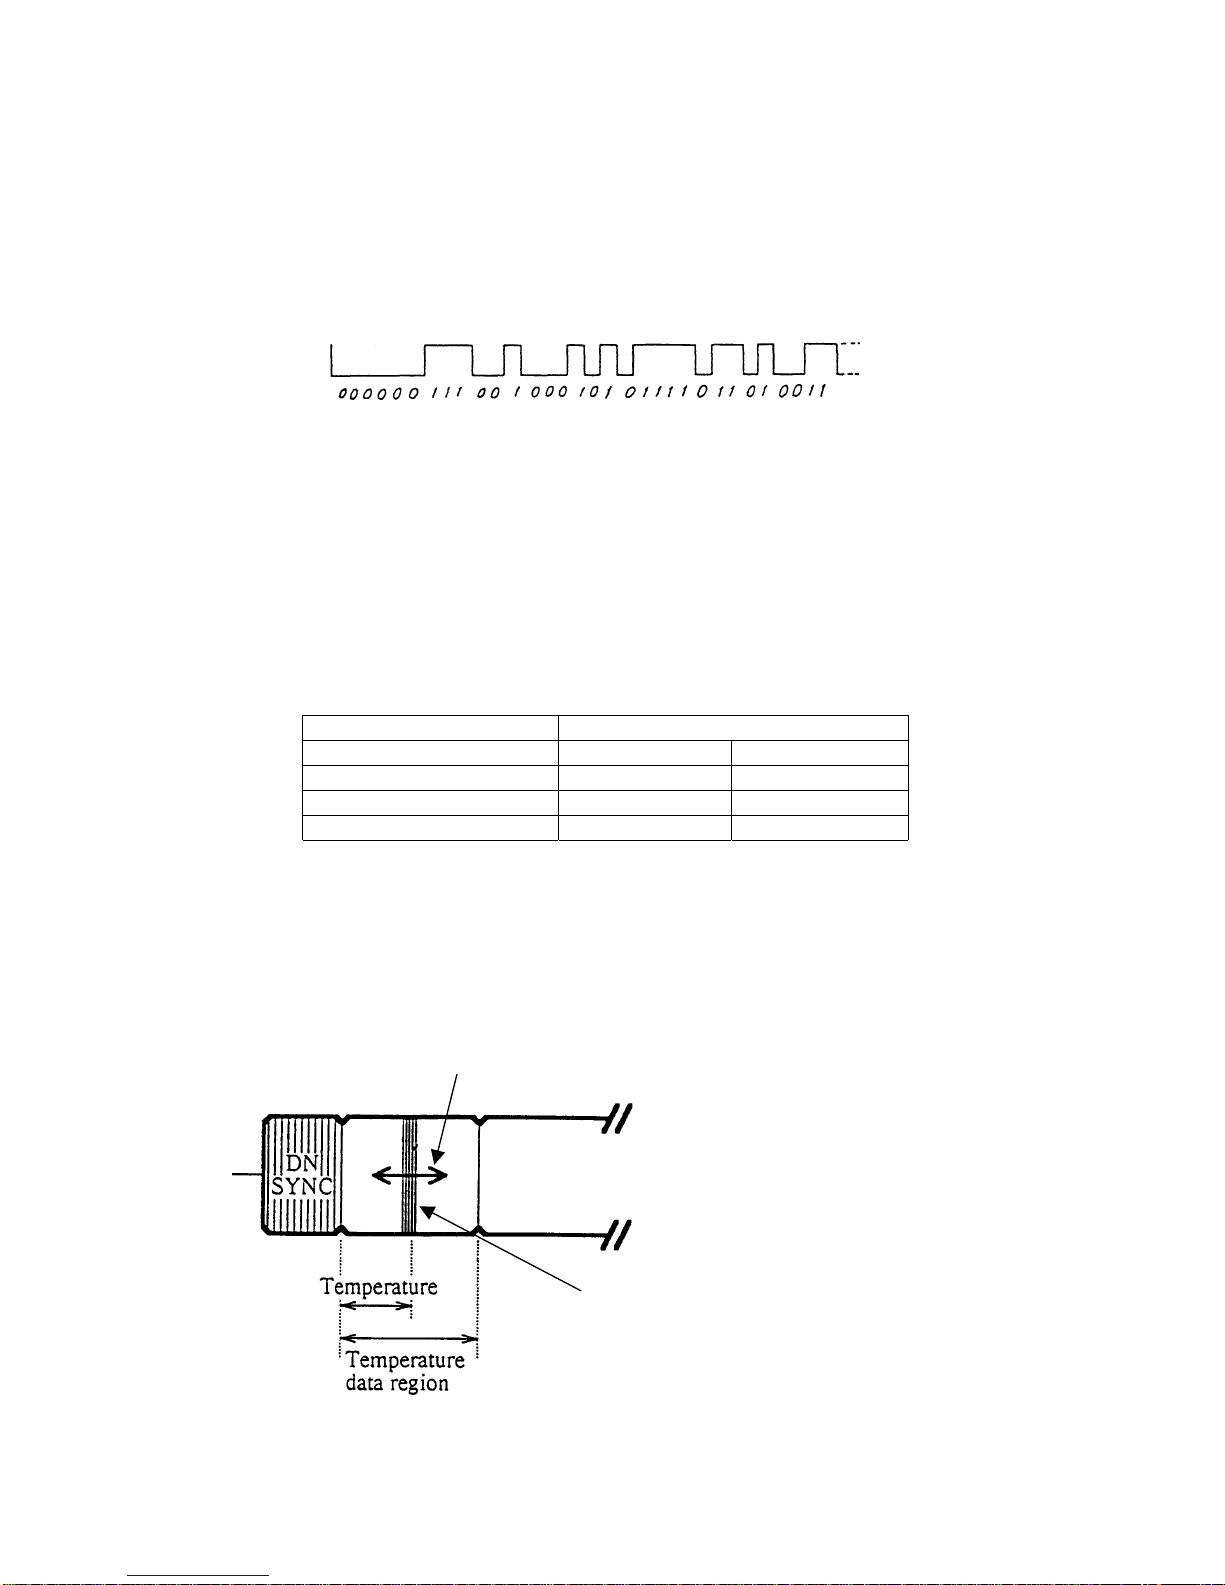
1.3.1 SYNC Code ....................................................................................1-3
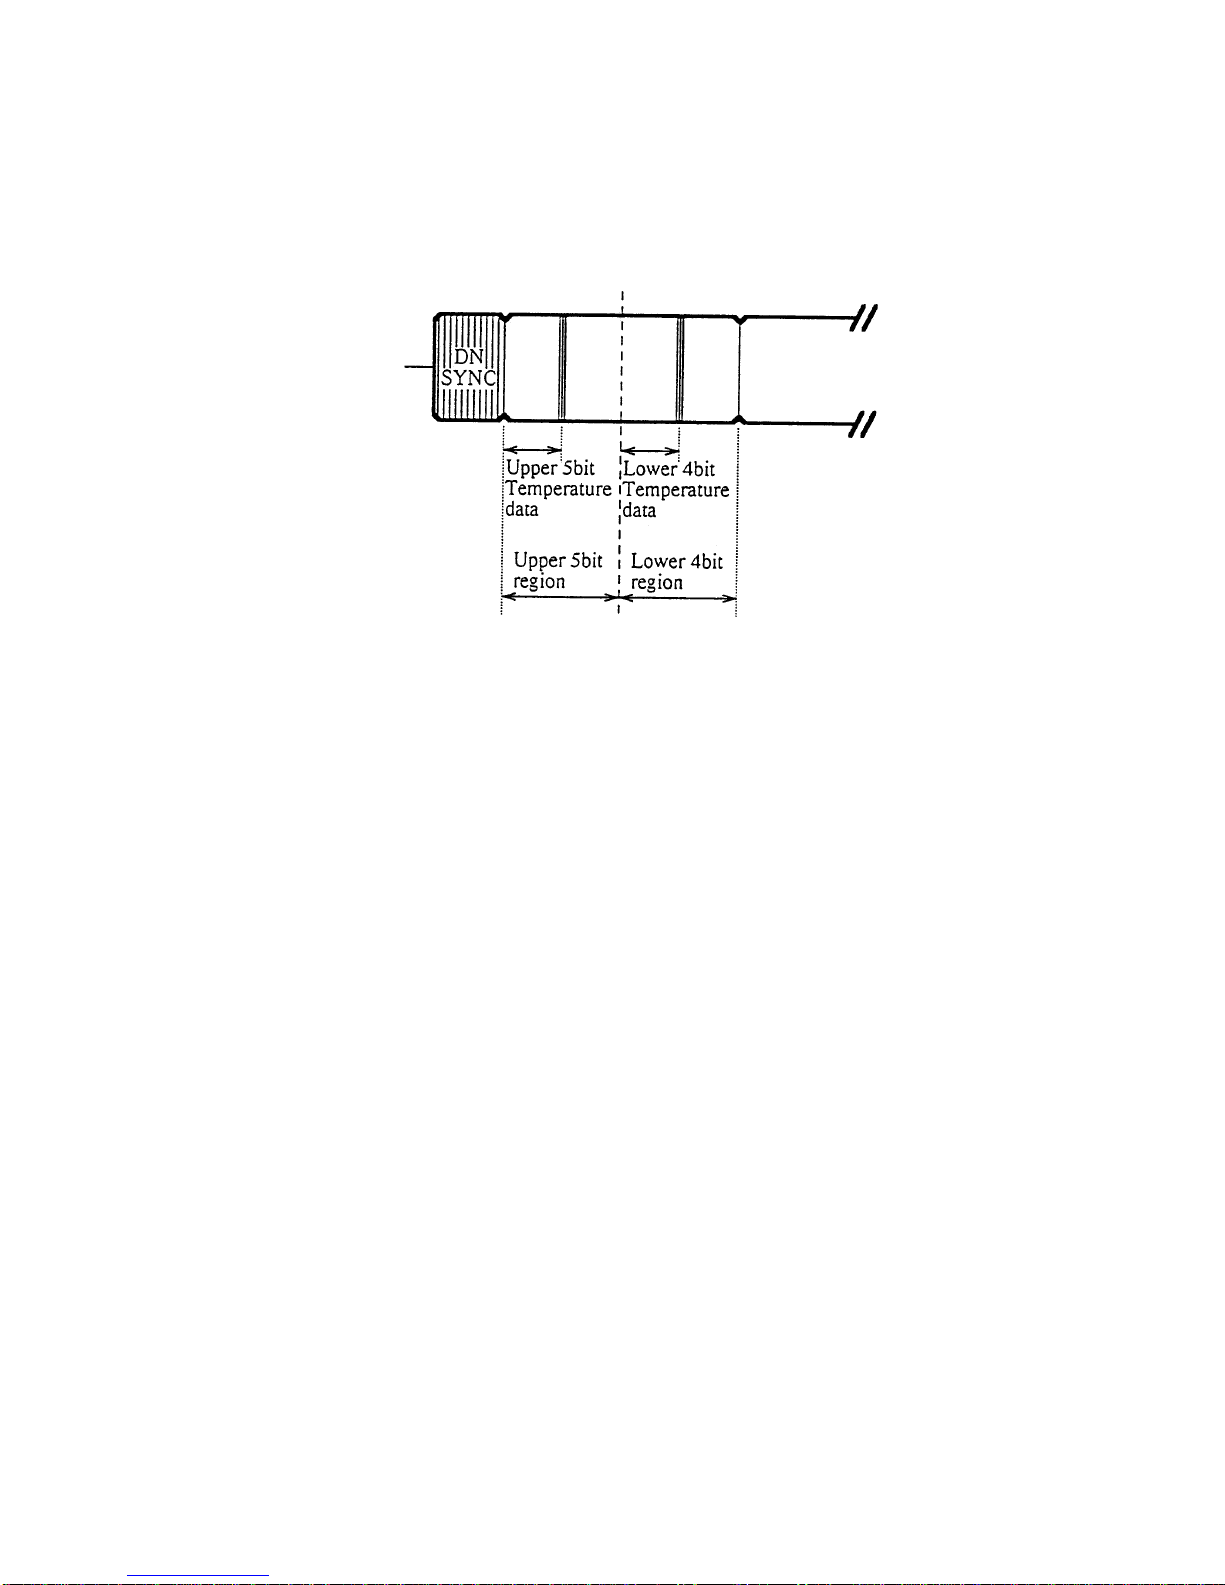
1.3.2Temperature Data ............................................................................1-3
1.3.3 Upward/Downward Sounding ..........................................................1-4
1.3.4 Depth Data ......................................................................................1-4
2.CIRCUIT DESCRIPTION ................................................................................2-1
2.1TRANSMITTER UNIT ..............................................................................2-1
2.1.1 Board Function ................................................................................2-1
2.1.2 Power ON/OFF Control ...................................................................2-1
2.1.3 Upward and Downward Soundings ..................................................2-1
2.1.4 Depth/Temperature Measurement (SEN Board) ..............................2-5
2.1.5 Signal Transmission (CONT-A, CONT-B Boards) .............................2-7
2.2 DISPLAY UNIT ........................................................................................2-10
2.2.1 Power Supply (POW 01P5727) .......................................................2-10
2.2.2 Receiver Board (AMP 01P5725) .....................................................2-12
2.2.3 Display and Signal Processor Board (DISP 01P5726) .....................2-12
3.CHECK AND ADJUSTMENT ..........................................................................3-1
3.1 DISPLAY UNIT CHECK ......................................................................
3-1
3.1.1Self-Check ................................................................................
3-1
3.1.2 Power Supply Circuit (POW Board 01P5737) ................................
3-2
3.2 TESTING FUNCTION IN AIR ..............................................................
3-2
3.2.1 Testing Transmitter Unit and Display Unit with Receiving Transducer. 3-2
3.2.2TestinginAirwithoutParavaneReceiver........................................
3-3
3.3ADJUSTINGTRANSMITTERUNIT
.......................................................
3-4
3.3.1GainAdjustment..........................................................................
3-4
3.3.2 Depth Indication Adjustment.........................................................
3-4
3.3.3 Adjusting Transmission Frequency on CONT.B Board......................
3-5
3.4ADJUSTMENTOFDISPLAYUNIT.......................................................
3-7
3.4.1ColorMonitorAdjustment.............................................................
3-7
3.4.2 DISP Board (01P5726).................................................................
3-8
4.CHANGE OF SPECIFICATIONS .....................................................................4-1
4.1DISPLAYUNIT ..................................................................................
4-1
4.1.1 Range Unit, Sounding Range, Data Format, etc ............................
4-1
4.2TRANSMITTERUNIT ........................................................................
4-3
4.2.1 Sounding Range..........................................................................
4-3
4.2.2SoundingRate ...........................................................................
4-4
4.2.3SignalTransmittingPower ...........................................................
4-4
4.2.4AdjustmentMode
.........................................................................
4-5
5.PARTS LOCATION............................................................................................
5-1
5.1DISPLAYUNIT....................................................................................
5-1
5.2 TRANSMITTER UNIT (CN-2220)..........................................................
5-6
6.BOARD INTERCHANGEABILITY.....................................................................6-1
6.1DISPLAYUNIT....................................................................................
6-1
6.2TRANSMITTERUNIT..........................................................................
6-2

7.CALIBRATION OF PRESSURE SENSOR........................................................
7-1
8. DISASSEMBLING/ASSEMBLING TRANSMITTER UNIT .................................
8-1
SPECIFICATIONS.................................................................................................
SPC-1
EXPLODED VIEW.................................................................................................D-1
MECHANICAL PARTS LIST..................................................................................
M-1
ELECTRICAL PARTS LIST.......................................................................................
E-1
SCHEMATIC DIAGRAM........................................................................................
S-1

1-1
1. GENERAL
This chapter describes the basic operations of the transmitter unit.Most of operations are
CPU controlled.
1.1 POWER SUPPLY
The transmitter unit is automatically powered by the pressure switch when it descends 10
m in the sea and turned off when it ascends to 5m deep point.
1.2 UPWARD AND DOWNWARD SOUNDING
The transmitter unit incorporates only one sounding transmitter/receiver circuit.The upward
and downward transducers are alternately connected to the circuit by the action of a relay.
1.2.1 Sounding Rate
Two kinds of sounding rates are used to improve coverage area.
Standard Rate ("LOW" setting)
Downward
Sounding
Upward
Sounding
The time "T" between the pulses depends on the sounding range setting in the
transmitter unit.
Fig.1.1 Upward and Downward Sounding in Standard Mode
High Rate ("HIGH" setting)
In this rate, sounding is performed three times within one cycle of transmitter operation with
standard rate.
Downward
Sounding
Upward
Sounding
Fig.1.2 Upward and Downward Soundings at High Rate

1-2
The receiver receives signals within the range in use at the first sounding, and it receives
signals between 0 and 20 meters at the second and third soundings in both upward and
downward directions. Generally, the blind zone occurs in short range due to the beam
shape and rare transmission rate. The high transmission rate can reduce the blind zone
and increase the number of reflection from the target.
Refer to the figure below.
Fig.1.3 Sounding Area (Standard versus High)
The received signals obtained by these three soundings are processed as follows in the
transmitter unit.
a) 0 - 20m:The received echoes obtained from the three soundings are compared and
the strongest echo is picked up and sent to the display unit.
b) more than 20m: The received echoes obtained from the first sounding are sent to the
display unit.
1.3 DATA FORMAT FROMTRANSMITTER UNIT
The data sent from the transmitter unit to the paravane receiver consist of upward and
downward sounding signals, sync code, temperature and depth data, and catch sensor
data (option).Transmission sequence of these signals are shown in Fig.1.4.
Fig.1.4 Data Format
There are two SYNC codes, DN SYNC and UP SYNC, and (2) depth data is divided into
two parts, MSB and LSB.
Detects target one time Detects target three times

1-3
1.3.1 SYNC Code
The synchronous signal consists of 32bits binary coded data.
The DN SYNC code is attached to the beginning of each transmission cycle to enable the
display unit identifying the signal. The coded pulses enable to reduce the effect of noise
along the transmission line to the paravane receiver.
The S/N ratio becomes maximum when the number of bits is 2n -1 (n: integer), 31 bits out
of these 32 bits are actually used in the display unit. Fig.1.5 shows the 32 bits code data.
Fig.1.5 SYNC Code (DN SYNC)
The UP SYNC signal inserted before the catch monitor data consists of 15 bit binary code
data and is used to stabilize the oscillation line of the upward sounding picture on the
display unit.
For the modulation of the sync codes, the FS (Frequency Shift) modulation is employed; "1',
and "0" are modulated at frequencies which are different by 1kHz each other, as shown
bellow.
Code/Frequency
Transmission Frequency 0 1
33 kHz 33 kHz 34 kHz
40 kHz 40 kHz 41 kHz
50 kHz 50 kHz 51 kHz
1.3.2Temperature Data
The water temperature is indicated by the time interval from the left edge of the
temperature data region to the temperature signal (15 bit H/L code). The temperature data
region is allocated next to the DN SYNC code.
Fig.1.6 Temperature data region
Depending on the temperature, the time from the left edge varies.
Temperature signal (15 bit H/L code)

1-4
Note: In actual processing, the temperature data expressed by 9 bit binary number is
divided into two parts, the lower 5 bits and the upper 4 bits, and the temperature data
region is also divided into two sections. The time interval from the left edge of each section
to temperature signal indicate the value of the lower 5 bit or upper 4 bit number. This
configuration enables to shorten the length of the temperature data region.
Fig.1.7 Temperature data region
1.3.3 Upward/Downward Sounding
The received echo signals are transmitted to the paravane receiver with
frequency-modulated form.
The echo signals received by the upward/downward sounding circuit are converted into 4
bits binary data which represent 15 stages signal level and then converted into FM signal
by the V-F converter.
1.3.4 Depth Data
Like the water temperature measurement, the detected depth is indicated by the time from
the left edge of the depth signal area to the depth signal (15 bit H/L code). However, to
shorten the length of the depth signal area, the depth data is divided into two parts (upper
6 bits and lower 6 bits) and inserted into the pause areas of downward and upward
sounding periods.See Fig. 1.8.

1-5
Fig. 1.8Transmitter unit timing chart (range: 80/80 m and sounding rate: high)

2-1
2. CIRCUIT DESCRIPTION
2.1TRANSMITTER UNIT
2.1.1 Board Function
Refer to the block diagram shown in figure 2.1. The transmitter unit consists of five PC
boards.The table below shows the major functions of each PC board.
Board Major Functions
TRS. A 01 P5742 1) Generates upward/downward sounding TX signals.
2) IF amplifier, mixer, and detector of received signals.
3) TVG control of received signals.
4) A/D conversion of received signals.
TRS. B 01 P5743 1) Power amplification of upward/downward sounding TX signals.
2) RF amplification of received signals.
SEN 01 P5744 1) Depth/water temperature measurement.
CO NT. A
01P5740 1) Control of transmitter, receiver and signal transmitter circuits by
CPU.
2) Acquisition and processing of A/D converted received signals.
3) Power amplification of signal transmitted to paravane receiver.
CONT.B 01P5741 1) D/A conversion and frequency modulation of signals transmitted
toward paravane receiver.
2) A/D conversion of depth and water temperature signals for
acquisition by CPU.
3) Presetting of transmitter unit operation mode.
2.1.2 Power ON/OFF Control
When the transmitter unit reach at 10 m deep in the water, the pressure switch is turned on
and activates the + 5 and 15 V regulator on the CONT A board. And the transmitter unit
starts functioning automatically. When the transmitter unit rises above 10 m, the pressure
switch is turned off, and the transmitter unit stops functioning.
2.1.3 Upward and Downward Soundings
Transmitter Circuit
The transmitter circuit for upward and downward soundings are incorporated onTRS.
A and TRS. B boards. For the 75 kHz transmission, the 1.2 MHz signal generated by the
CPU on the CONT A board is frequency-divided by 16 to 75kHz and 1.4 MHz generated by
a crystal oscillator on the TRS.A board is divided by 8 to 175 kHz.
These 75 kHz or 175 kHz clock signals are applied to the succeeding gate circuit, where it
is gated by 0.2ms long TSMT pulse from the CPU, and then sent to the power amplifier.
The power amplifier amplifies the transmission signals to 100W and sent to the sounding
transducer via the output transformer and the T/R circuit. The T/R circuit links the
transducer to the transmitter circuit during transmission and to the RF amplifier during
reception. Relay K1 selects the transducer for upward or downward sounding and is
controlled by the CPU via the UP/DN CONT circuit.
Figure 2.2 and 2.3 show the transmitting waveform and TSMT signal.

2-2
Fig.2.1 Block Diagram ofTransmitter Unit

2-3
Fig. 2.2 TX waveform Fig.2.3 TX trigger:TSMT
Receiver Circuit
The received signal from the transducer is first amplified by the RF amplifier and then
mixed with the local oscillator output to get a 455 kHz IF signal. The IF signal (Fig.2.4 CH1)
is amplified and fed to the next stage's full wave detector. The output of the detector (Fig.
2.4 CH2) is A/D converted to eight bit echo data at specific sampling intervals.
The AMP PWR CONT circuit supplies + 5 V (AMP5V), which is controlled by APWR signal
from the CPU, to the TVG amplifier only during the reception period to conserve battery
consumption.
Fig.2.4 Waveforms of received echo signal Fig.2.5 Waveform of carrier signal
TVG Circuit
Triggered by the TVG (Time Varied Gain) signal from the CPU on the CONT A board, the
TVG circuit generates an exponentially rising TVG voltage (TVG curve). This voltage
controls the gain of the amplifier in such a way that the gain is minimum at the time of
transmission and gradually increases with time. The TVG curve is factory set to a 30 log
curve suitable for fish detection.
Fig.2.6 shows the waveforms of the TVG voltage.
Measuring point: P4 #1 - P4 #4
Frequency:75 kHz
100V/DIV
0.2ms/DIV
Measuring point:TP6 on TRS.A board
Frequency:75 kHz
2V/DIV
0.5ms/DIV
Measuring point: CH1 -- TP3
CH2---TP2(ESIG)
Measuring point:TP7 (carrier)
CH1
CH2
CH1
200mV/Div
1ms/Div
CH2
2V/Div
1ms/Div
CH1
200mV/Div
1us/Div

2-4
(A) (B)
Fig.2.6 waveforms of TVG voltage
Fig.2.7 TVG curve
The STC (Sensitivity Time Control) curve is also generated in the TVG circuit.It suppresses
the echoes just below the oscillation line, making the oscillation line thin so as not to cover
the fish echoes close to the head rope.
CH1
2V/DIV
100ms/DIV
CH1
500mV/DIV
2ms/DIV
CH2
2V/DIV
2ms/DIV
CH1
CH2
0 V
Measuring point:TP5 (VG)
Sounding rate: High
Measuring point
CH1:TP5 (VG)
CH2:TP6

2-5
2.1.4 Depth/Temperature Measurement (SEN Board)
Depth Measurement
Refer to the simplified depth measurement circuit shown in figure 2.8.
Fig.2.8 Simplified Depth Measurement Circuit
1)The pressure sensor for depth measurement constitutes a Wheatstone Bridge.
It balances at 0 m and the voltage difference between "+" and " - " becomes zero.
(In fact there is 0.6 mV approximately, so R10 adjusts the off-set voltage to obtain 0 V.)
2) When the sensor (S1 and S2) detects water pressure, the resistance of one sensor
increases and that of the other decreases, developing a voltage proportional to the
depth across "+" and "-" terminals.
3) The voltage detected by the sensor device is once amplified at U1 (1/2) and (2/2), then
led to differential amplifier U2 (1/2).The output of U2 (1/2) detected as DEP-1 at TP3 is 1
to 9 V which corresponds to the depth of 0 - 2000m.U1 (1/2) and (2/2) are an amplifier of
high input impedance and employed to increase measuring accuracy.
4) The succeeding differential amplifier U2 (2/2) works to enhance the measuring
resolution as much as five times. Namely the output at TP4 (DEP-2) varies from 1 to
9 V five times while DEP-1 atTP3 varies from 1 to 9V.
This is controlled by the CPU; the CPU monitorsTP3 (DEP-1) voltage and changes
the reference voltage of U2 (2/2) at depths corresponding to every 400m (400m,
80cm...160Cm). Refer to Figs.2.9 for the operation.

2-6
Fig.2.9 Conversion Curve;depth vs. voltage
IMPORTANT
The pressure sensor is a non-linear device and the characteristic varies from device
to device. As the calibration data for the sensor in use are stored in the EEROM (U5
on SEN board), the sensor and SEN board should be used as a pair, that is, both the
sensor and SEN board should be replaced if either of them is defective.
Temperature Measurement
The thermistor, which has characteristics shown in Fig.2.10, is used as the sensor device.
The variation of resistance caused by variation of temperature is converted to variation of
voltage (shown in Fig.2.11) by the TEMP AMP circuit and fed to the CPU through the A/D
converter on the CONT B board.
Fig. 2.10 Characteristics of the thermistor

2-7
Fig. 2.11 Temperature Data (TP8)
2.1.5 SignalTransmission (CONT-A, CONT-B Boards)
Refer to the block diagram on page 2-2.
• Echo, Depth andTemperature Data Reading by CPU
The eight bit echo data (256 step slices) from the TRS. A board are once applied to the
dual-port RAM and finally transferred to the CPU. When writing the echo data into CPU, the
sampling interval is controlled depending on the distance from the transmitter unit as
shown in Table 2.1.In shorter ranges the data are picked up at shorter intervals to improve
resolution.For example, in case of 320m range, the total sampling data are;
l l
0----------5----------10----------20----------40---------------------------320 m range
512 + 256 + 256 + 256 3840 x 280/600 = 3072
Table 2.1 Range Sampling Interval Total Echo Data
0 - 5 m 1 cm 512
5 - 10 m 2 cm 256
10 - 20 m 4 cm 256
20 - 40 m 8 cm 256
40 - 640 m 16 cm 3840
The echo data read by CPU is compressed logarithmically from 8 bits to 4 bits and stored
in scratch pad RAM U2 until they are read out for signal transmission. This logarithmic
conversion enhances the low-level signals so that they may be less affected by noise
during transmission toward the paravane receiver. If, for example, the noise level in the
propagation path is as in Fig. 2.12, the signals within "b" are affected by noise in the linear
conversion while those only within "a" are affected in the logarithmic conversion.

2-8
The low level signal Transmission can be improved against the noise.
*16 bits = 15 bits for signal + 1 bit for frequency calibration data
Fig.2.12
Depth and temperature data from the SEN board are read by the CPU through the AD
converter on the CONT B board and then stored in the scratch pad RAM U2.
• SignalTransmission
The temperature, upward and downward sounding and depth signals stored in the RAM
are read out one after another according to the transmission format shown in Fig.2.13.
Those are D/A converted, frequency-modulated on the CONT B board and transmitted to
the paravane receiver.Synchronous signals ("DOWN SYNC" and "UP SYNC") are made by
software, stored in the ROM and read out at each transmitting timing.
Fig.2.13
The timers on the CONT A board operate as a frequency counter. It counts the Voltage to
Frequency (V/F) converter output during the temperature data period and adjusts the
signal level if V/P converter characteristic deviates from the rated range.

2-9
The echo data from the CPU consists of 8 bits (4 bits for echo data and 4 bits for frequency
calibration data). The CPU determines the calibration value from timer's output count and
writes it on the designated frequency calibration data bits to obtain 50kHz (33kHz, 40kHz)
in no-modulation (no signal) state and 51kHz (34kHz, 41kHz) in maximum modulation
state at TP1 and TP2.
Echo Data Frequency
Calibration Data
Fig.2.14
The TON (Transmitter ON) is a gate signal which functions to cut the carrier signal for non
signal period when transmitting the temperature, depth and catch monitor data.This control
helps to conserve battery consumption. However, in the transmission period of upward and
downward sounding data, the carrier signal is emitted even when there is no echo signal.
Refer to Fig.1.8 TX unit timing chart.
• Power Amplifier
The output applied to the frequency divider is frequency-calibrated and FM-modulated
signals. The frequency divider divides the frequency by 8 to produce the actual transmitting
frequency of 33, 40 or 50kHz. A gate circuit is incorporated in the output of the frequency
divider to provide the dead time to prevent the two power transistors from conducting
simultaneously. The output of the frequency divider is sent to the power amplifier and
applied to the transducer. The output power is 10W or 2.4W as determined by tap
connections of the output transformer.

2-10
2.2 DISPLAY UNIT
The display unit consists of the following sections as shown in the block diagram on the
next page.
(1) Power Supply (01 P5737)
(2) Amplifier Board (01P5725)
(3) Display and Signal Processing Board (01P5726)
(4) Panel Board (01P5729)
(5) Color Monitor (TM-140F2 or CDKC-14CE151)
2.2.1 Power Supply (POW 01P5727)
The power supply circuit is made up of a PWM (Pulse Width Modulation). Inverter
employing switching regulator techniques like other Furuno-made echo sounders and
radars. The PWM inverter universally operates on ship's mains of 10 - 40 VDC. Against the
vibration of the load condition, it regulates the DC output line by changing the width of its
output pulse. The power supply circuit provides +12 V, -12 V, +5V, and 130 V for the color
monitor.
Each line is connected to the respective circuit as shown in Fig. 2.15.
Fig.2.15 Power Supply for Display Unit

2-11
Fig.2.16 Block Diagram of Display Unit
Other manuals for CN-24
2
Table of contents
Other Furuno Recording Equipment manuals

Furuno
Furuno IF-2550 User manual

Furuno
Furuno IF-1500AIS User manual

Furuno
Furuno IF-5200 User manual

Furuno
Furuno CU-300 User manual

Furuno
Furuno Interface Unit IF-5000/5001 User manual

Furuno
Furuno IF-2000 User manual

Furuno
Furuno IF-NMEASC User manual

Furuno
Furuno IF-5200 User manual

Furuno
Furuno INTERFACE UNIT IF-2500 User manual
Popular Recording Equipment manuals by other brands

Acrobatics
Acrobatics Spirale operating manual

GRASS VALLEY
GRASS VALLEY K2 DYNO - quick start guide

RCS AUDIO-SYSTEMS
RCS AUDIO-SYSTEMS SS-220 P operating instructions

Korg
Korg Toneworks AX1B owner's manual

DIGITIZE
DIGITIZE System 3505 Prism LX Installation and operation manual

Behringer
Behringer ULTRAGAIN PRO-8 DIGITAL ADA8000 user manual