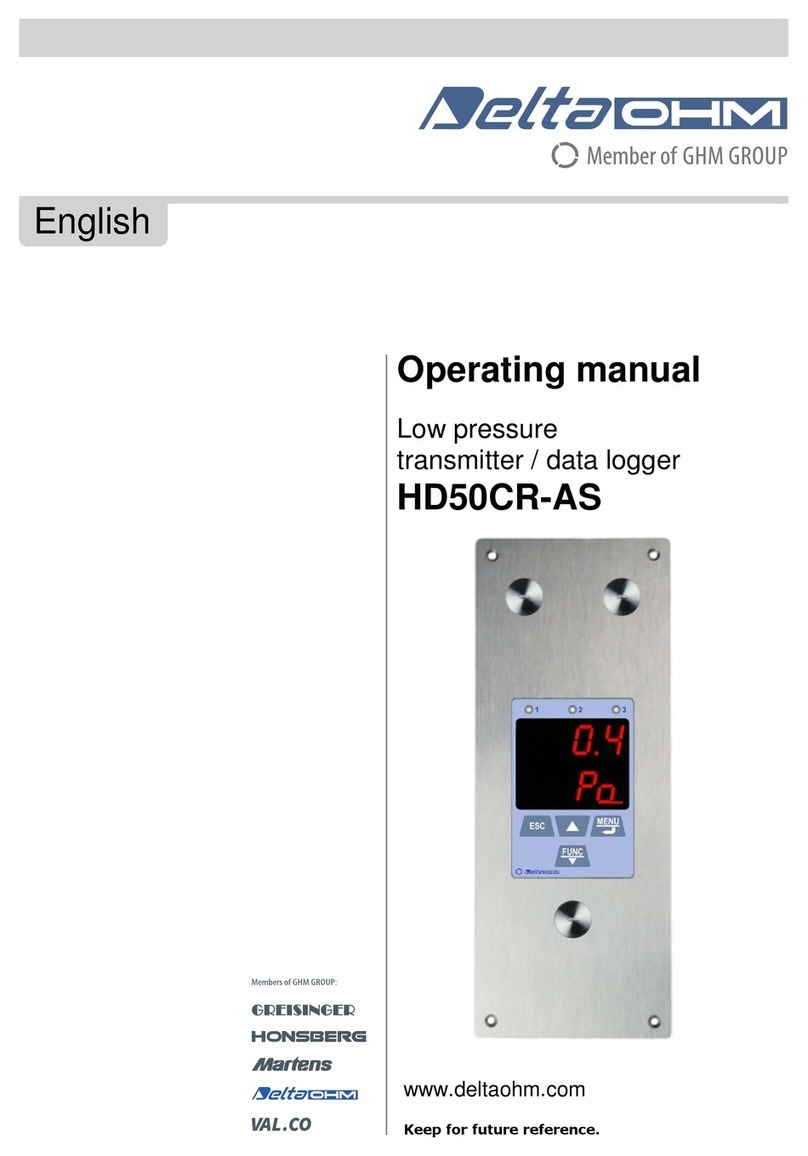
GHM Delta OHM HD50CR User manual

Operating manual
Low p
ressure
transmitter
/ data logger
HD50
CR
Keep for future reference.
www.deltaohm.com
English
Companies / Brands of GHM

HD50CR - 2- V1.0
TABLE OF CONTENTS
1INTRODUCTION.................................................................................................... 3
2DESCRIPTION....................................................................................................... 4
3INSTALLATION ..................................................................................................... 5
3.1 CONFIGURATION ................................................................................................6
4CONNECTION TO THE LOCAL NETWORK................................................................ 8
4.1 HD35AP-CFR21 SOFTWARE OPTION........................................................................8
5ALARMS.............................................................................................................. 10
6STATISTICAL FUNCTIONS................................................................................... 12
7CALIBRATION..................................................................................................... 13
8WEB SERVER....................................................................................................... 14
8.1 SETTINGS MENU ............................................................................................15
8.2 MONITOR MENU.............................................................................................20
8.3 CONNECTIVITY MENU .....................................................................................22
8.4 FILES MENU ..................................................................................................29
9MENU.................................................................................................................. 30
10 MODBUS ............................................................................................................. 36
11 TECHNICAL CHARACTERISTICS .......................................................................... 42
12 INSTRUMENT STORAGE ...................................................................................... 45
13 SAFETY INSTRUCTIONS...................................................................................... 45
14 ORDERING CODES .............................................................................................. 46

HD50CR - 3- V1.0
1INTRODUCTION
HD50CR is a relative or differential low pressure transmitter and data logger designed
for wall flush-mounting. Measuring range ±125 Pa.
A silicon piezoresistive sensor with high accuracy and temperature compensation is
used, which allows excellent linearity, repeatability and stability over the time. The
auto-zeroing feature allows stable measurements over the time without the need to
recalibrate.
An input for an optional relative humidity and temperature combined probe is provid-
ed. The absolute humidity, the Dew Point and the wet bulb temperature are calculat-
ed.
Three 0…5/10 V and 0/4…20 mA analog outputs and a digital RS485 output with
“Slave” Modbus-RTU protocol for connecting the instrument to a network of sensors
are available.
The electroluminescent display has an inattinic red protection. The front keyboard al-
lows scrolling the real time measurements and configuring the instrument.
The instrument can be connected to a local network via the Ethernet interface (op-
tionally Wi-Fi, on request). The simultaneous operation of two communication proto-
cols (proprietary and Modbus TCP/IP) is possible. The instrument manages up to 10
“TCP/IP Client” simultaneously. If the local network is connected to Internet, the data
can be regularly sent to an FTP address, to the Cloud and via e-mail.
Equipped with a USB port with mini-USB connector for the direct connection to a PC.
For each detected quantity, two alarm thresholds can be set by the user. Exceeding a
threshold is signaled acoustically, by means of the internal buzzer, visually, by lighting
the alarm LEDs on the front panel (only for the three measurements associated with
the analog outputs), and remotely, by sending alarm e-mails. An alarm hysteresis and
a delay in the generation of the alarm can be configured for each detected quantity.
Thanks to the integrated web server, you can configure the instrument and view the
real time measurements from any PC, tablet or smartphone connected to the same lo-
cal network of the instrument by simply using a web browser.
The PC software HD35AP-S allows configuring the instrument, viewing the real time
measurements, downloading and viewing the data into a database. The HD35AP-S
software allows connecting one instrument at a time. If there are several HD50CR in-
struments in the local network, the PC software HDServer1 allows detecting automati-
cally all the instruments connected to the network and the simultaneous connection to
all the instruments, entering the data received by the instruments into a database,
viewing the data in the database and configuring some basic parameters of the devic-
es (alarms, logging interval, …). The HD35AP-CFR21 software option (available with
both HD35AP-S and HDServer1) allows the protection of recorded data and configura-
tion in response to FDA 21 CFR part 11 recommendations.
The internal clock can be regularly synchronized with a NIST reference server.
Brushed stainless steel front panel.
The instrument is supplied factory calibrated.

HD50CR - 4- V1.0
2DESCRIPTION
Buttons:
Scrolls the real time measurement on the display.
In menu, increases the displayed value or move to the next parameter.
Displays the statistical functions (MIN, MAX, AVG).
In menu, decreases the displayed value or move to the previous parameter.
Enters the menu.
In menu, confirms the displayed value.
Cancel the operation or goes back to the previous level.
Pressure inputs
Terminal header / ETHERNET port
Input for optional
T/RH probe
Inputs for
pressure calibration
LEDs
Display
Keyboard
USB port
with protective cap
Fixing holes

HD50CR - 5- V1.0
3INSTALLATION
Make a 196 x 70 mm cut in the wall, at least 46 mm deep, and 4 holes according to
the drilling pattern shown below, then wall mount the instrument by using the 4 holes
on the front panel.
The connections on the upper part of the housing are as follows:
ETHERNET port
Pressure input (+)
Pressure input (-)
RS485 port
Analog output 1
Analog output 2
Analog output 3
Power supply
24 Vac (L=Line, N=Neutral)
or 24 Vdc

HD50CR - 6- V1.0
Current analog
output connection
Voltage analog
output connection
Power supply
connection
The three analog outputs are associated with the first three quantities of the list of se-
lected quantities in the CHANNELS panel of the "web server" (see chapter 5) or,
equivalently, with the quantities of index CH1, CH2 and CH3 set in the F200 menu via
the front keyboard of the instrument (see chapter 7).
The current analog output and the voltage analog output of the same channel (1, 2 or
3) are associated with the same quantity.
Collegamento RS485
Connect any combined temperature and relative humidity probe to the 8-pole M12
connector on the bottom of the housing.
3.1 CONFIGURATION
The operating parameters of the instrument can be configured in various way:
•Via front keyboard (see chapter 7).
•Via the web server feature of the instrument (see chapter 5).
•Via the HD35AP-S application software, connecting the instrument to the PC via
USB or local network.
•Via the HDServer1 application software (only for some basic parameters: alarms,
logging interval, user code, …), connecting the instrument to the PC via local
network.
Device 1
Device 2
Data Logger
or PLC

HD50CR - 8- V1.0
4CONNECTION TO THE LOCAL NETWORK
The instrument can be connected to the local network via Ethernet interface (optionally
Wi-Fi, on request; the two interfaces are alternatives, they cannot be used simultane-
ously).
To connect the instrument to an Ethernet network, connect the RJ45 connector of the
instrument to a socket of the local network via a standard Ethernet cable.
The instrument is preset to get a dynamic IP address from the network DHCP server. A
static IP address can be set by using the web server feature of the instrument or the
HD35AP-S application software. The IP address is displayed at the end of the list of
quantities that can be scrolled by using the “up arrow” key.
To connect the instrument to a Wi-Fi network (optional), you must first change the set-
ting of the instrument interface by connecting the instrument to the PC via Ethernet and
using the web server feature of the instrument (see the panel CONNECTIVITY >> NET-
WORK in paragraph 5.3) or the HD35AP-S software. Alternatively, connect the instru-
ment to the PC via USB through the front mini-USB connector (unscrew the protective
cap) and use the HD35AP-S software.
The instrument can be accessed from any PC of the local network. To download the da-
ta in a database, the HD35AP-S (it allows connecting one instrument at a time) or
HDServer1 (it allows connecting several instruments simultaneously) application soft-
ware and the MySQL database management system (included in the HD35AP-S soft-
ware package) must be installed.
Thanks to the availability of two TCP/IP listening ports, each of which can operate with
proprietary (for the connection with HD35AP-S software) or MODBUS TCP/IP proto-
col, and ten sockets (in total, to be divided between the two ports), the instrument al-
lows the simultaneous operation of two communication protocols (proprietary and
Modbus TCP/IP) and manages up to 10 “TCP/IP Client” simultaneously. The default
setting of the ports is the following:
•Port number = 5100 for proprietary protocol (8 sockets)
•Port number = 502 for Modbus TCP/IP protocol (2 sockets)
If the local network is connected to Internet, the data can be regularly sent to an FTP
address, to the Cloud and via e-mail (as attachments).
Note: if the communication with the Cloud or the HDServer1 software is used, the
maximum number of “clients” with proprietary or MODBUS TCP/IP protocol is nine.
To configure the TCP/IP ports and the sending of data over the Internet, use the web
server feature of the instrument or the HD35AP-S software.
4.1 HD35AP-CFR21 SOFTWARE OPTION
The HD35AP-CFR21 option allows, in addition to the features of the basic software
(both HD35AP-S and HDServer1), the protection of recorded data and instrument con-
figuration in response to FDA 21 CFR part 11 recommendations. In particular, be-
come available:
•The traceability of activities (Audit Trail) performed with the software; for exam-
ple, which users connected and what changes were possibly made to the configu-
ration of the instrument.
•The management of users access for the instrument configuration and viewing of
HD50CR - 9- V1.0
data in the database. Each user can be assigned a different password for using the
software. There are also three levels of access (Administrator, Super-user and
standard User); for each level, the allowed operations can be defined.
The HD35AP-CFR21 option works with USB hardware key to be connected to any PC con-
nected to the same local network of the PC in which the basic software is installed.
Note: if the HD35AP-CFR21 option is used, the instrument integrated web server allows view-
ing measurements and configuration, but not the modification of the instrument configuration,
because the settings changed via web server cannot be traced.

HD50CR - 10 - V1.0
5ALARMS
For each detected quantity, two alarm thresholds can be set by the user. The alarm is
generated if the measured value falls below the lower threshold or rises above the up-
per threshold.
Exceeding a threshold is signaled:
•acoustically, by means of the internal buzzer (if enabled);
•visually, by lighting the alarm LEDs on the front panel (only for the three meas-
urements associated with the analog outputs);
•remotely, by sending alarm e-mails (if enabled).
An alarm hysteresis and a delay in the generation of the alarm can be configured for
each detected quantity.
The amplitude of the hysteresis is in percentage (0...100%) of the difference between the
two alarm thresholds. For example, if the hysteresis is 2% (default value), the lower
threshold is 10 °C and the upper threshold is 60 °C, the hysteresis in °C is equal to (60-
10)x2/100= 1 °C.
The alarm is generated after the set delay time or immediately if the “no delay” option
is selected (default). If the alarm condition disappears before the delay time has
elapsed, the alarm is not generated.
Enabling the Buzzer Latch option, the buzzer continues to sound even after the alarm
condition has ceased.
In the event of an alarm in progress with the buzzer active, the buzzer can be silenced
OK
OK
Alarm
Alarm
OK
Hysteresis
Hysteresis
Upper threshold
Lower threshold
OK
OK
Alarm
Alarm
OK
Hysteresis
Hysteresis
Upper threshold
Lower threshold
Delay

HD50CR - 11 - V1.0
for a configurable time. Once the set time has elapsed, the buzzer will resume sounding
or not depending on whether the alarm condition is still present or not.
The following example shows the silencing of the buzzer with Latch option disabled.
The following example shows the silencing of the buzzer with Latch option enabled.
off
off
on
on
off
Hysteresis
Hysteresis
Upper threshold
Lower threshold
Delay
off
on
on
off
off
on
off
Silencing
Silencing time elapsed
off
off
on
on
off
Hysteresis
Hysteresis
Upper threshold
Lower threshold
Delay
off
on
on
off
off
on
Silencing
Silencing time elapsed
Silencing

HD50CR - 12 - V1.0
6STATISTICAL FUNCTIONS
The instrument calculates and displays the maximum (MAX), minimum (MIN) and
average (AVG) value of the detected measurements.
In order to display the statistical information, press FUNC/: the instrument shows
the maximum value of the displayed quantity. To scroll the maximum values of the
various quantities use the key.
By pressing FUNC/again, the instrument shows the minimum value of the dis-
played quantity. By pressing FUNC/again, the instrument shows the average value
of the displayed quantity.
By pressing FUNC/once more, the instrument asks if the calculation of the statisti-
cal values is to be reset (FUNC CLR). Select YES or nO using /keys, then confirm
with the MENU/↵key.

HD50CR - 13 - V1.0
7CALIBRATION
The instrument calibrates automatically at regular intervals (default 60 minutes, the in-
terval is configurable) the zero of the differential pressure, temporarily disconnecting
the pressure inputs through an internal solenoid valve.
Via the Fc00 menu (see chapter 7) it is possible to perform a manual calibration in one
or two points. In order to perform manual calibration, it is necessary to unscrew the
two front caps that cover the calibration inputs. To perform zero calibration (Fc05 in
the menu), leave both inputs open. To perform calibration at non-zero values (gain
calibration, Fc08 in the menu), connect the front inputs to a low differential pressure
generator.
The differential pressure zero calibration is also possible via the Modbus Coil register
with address 72 (see chapter 10).
At the end of the calibration or verification, firmly screw the front caps so that the seal
is tight and the inputs are not affected by the external pressure.
Via the Fb00 menu it is also possible to calibrate the relative humidity sensor of the
combined temperature and relative humidity probe at points 33% RH and 75% RH.
Warning: the optional combined relative humidity and temperature probe must be
calibrated in line with the instrument. If the probe is ordered with the instrument, the
probe is already factory calibrated. If the probe is ordered later, the calibration must
be performed by the user via the Fbo00 menu.
Calibration inputs

HD50CR - 14 - V1.0
8WEB SERVER
The instrument has an integrated web server through which you can configure the in-
strument and view the real time measurements from any PC, tablet or smartphone
connected to the same local network of the instrument by simply using a web browser.
To connect to the web server, type the IP address of the instrument in the address bar
of the web browser of your device (PC, tablet, smartphone, …).
Note: the IP address is displayed at the end of the list of quantities that can be scrolled
by using the “up arrow” key.
Note: if a port number other than the standard HTTP (80) has been set in the instru-
ment, the port number must be specified after the IP address (IPaddress:port num-
ber).
In the web server starting window, enter the user name and the password supplied
with the instrument, then press Submit.
Structure of the web server menu:
SETTINGS
INFO Instrument general information
CONFIGURATION
Modbus parameters, user code and belonging group
MEASURES
Selection of the quantities to be displayed
LOGGING
Logging settings
ALARMS
Setting of the alarms
UNITS
Units of measurement
CHANNELS
Selection of the quantities to be displayed with the Monitor function
OUTPUTS
Setting of the analog outputs
MONITOR
MEASURES
Display of the real time measurements
CHART
Graphs of the measurements acquired by the Monitor function
SETUP
Settings of the graphs of the measurements
TABLE
Numeric table of the measurements acquired by the Monitor function
CONNECTIVITY
NETWORK
LAN/WLAN settings (Wi-Fi or Ethernet choice, IP address, etc.)
WIFI
List of the available Wi-Fi networks (Wi-Fi connection is optional)
EMAIL
Settings for sending e-mails
FTP Settings for sending data via FTP
CLOUD
Settings for sending data to the Cloud
SERVER
Settings for the connection with the HDServer1 software
CLOCK Setting of the automatic clock synchronization
FILES
LOAD
Import of data files
CHART
Graphs of imported measurements
SETUP
Settings of the graphs of imported measurements
TABLE
Numeric table of imported measurements

HD50CR - 15 - V1.0
8.1 SETTINGS MENU
The SETTINGS menu allows viewing the instrument general information and configuring
the Modbus parameters, the user code, the belonging group, the logging parameters,
the alarms and the units of measurement. It also allows choosing the measurements to
be stored in the internal memory and displayed in real time (Monitor) and in what order.
•INFO panel
Displays the general information of the instrument:
omodel, serial number
ouser code
obelonging group
oWi-Fi signal level (only if the optional Wi-Fi interface is active)
obehaviour when the internal memory is full (cyclic overwriting or not)
ologging status
obuzzer activation status
oModbus address, firmware version
ologging interval
omeasurement interval
ocalibration date
•CONFIGURATION panel
Setting of Modbus parameters, user code and belonging group (defining a group is
useful for identifying subsets of devices, for example the devices installed in the same
environment).
In the Modbus section of the panel, the following parameters can be set:
oModbus address {1…247, default = 1}
oBaud rate {96006 / 19200 / 38400 / 57600 / 115200, default = 19200 bps}
oParity and stop bits {8N1 / 8N2 / 8E1 / 8E2 / 8O1 / 8O2, default = 8E1}
oWaiting time after transmission {Immediate Reception = violate protocol and go in
receiving mode right after transmission / Wait 3.5 char = respect protocol and wait
3.5 characters after transmission, default = Immediate Reception}
oEnabling of the password for changing the configuration via Modbus {Ena-
ble/Disable, default = Disable}

HD50CR - 16 - V1.0
•MEASURES panel
Selection of the quantities to be displayed cyclically on the instrument display. For
each quantity, a custom name can be defined. In the panel, the resolution and the
unit of measurement of each quantity are also indicated.
•LOGGING panel
Setting of:
oLogging interval.
oMeasuring interval.
oLogging status (active or not active).
oMemory management mode when it is full (cyclic overwriting or stop logging).
Select the quantities to be displayed cyclically on the display
Custom name
Select to define a custom name
Button to refresh the settings
Press “Apply” to send the changes to the instrument
Button to refresh
the settings
Press “Apply” to send the changes to the instrument
User code
Belonging group
Modbus parameters

HD50CR - 17 - V1.0
If the logging interval is greater than the measuring interval, the average of the
measurements acquired during the logging interval will be stored.
The “Erase Memory” button allows erasing the data in the instrument memory.
•ALARMS panel
Setting of the alarm thresholds and buzzer operating mode for each of the available
quantities. The hysteresis, in percentage of the difference between the two alarm
thresholds, and the delay time (set “no delay” for immediate activation in the event of
an alarm) of the alarm can be configured.
Logging
interval
Measuring
interval
Press “Apply” to send the
changes to the instrument
Cyclic: cyclic overwriting of the memory
NO Cyclic: logging is stopped when the memory is full
Button to erase the memory
Button to refresh
the settings
Active: logging is active
NO Active: logging is not active
Press “Apply” to send the
changes to the instrument
Lower threshold
Upper
threshold
Button to refresh
the settings
Alarm hysteresis
Alarm delay
Send e-mail if the upper
threshold is exceeded
Send e-mail if the lower
threshold is exceeded
Enable lower threshold
Enable buzzer
Enable “Latch” function
Enable upper
threshold
Buzzer
silencing time

HD50CR - 18 - V1.0
If the Buzzer Latch option is enabled, the buzzer continues to sound even after the
alarm condition has ceased. The Alarm ack field allows silencing the buzzer for the set
number of minutes.
•UNITS panel
Setting of the temperature (°C or °F) and differential pressure (mbar, bar, Pa, hPa,
kPa, atm, mmHg, mmH2O, inHg, inH2O, kgf/cm2or PSI) units of measurement.
•CHANNELS panel
Allows choosing the measurements to be stored in the internal memory and displayed
in real time with the Monitor function and in what order. The panel has two lists: the
quantities available (to the left) and the quantities to be displayed (to the right). The
quantities are displayed in the order in which they appear in the list on the right.
Differential pressure
unit of measurement
Press “Apply” to send the
changes to the instrument
Temperature unit
of measurement
Activates all
the quantities
Delete the quantity selected
in the list on the right
Moves upwards or
downwards the quantity
selected in the list on
the right
Press “Apply” to send the
changes to the instrument
Button to refresh
the settings
Button to refresh
the settings

HD50CR - 19 - V1.0
•OUTPUTS panel
Allows configuring the analog outputs.
The three analog outputs are associated with the first three quantities of the list of se-
lected quantities in the CHANNELS panel.
Press “Apply” to send the
changes to the instrument
Button to refresh
the settings
Quantity value corresponding
to 0/4 mA and 0 V
Quantity value corresponding
to 20 mA and 5/10 V
Selection 0-20 mA
or 4-20 mA
Selection 0-5 V
or 0-10 V

HD50CR - 20 - V1.0
8.2 MONITOR MENU
The MONITOR menu allows viewing the real time measurements, both in graphic and
table form. The measurements and the corresponding date/time are updated at inter-
vals equal to the logging interval. The measurements acquired by the Monitor function
can be saved in a log file and exported in CSV format.
•MEASURES panel
Displays the current value of the quantities (only those selected for logging).
The measurements in alarm are highlighted with a red background. The Land Hsym-
bols indicate whether the lower (L) or higher (H) threshold has been exceeded.
•CHART panel
Displays the graphs of the measurements acquired by the Monitor function. The quanti-
ties can be displayed on the same graph or in separate graphs (see the SETUP panel).
Measurement in alarm
Button for
exporting the graph
(jpg or png format)
Table of contents
Other GHM Data Logger manuals

GHM
GHM Greisinger EASYLOG 80BIN User manual

GHM
GHM Delta OHM HD50CR-AS User manual

GHM
GHM GREISINGER EASYLOG 80IMP Series User manual

GHM
GHM Delta OHM HD33MT.4 User manual

GHM
GHM GREISINGER EB-Logg 80K Series User manual

GHM
GHM GREISINGER EB-Logg 80CL User manual

GHM
GHM Delta OHM HD35 Series User manual

GHM
GHM Delta OHM HD50 Series User manual