9
More Details ……………..
This section gives you more in depth
information on important topics of interest
(and possible confusion).
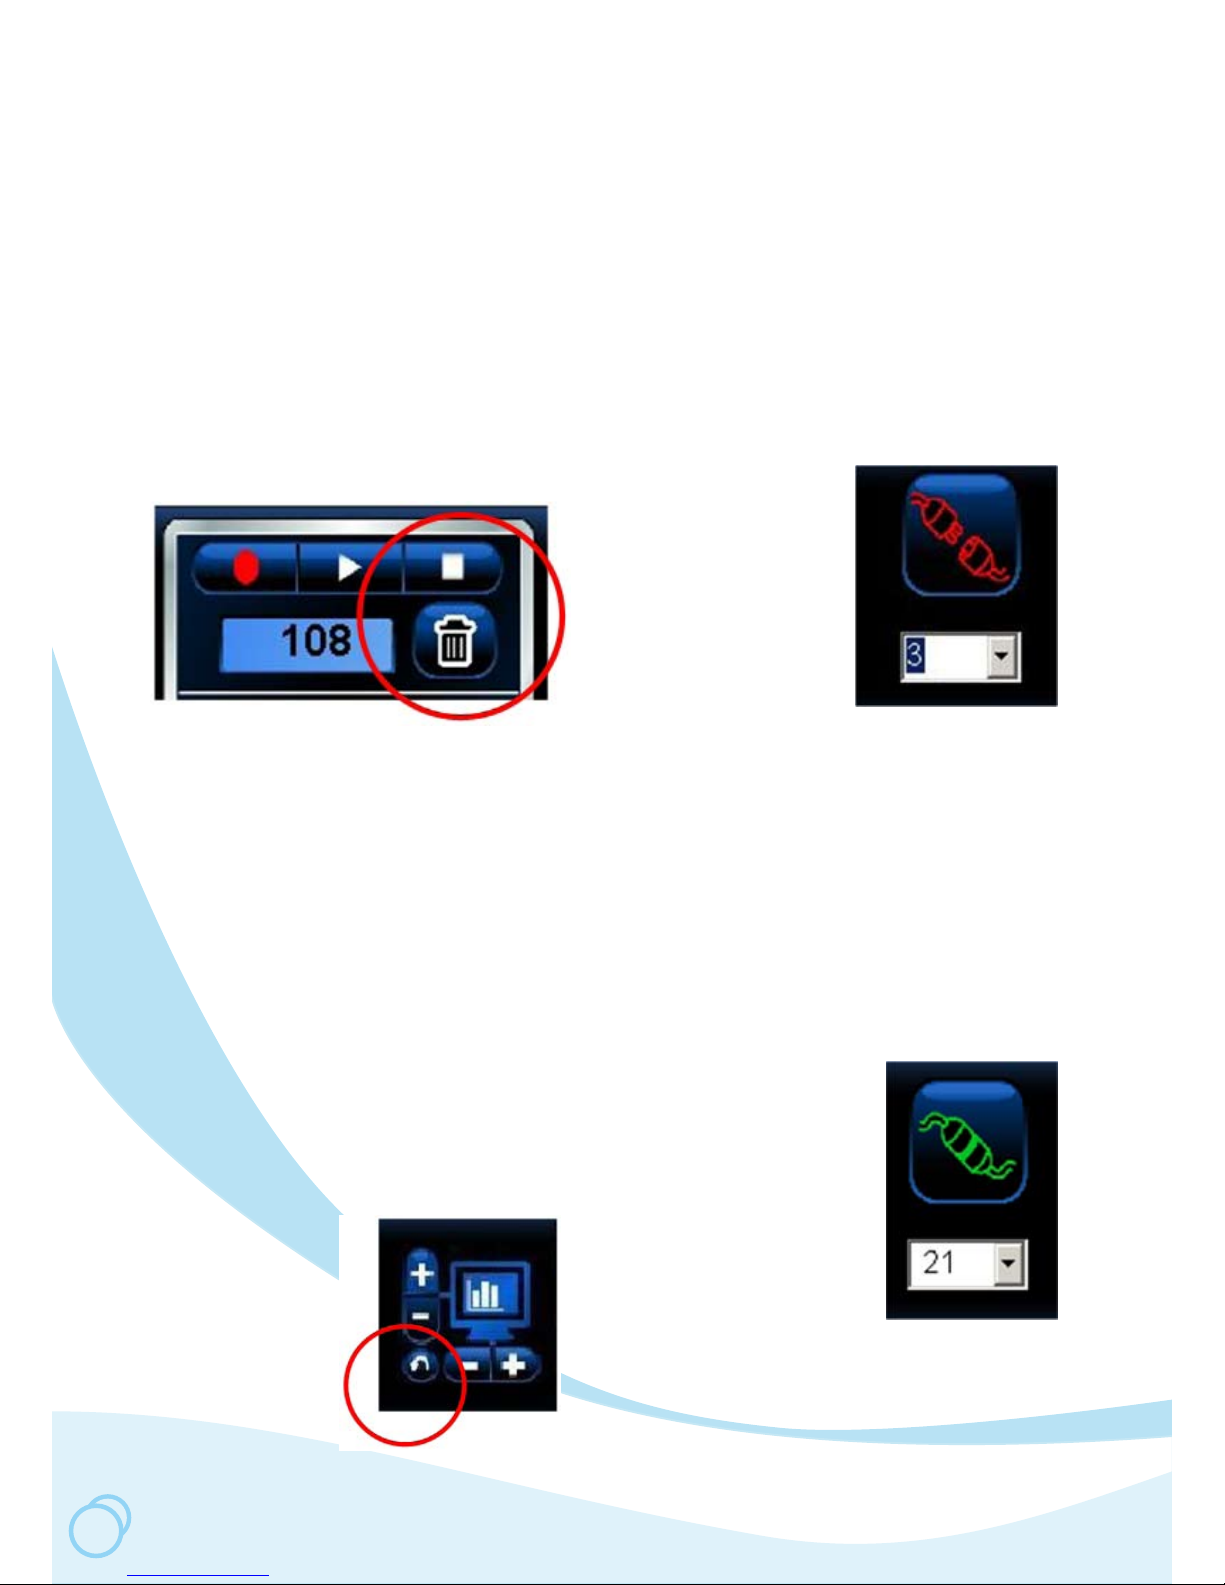
The Stop and Trash Icons
The Trash and Stop icons are the most
important controls for plotting.
If plotting seems to stop or not do what you
want it to do, it may be because the Stop
icon was not clicked. Make sure to click
the Stop icon after each recording.
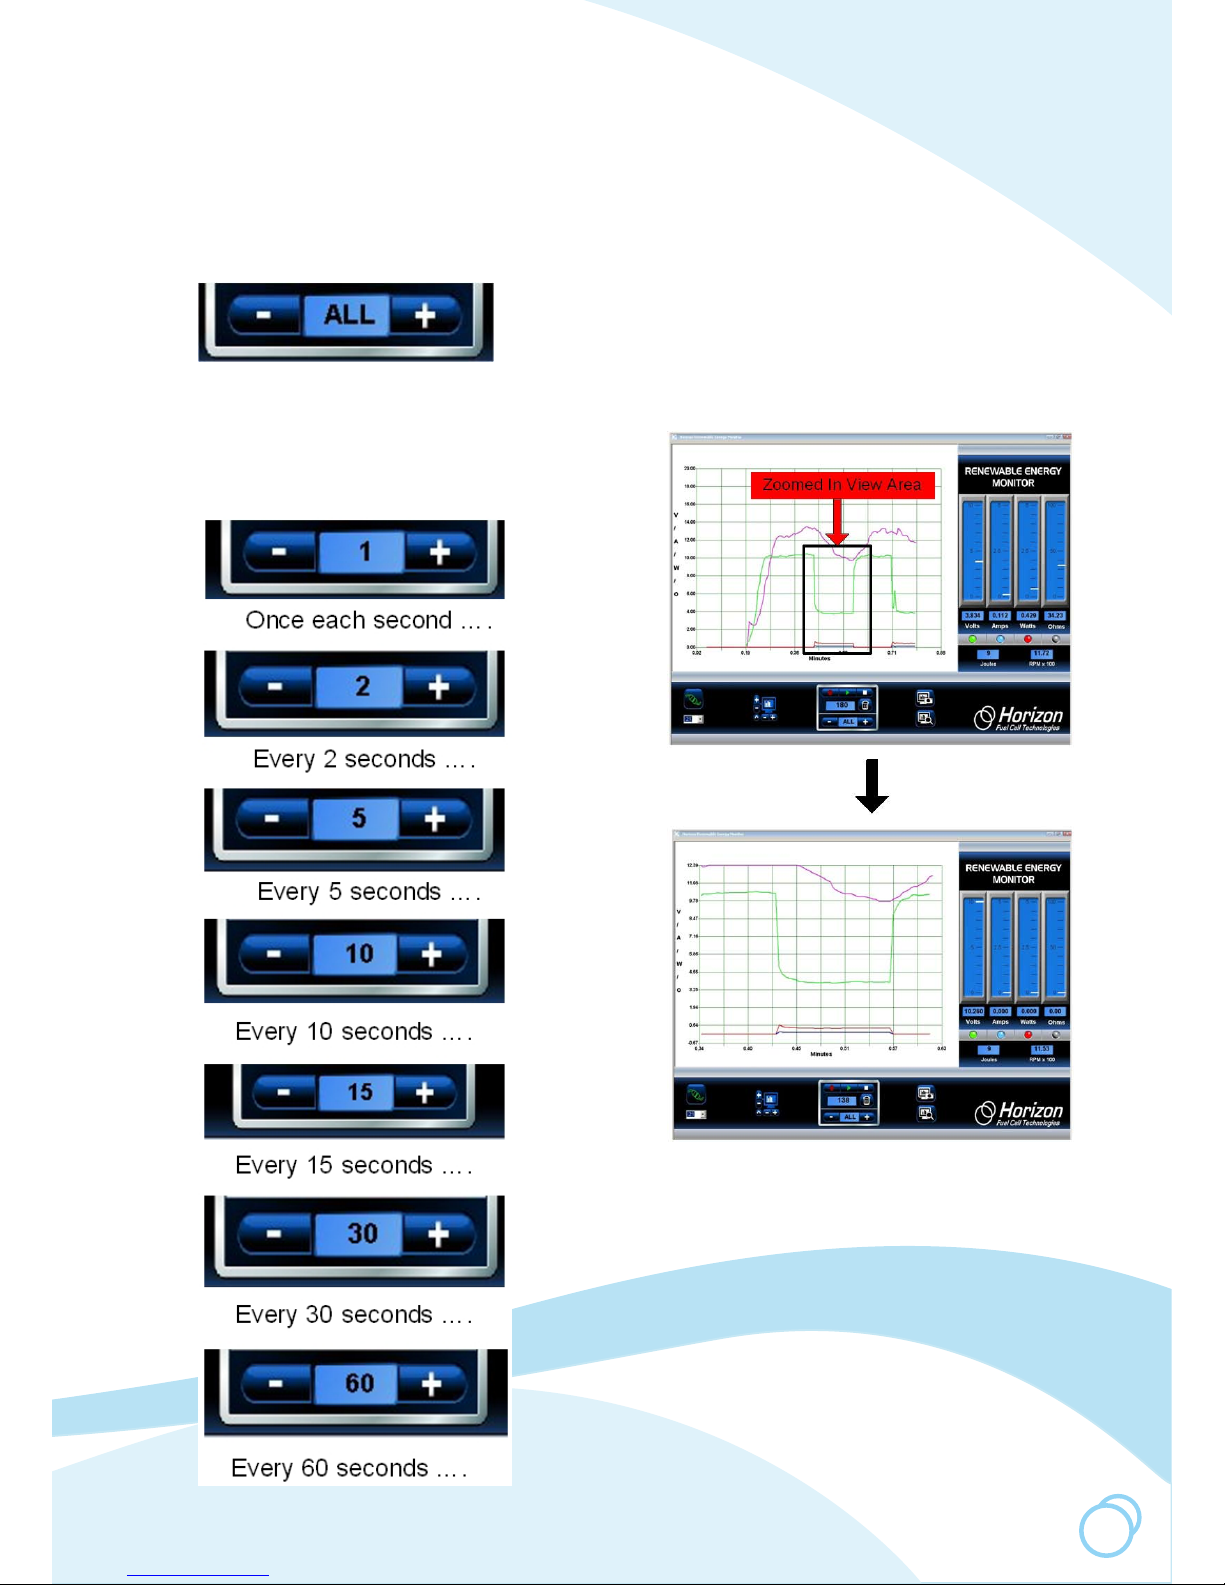
The Trash icon not only erases all the
recorded data, it also controls the time
scale on the plot area. Click the Trash icon
to reset the (horizontal) time scale to start
at 0.0 minutes again. When in doubt, click
both of them to get back to normal plotting.
The Recycle Icon
Click the Recycle
icon to set the plot
scales back to
default settings.
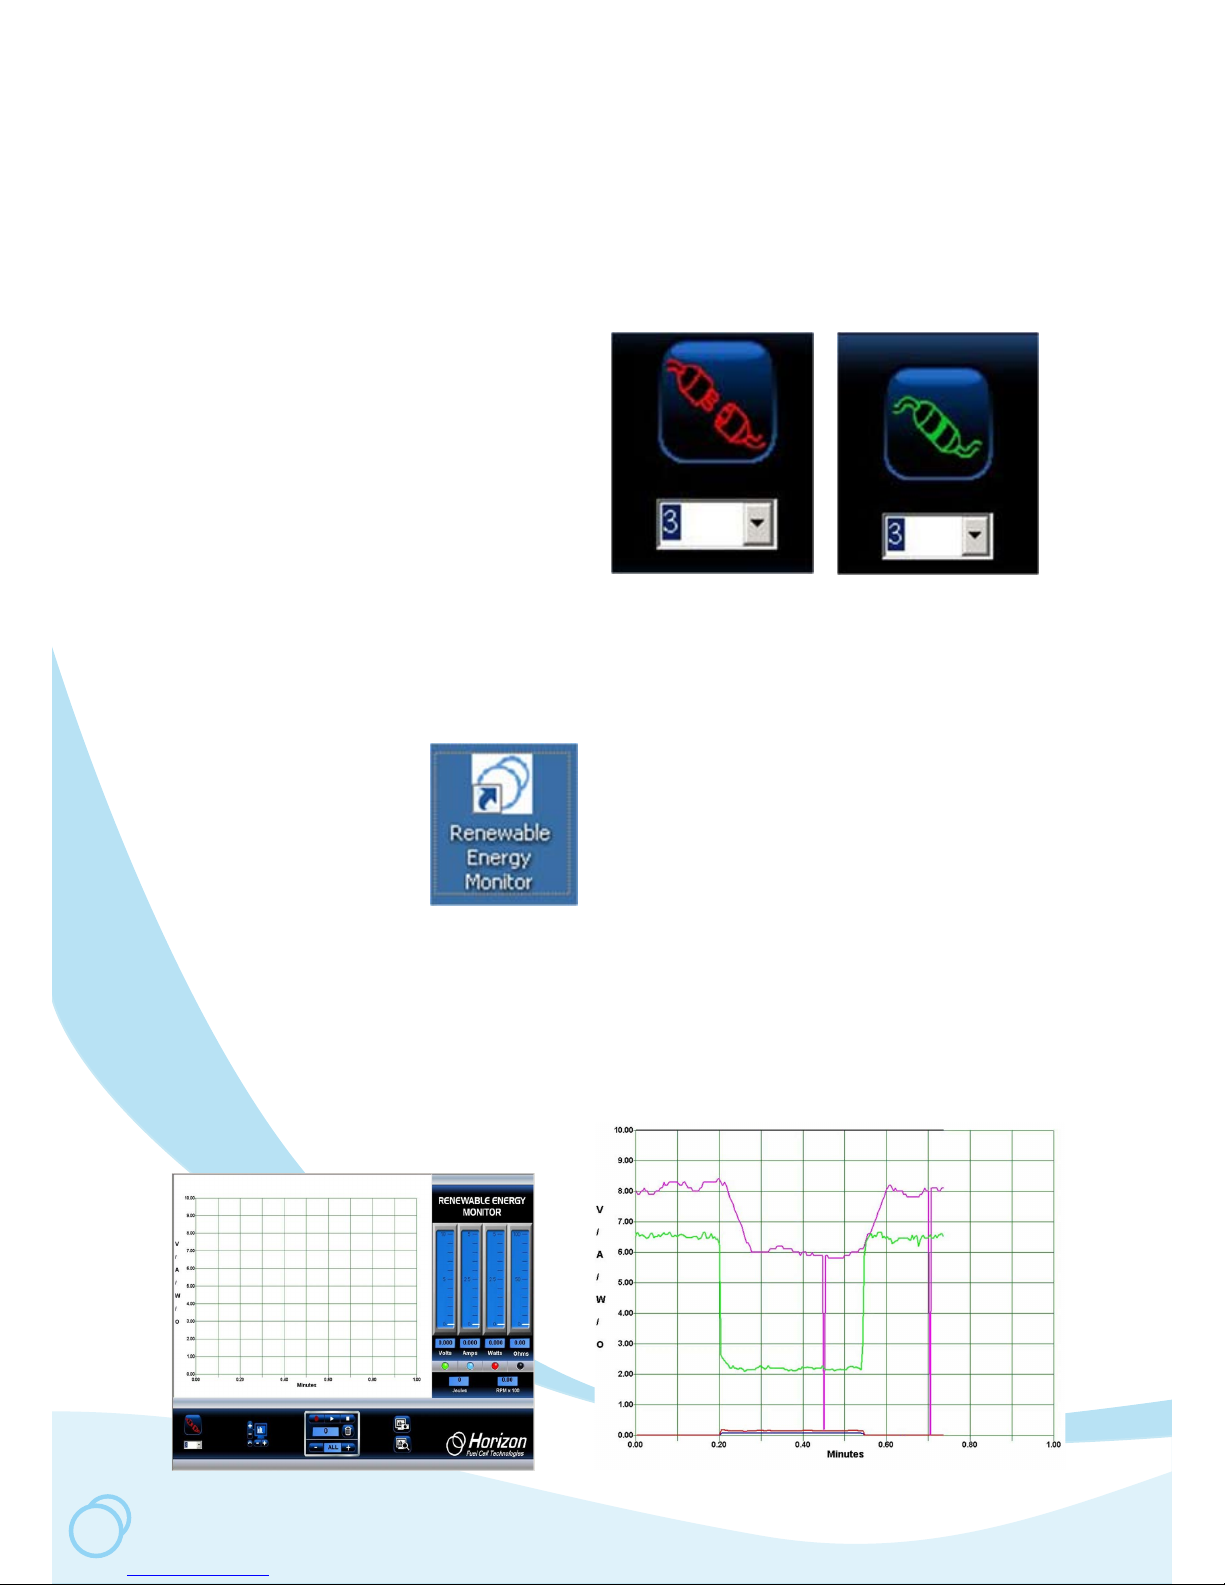
The Connect Icon
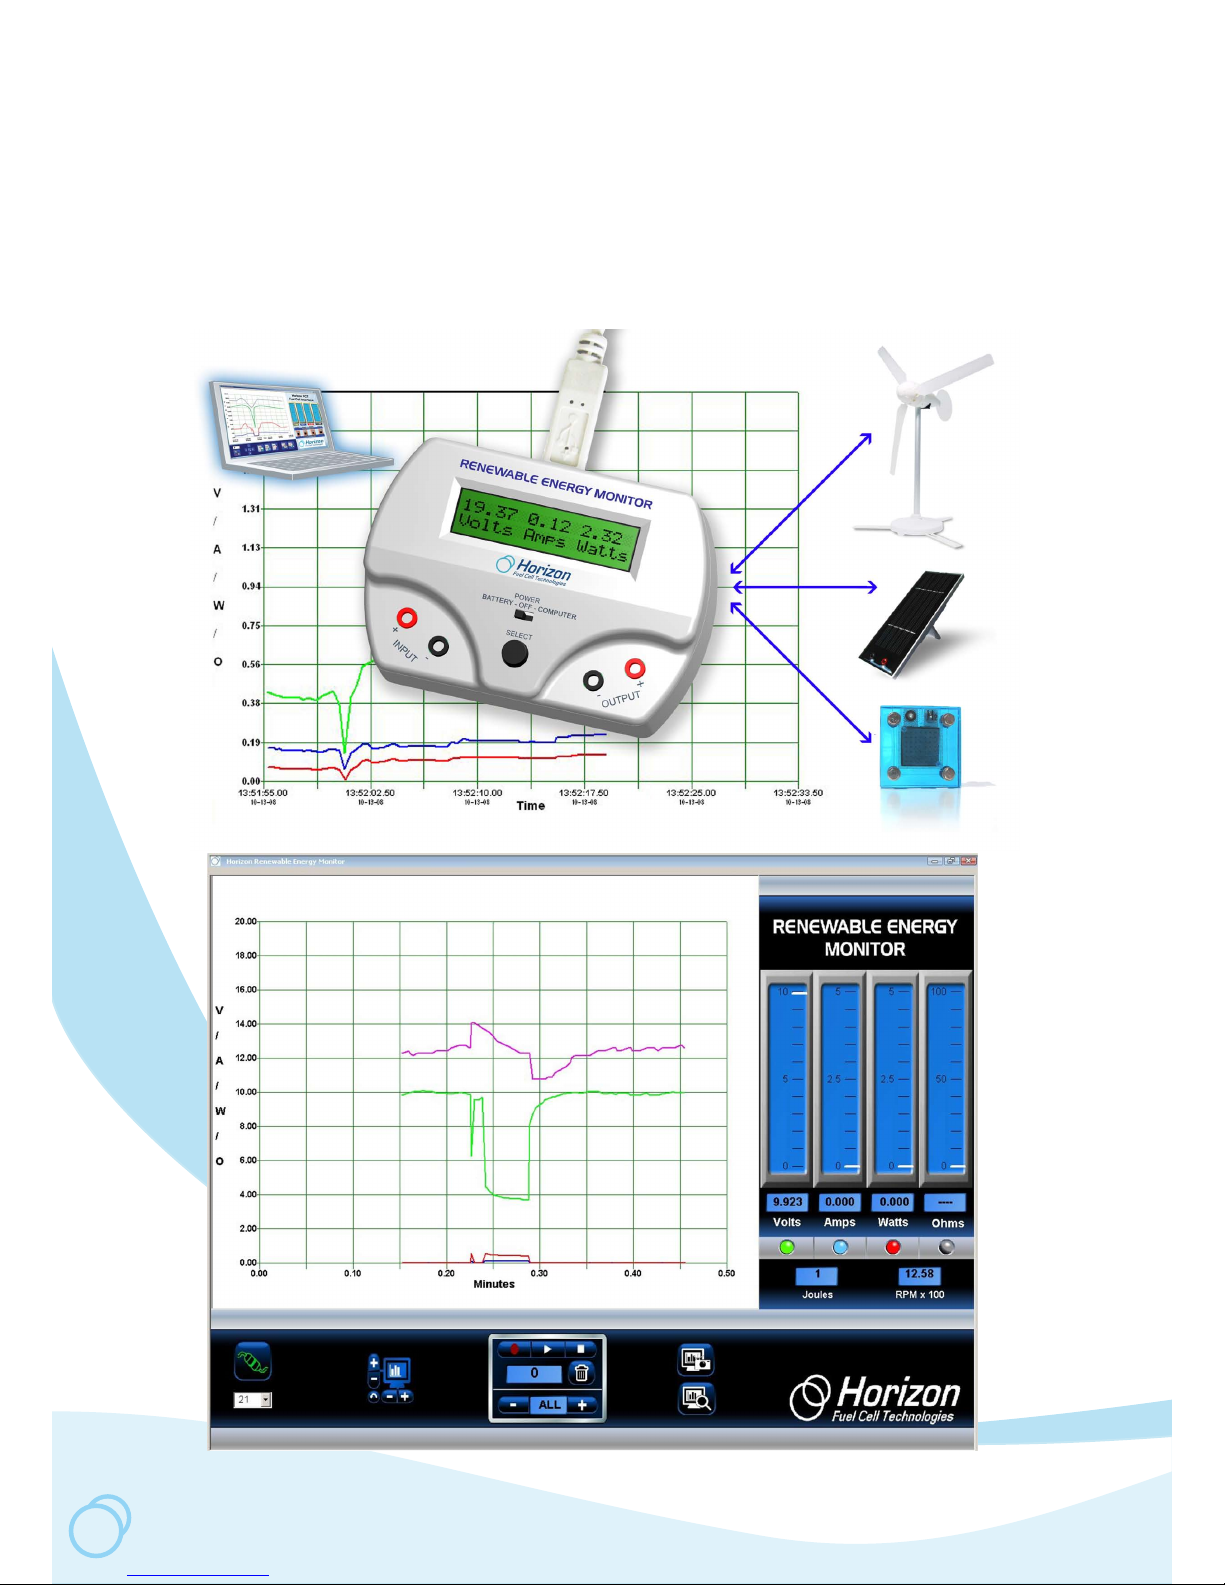
Before any plots can occur, the graphic software
must connect with the Renewable Energy
Monitor that is transmitting data.
Normally the number just below the Connect icon
is the right com port number; however, sometime
you must select a different number to make the
plotting work.
the correct Comm port on your PC by going to
Control Panel -> System -> Hardware Manager
-> Device Manager then click on Comm port.
Since you are using a USB connection rather than
the traditional RS-232 connection, the Comm port
number is not dependent on hardware so much,
but rather on software settings in the Control
Panel of the Windows operating system.
To do so, first select the
correct Comm port number.
Click on the arrow next
to the number to see if
a higher number Comm
port is displayed. If so,
it’s probably the one to
use. When in doubt, nd
When correct, the Connect
icon will show that the
connection is made. If the
Comm port is still not correct
an error message will be
displayed, which is usually
due to the Comm port already
in use by another Windows
application.