CONTENTS
SECTION PAGE
1
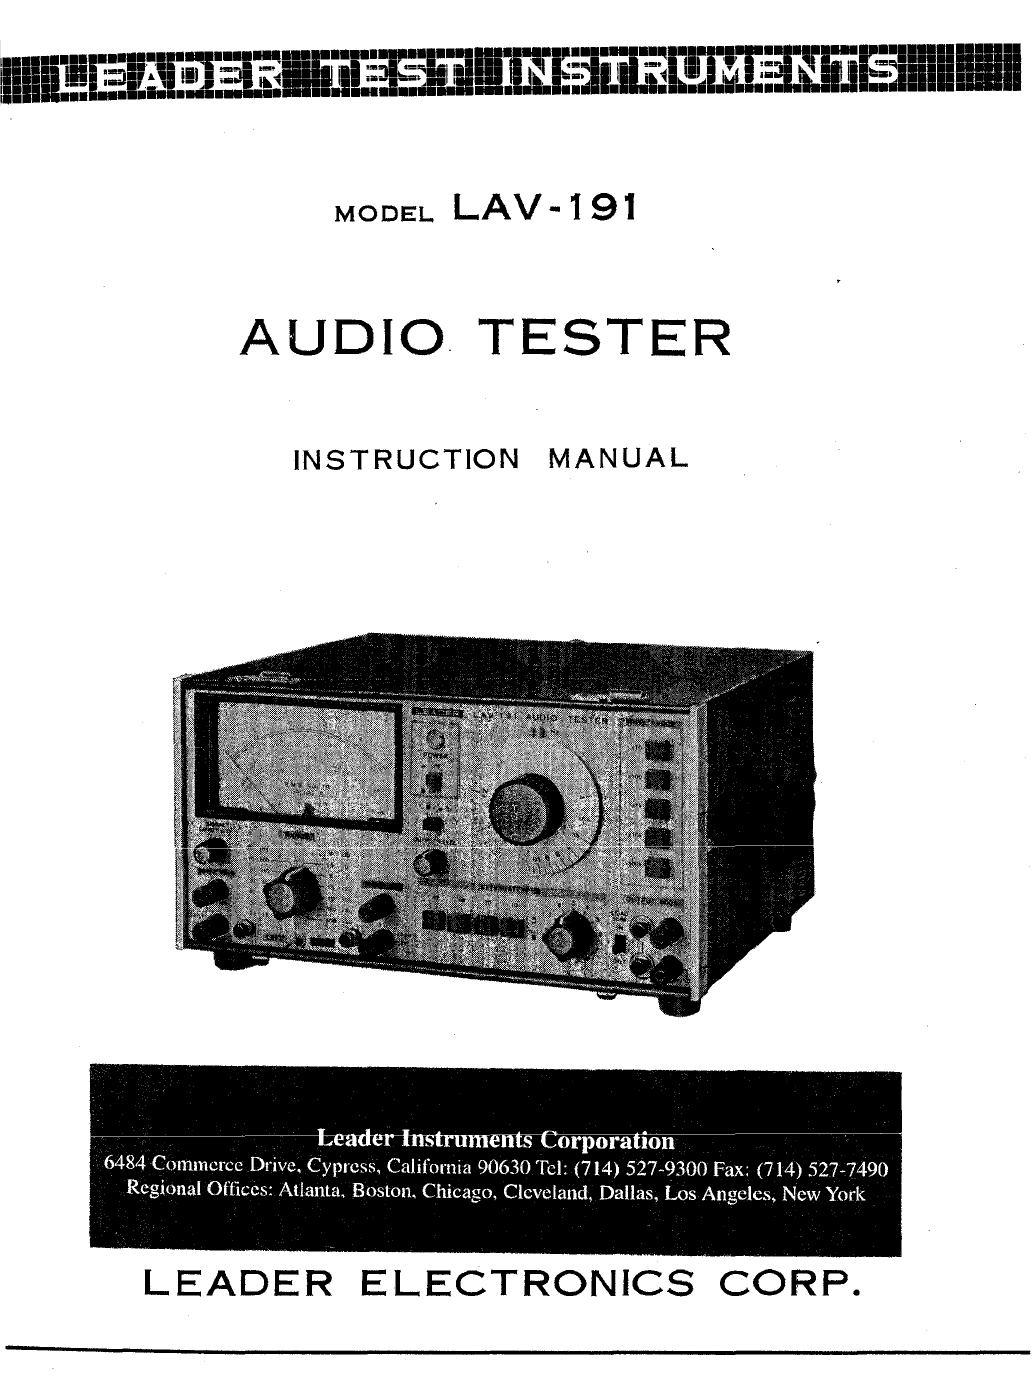
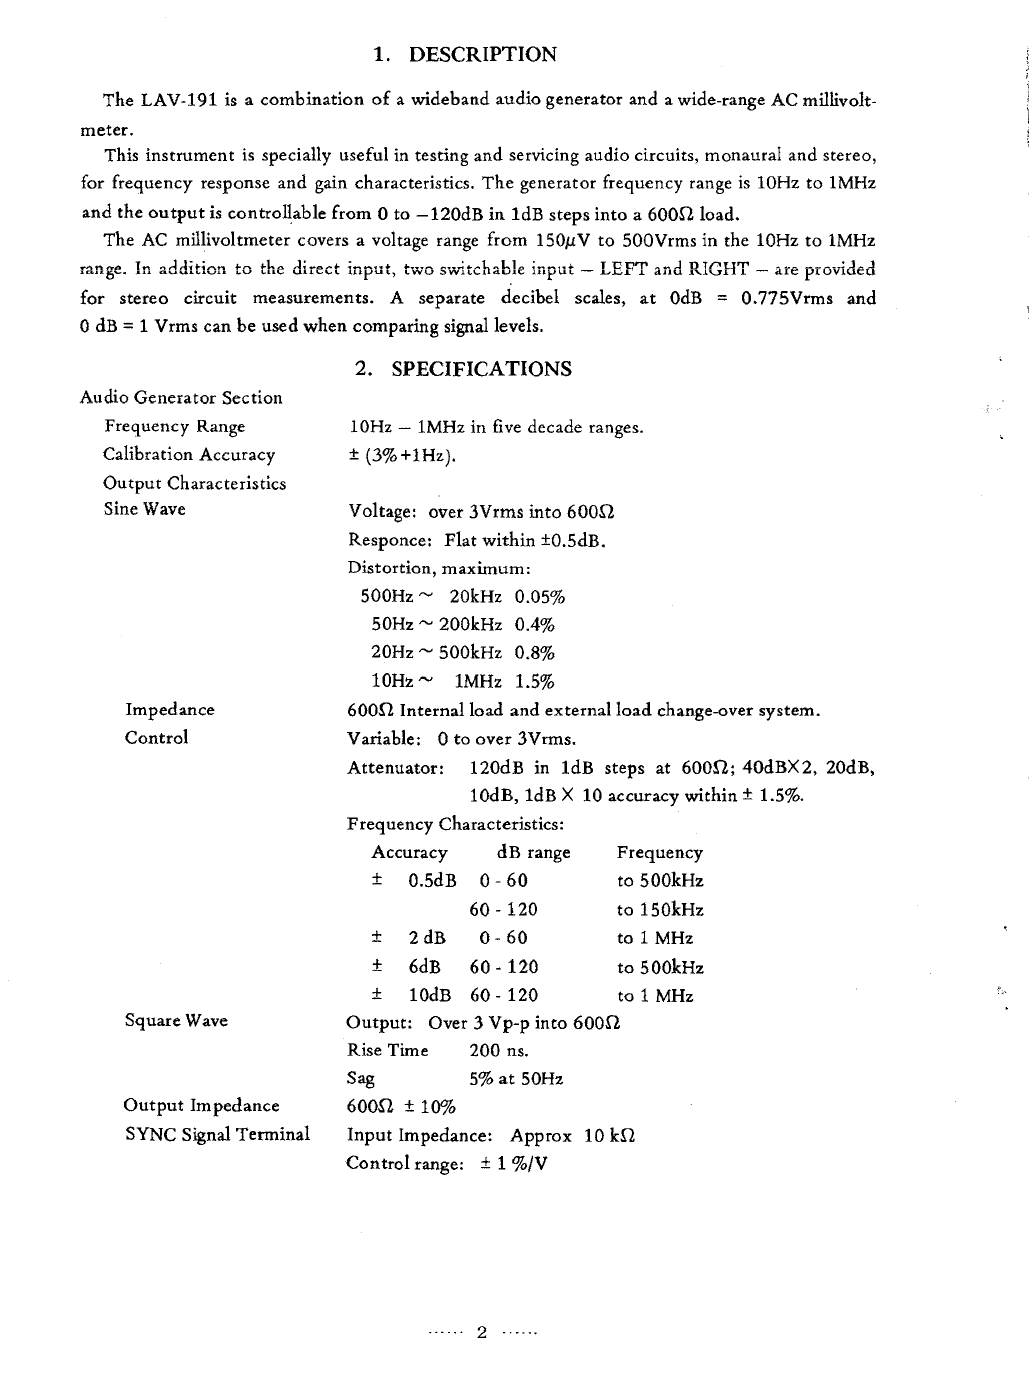
DESCRIPTION
2
2 SPECIFICATION . . . . . . . . . . . . . . . . . . . . . . . . . . . . . . . . . . . . . . . . . . . . . . . . 2
3
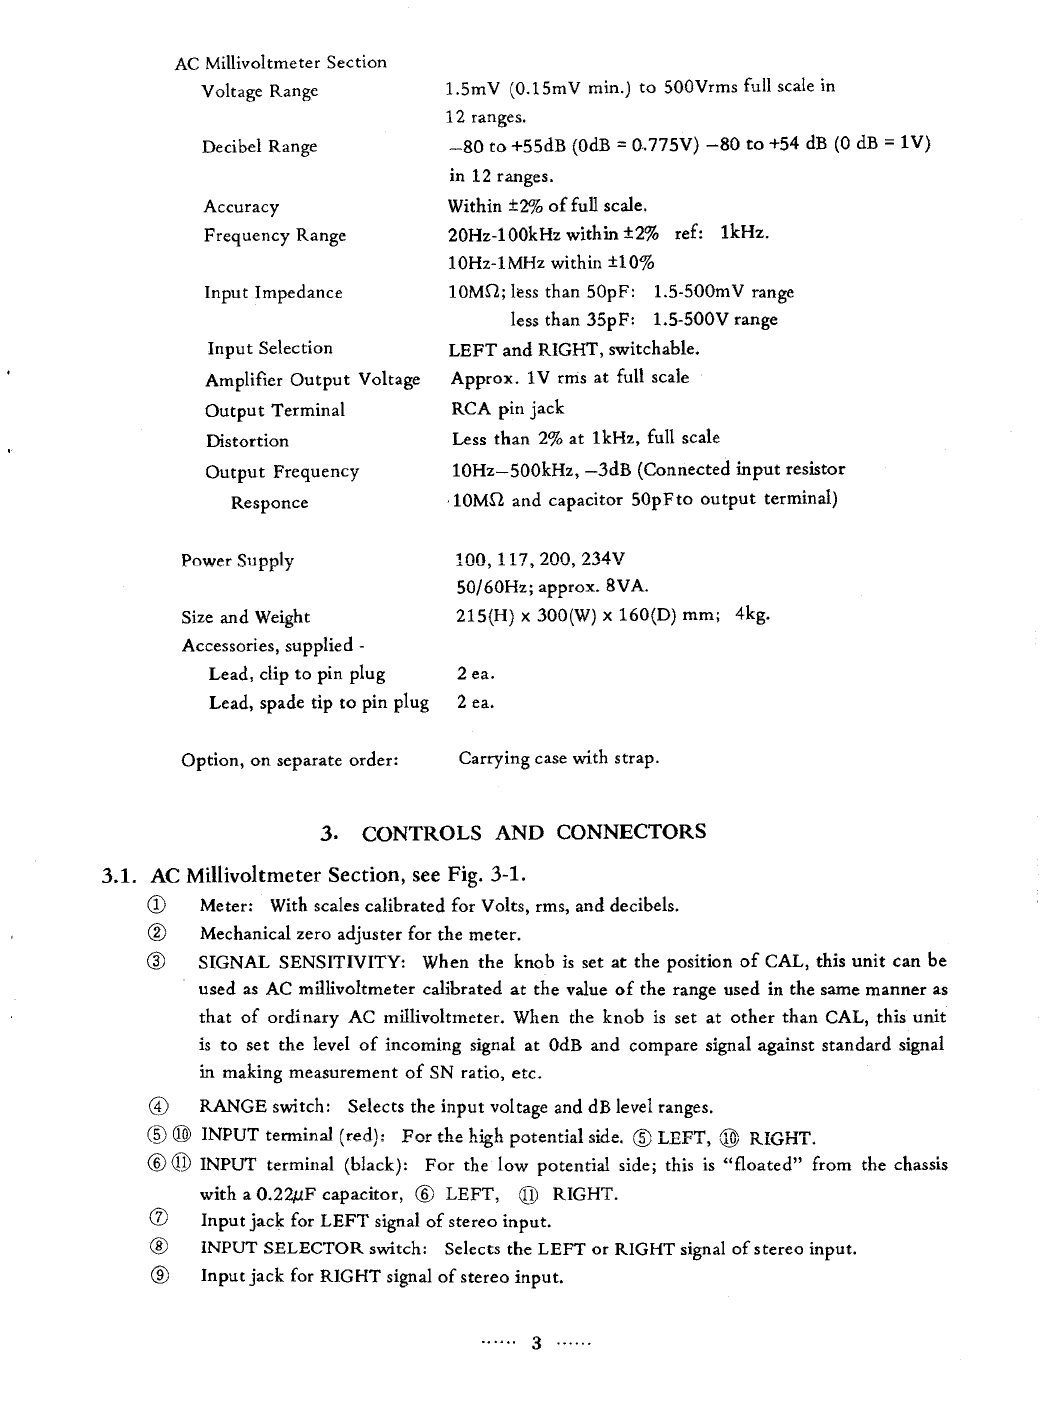
CONTROLS
AND
CONNECTORS
3
3.1 AC Millivoltmeter
Section
3
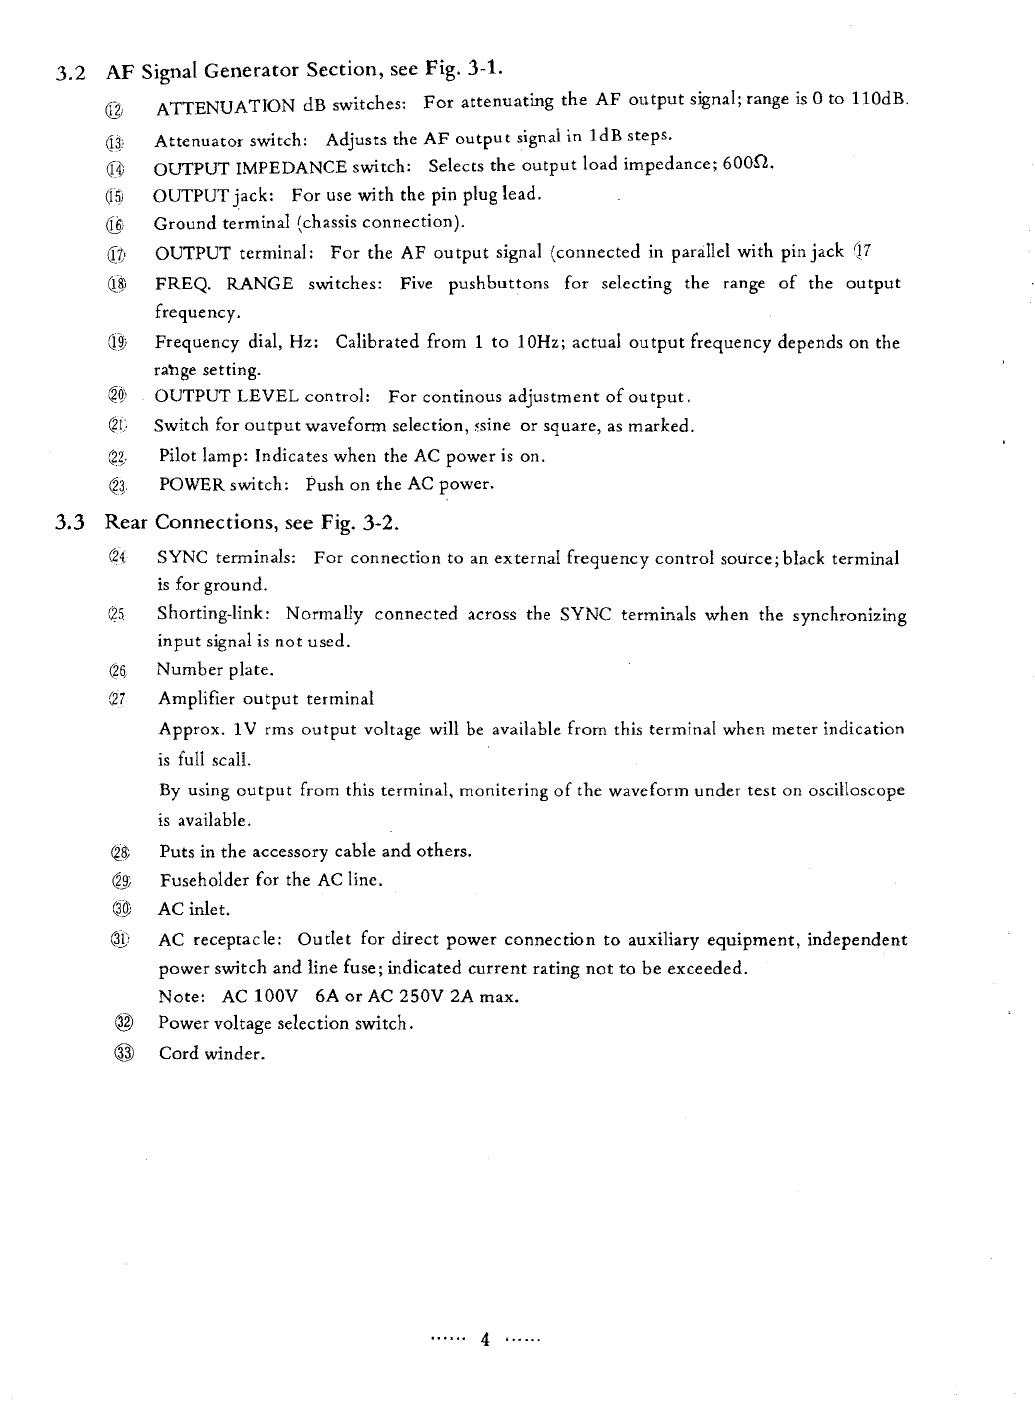
3.2
AF
Signal
Generator
Section
. . . . . . . . . . . . . . . . . . . . . . . . . . . . . . . . 4
3.3
Rear
Connections
..........
, . . . . . . . . . . . . . . . . . . . . . . . . . . . . . . 4
4
OPERATION
. . . . . . . . . . . . . . . . . . . . . . . . . . . . . . . . . . . . . . . . . . . . . . . . . . . 5
4.1 Initial Checks . 5
4.2
AF
Signal
Generator
. . . . . . . . . . . . . . . . . . . . . . . . . . . . . . . . . . . . . . 5
4.3
AC Miiiivoitmeter . . . . . . . . . . . . . . . . . . . . . . . . . . . . . . . . . . . . . . . . 8
4.4
Typical
Applications . . . . . . . . . . . . . . . . . . . . . . . . . . . . . . . . . . . . . .
10
5 MAINTENANCE . . . . . . . . . . . . . . . . . . . . . . . . . . . . . . . . . . . . . . . . .
12
-
·-
...
1
.....
.