PERSEE T8DS User manual

Analytical
Instruments
for
Science
T8DS
USER MANUAL
U V -VIS SPECTROPHOTOMETER

Introduction
Thank you for your purchase of the Persee Analytics Inc. T8DS
spectrophotometer.
UV-Visible Spectrophotometer analysis is a well-accepted, documented technique with
many applications. The technique is extensively used for the analysis of agricultural products,
public health, environmental protection, life science industries and many other organic and
biochemical applications.
For obtaining maximum performance and trouble-free operation, please see the following
suggestions:
Upon receiving your instrument, please check that all the items listed in the
packing list are included and install the instrument according to the instruction
manual.
The spectrophotometer is a precise electronic instrument. Please read the
instruction manual carefully before operation. If the equipment is used in a manner
not specified by the manufacturer, the protection provided by the equipment may
be impaired.
Avoid impact and handle the instrument carefully during transportation.
If the tested solution is harmful to humans, please wear gloves or use other
protection methods.
Please keep the accessories in a safe place for the use in future maintenance.
For more information, please visit www.perseena.com

Contents
Contents ........................................................................................................................................ I
Chapter 1 Instrument Introduction............................................................................................. 1
1.1 Components inspection ................................................................................................... 1
1.2 UV/Vis spectrophotometer and method........................................................................... 1
1.2.1 UV/Vis spectrophotometer method......................................................................... 1
1.2.2 UV/Vis spectrophotometer...................................................................................... 1
1.2.3 Condition of measure method ................................................................................ 2
1.3 Components description.................................................................................................. 3
1.3.1 Front view............................................................................................................... 3
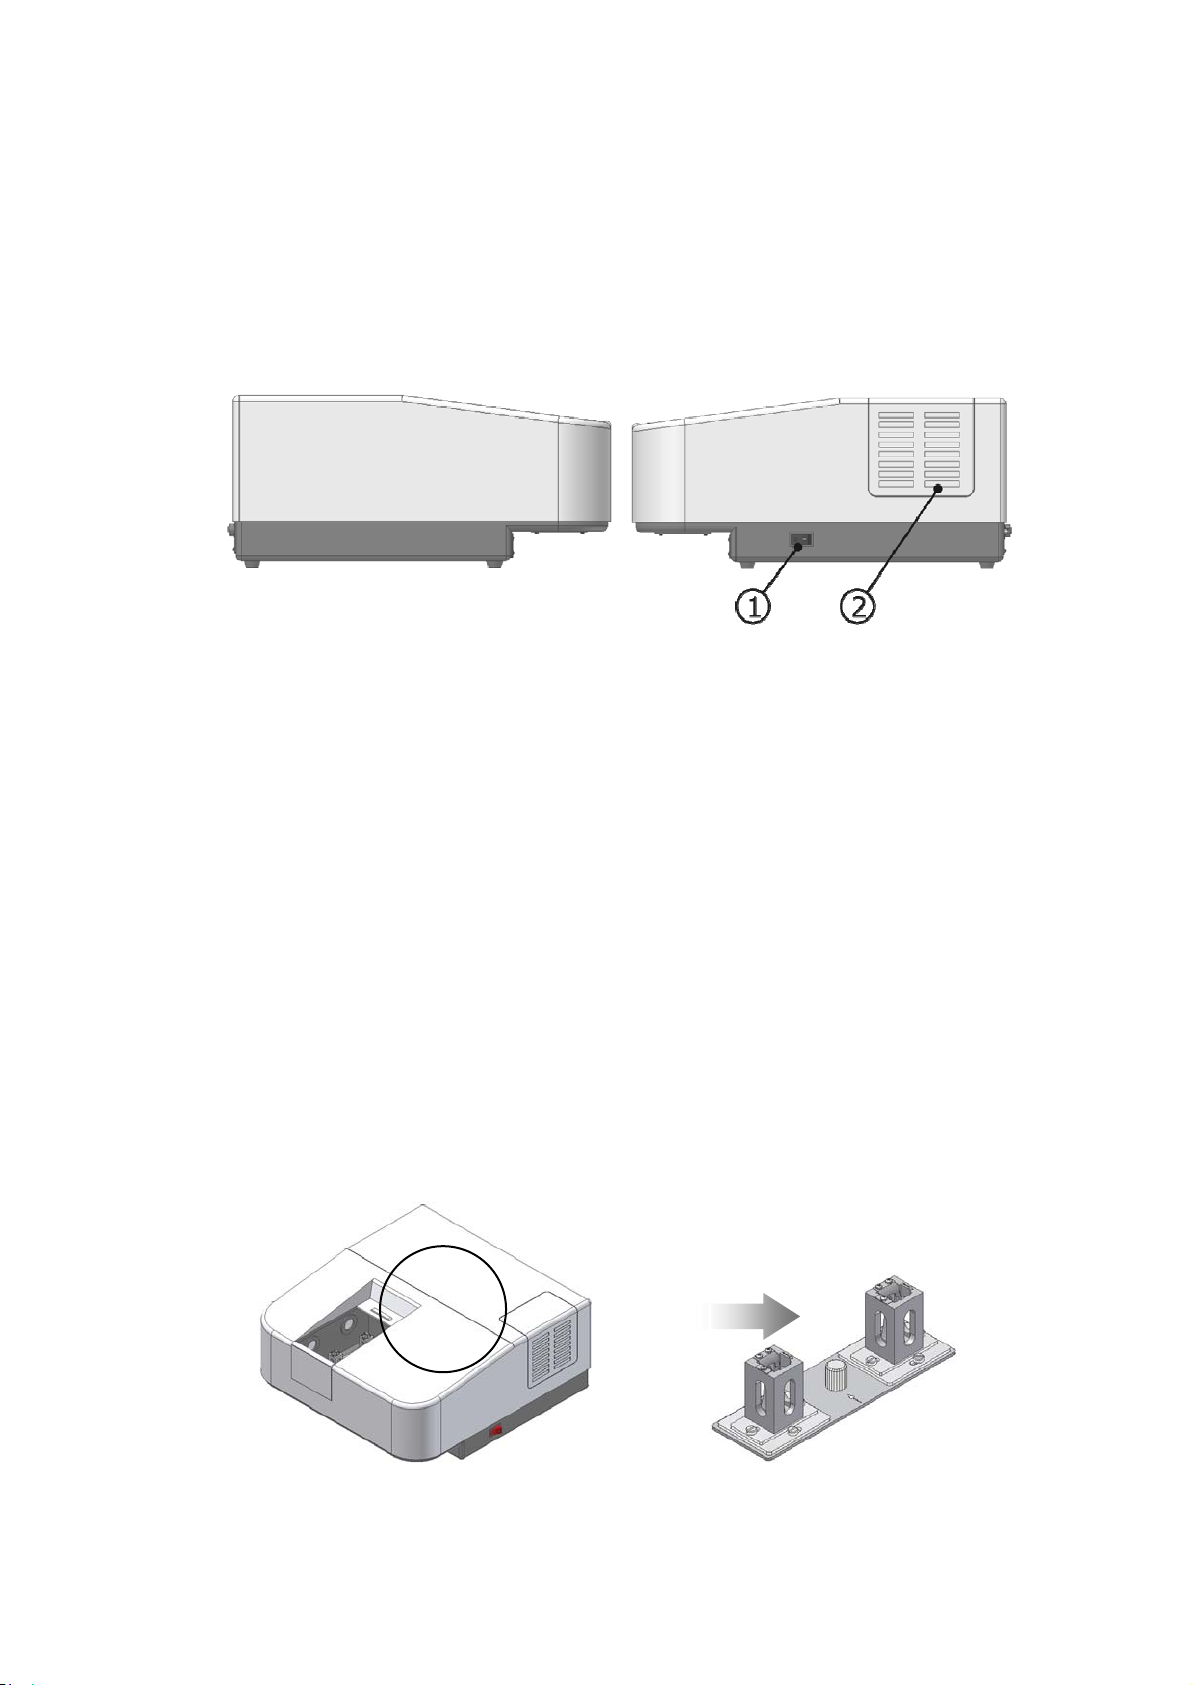
1.3.2 Rear view ............................................................................................................... 4
1.3.3 Side view ................................................................................................................ 5
1.3.4 Sample cell holder .................................................................................................. 5
1.4 Specifications .................................................................................................................. 6
Chapter 2 Installation .................................................................................................................. 7
2.1 Installation location ........................................................................................................ 7
2.2 Installation ..................................................................................................................... 7
2.3 Start ............................................................................................................................... 9
2.4 Installation performance .............................................................................................. 10
2.4.1 The accuracy and reproducibility of wavelength................................................... 10
2.4.2 Flatness of the baseline........................................................................................ 12
Chapter 3 Instrument operation ............................................................................................... 13
3.1 About double beam measurement............................................................................... 13
3.1.1 What is double beam............................................................................................ 13
3.1.2 How to use a double beam instrument ................................................................. 14
3.2 Application examples................................................................................................... 15
3.2.1 Photometric measurement example ..................................................................... 15
3.2.2 Spectrum measurement example......................................................................... 16
3.2.3 Quantitative measurement example ..................................................................... 18
Chapter 4 Optional accessories ............................................................................................... 22
4.1 CH19-1 Thermostatic cell holder ................................................................................... 22
4.2 DS19-1 Angle-changeable solid sample holder............................................................. 23
4.3 IS19-1 Integrating sphere .............................................................................................. 24
4.4 LS19-1 Long pathlength cell holder............................................................................... 25
4.5 MH19-1 Micro cell holder............................................................................................... 26
4.6 MH19-2 Ultra-micro cell holder...................................................................................... 27
4.7 MR19ˉ1 Specular reflection accessory........................................................................ 28
4.8 MS19-1 Manual 8-cell holder......................................................................................... 29
4.9 PS19-2 Sipper pump ..................................................................................................... 30
4.10S19-1 Solid sample holder ............................................................................................ 32
4.11SS19-1 Short pathlength cell holder .............................................................................. 33

4.12TR19-1 Test tube cell holder.......................................................................................... 34
Chapter 5 Maintenance ............................................................................................................. 35
5.1 Points for attention:........................................................................................................ 35
5.2 Daily care ...................................................................................................................... 35
5.3 Trouble shooting and maintenance ............................................................................... 36
Appendix 1 Light source replacement.................................................................................... 40
Replace the tungsten lamp............................................................................................ 40
Replace the Deuterium lamp ......................................................................................... 42
Appendix 2 Fuse replacement .................................................................................................. 44

Chapter 1 Instrument Introduction
1.1Components inspection
After the instrument has been unpacked, please check carefully all the parts
provided against the packing list. In the event of error or damage, contact your local
sales agent immediately. A complete set with the instrument according to the packing
list should be supplied.
The company keeps the right to revise the packing list.
1.2UV/Vis spectrophotometer and method
1.2.1 UV/Vis spectrophotometer method
A UV/Vis spectrophotometer instrument analysis method measures the
molecular absorbance of radiation in ultraviolet and visible spectrum. The absorption
of the molecules corresponds to the excitation of valence electrons and electrons in
the molecular orbital between different electronic energy levels. The analysis methods
can be used for quantitative analysis of organic and inorganic compounds.
Lambert-Beer’s law is the basic law of radiation absorbance; it is the foundation
of spectrophotometer analysis methods. The absorbance (A) of a solution is directly
proportional to the path length (b) and the concentration (c) when the wavelength of
the incidence light is fixed. Lambert-Beer’s law states that ClA
H
, where
H
is
the constant of proportionality, called the absorbtivity.
1.2.2 UV/Vis spectrophotometer
The UV/Vis spectrophotometer is a general purpose analysis instrument which
can be used for all types of basic spectrophotometer methods. It spectrophotometer
can be classified by single beam spectrophotometer, double beam
spectrophotometer, and double wavelength spectrophotometer according to the
difference of optical structure.
All types of UV/Vis spectrophotometers are constructed with five basic
component, they are light source, monochrometer, cell holder, detector and signal
processing system.

1.2.3 Condition of measure method
The choice of measuring wavelength
Normally taking the wavelength which has the most absorbance as the
measuring wavelength ( max
O
) to attain the highest analysis sensitivity is called
maximum absorbance principle. The absorbance will change very little during the
wavelength’s change around the max
O
, giving a good precision. we can take the low
sensitivity measuring wavelength as the absorption peak wavelength when
measuring high concentration compounds, in order to guarantee the corrective curve
has enough linear range. If the absorption peak in the wavelength max
O
is too thin,
we can adopt a little lower sensitivity wavelength to measure the condition that
satisfies the need of analysis sensitivity, which is to decrease the deviation of Beer’s
Law.
The choice of absorbance range
Because of the instability of the light source, inaccuracy of the readings, or
alternation of lab condition in the measurement, any photometer has some measuring
error. Because the transmittance T in the absorbance law is a negative logarithm to
the concentration C, from the curve of negative logarithm we can see, the relative
error of the same transmittance in a different concentration is different. The relative
error is very big when the concentration is too high or too low, so we should choose
the correct absorbance range to reduce the relative error of the results.
In practice, we can adjust the concentration of the solution or the length of the
cell to make sure that the absorbance as in the required range.
The choice of bandwidth
Bandwidth will affect the sensitivity of the measurement and linear range of
correction curve. If the bandwidth is too wide, the monochromatic light of incidence will
be less, the correction curve will deviate from Beer’s Law, and the sensitivity will be
lower. If the bandwidth is too narrow, the gain of the instrument will be very high and
the noise will be increased. We should choose the correct bandwidth by looking at the
scan of a peak and the amount of absorption for the given standard solution to be
analysed.

1.3Components description
Figure 1.1 shows the basic T8DS instrument.
Figure 1.1 Instrument
1.3.1 Front view
The front view is shown in Figure 1.2, the name and function of all the
components are described below:
Figure 1.2 Front view

1. Instrument cover
2. Front panel of the sample compartment—standard front panel for the
sample compartment. It can be replaced when using some accessories.
3. Chassis—the steel chassis can greatly reduce vibration.
4. Instrument label
5. Sample compartment cover—Open the cover to gain access to the sample compartment.
1.3.2 Rear view
The rear view is shown as Figure 1.3, the name and function of all components are
described below:
Figure 1.3 Rear view
1. Fan
2 Foot—Shockproof rubber washer is used.
3 RS-232 interface—Communication with PC.
4 Power supply— Connect to power supply: AC 110V, 60Hz.
5Fuse 1—Can be replaced (refer to “Appendix 3 fuse replacement”).
6Fuse 2—Can be replaced (refer to “Appendix 3 fuse replacement”).
7Instrument nameplate

1.3.3 Side view
The side view is shown as Figure 1.4, the name and function of all components is
described below:
A Leftsideview BRightsideview
Figure 1.4 Side view
1. Powerswitch
2. Light source cover—Open the cover to gain access to the light source,
For replacing the deuterium lamp and tungsten lamp (refer to “Appendix 1
light source replacement”).
1.3.4 Sample cell holder
The sample cell holder is configured according to the user’s requirements. The
general configuration is the fixed two cell holder. Other types of cell holders are
available. Please refer to “chapter 4Accessories” for detailed information.
The following figure 1.5 shows the fixed cell holder which is used as the standard
configuration. It has two standard holders which are used for the sample cell and
reference cell.
Figure 1.5 Fixed cell holders

1.4Specifications
Figure 1-3
Item Specification
Wavelength
range 900nm190nm
Spectral
bandwidth 5nmǃ2 nmǃ1 nmǃ0.5 nmǃ0.2 nmǃ0.1nm ( 6 steps)
Resolution 0.01nm
Setting
wavelength
The start and end wavelength can be set by the span of
1nm. The goto-wavelength operation can be set by the
span of 0.1nm.
Wavelength
accuracy ±0.3nm (with built-in automatic correction)
Wavelength
reproducibility 0.1nm
Wavelength of
lamp change
Set the wavelength of lamp change within the scope of
322-392nm at 1nm interval
Photometric
system
Double beam, dynamic feedback direct ratio recording
system
Photometric
scope Absorbance: -44 Abs
Recording
scope
Absorbance: -9.9999.999 Abs
Transmittance: -999.9999.9 %T
Photometric
Accuracy
±0.002Abs (00.5Abs)
±0.004Abs (0.51.0Abs)
±0.3%T (0100%T)
Photometric
reproducibility
0.001Abs˄00.5A˅
0.002Abs˄0.51A˅
0.15 %
Stray light 0.02%T˄220nm NaI 10g/L˅
Baseline
flatness
±0.001 Abs ( scan with 850~200nm, with medium
speed, at 2nm spectrum bandwidth )
Stability 0.0004 Abs/h (2hr warm-up, kinetic scan at 500nm with
2nm spectrum bandwidth)
Noise 0.0005 Abs (500nm, with 2nm spectrum bandwidth)
0.2ˁ(500nm with 2nm spectrum bandwidth)
Note:
1. The above specifications are taken with a 2nm spectrum
bandwidth. The specification may vary with different bandwidths
2. The above specifications are subject to change without notice.

Chapter 2 Installation
2.1 Installation location
T8DS double-beam UV/Vis spectrophotometer is a versatile high-precision
laboratory instrument. For its optimum performance and its usable longevity, the
instrument should be installed in a suitable location with the following requirements:
Avoid high temperature and high humidity environment. An environmental
temperature should be 15C 35C. The relative in-door humidity should be
45 85%.
The instrument should be placed on a sturdy workbench that is free of a
strong vibration.
The location room should be free from strong electromagnetic interference
and harmful or poisonous gases.
Power Supply: 110V±10%, 60Hz±1Hz. A voltage regulator (500VA) should
be used if the supply is noisy or irregular. A satisfactory earth connection
should be ensured.
2.2 Installation
T8DS comprises of three major components:
1. A UV/Vis spectrophotometer main unit.
2. An IBM-compatible Personal Computer complete with monitor and keyboard.
The computer can be supplied by user but an RS232 socket should be available.
3. Software: The operating software is UVWin. This should be setup and installed at
the computer with attention to the S/N which is supplied with the instrument. For
detailed information please refer to the UVWin manual.
The connections should be carried out as shown in Figure 2.1:

Figure 2.1
Connect the instrument’s RS 232 communication port to the PC with RS 232 cable.
Connect the printer’s parallel port or USB port to the PC with communication cable,
and setup the printer driver in the PC (the detailed information refer to the printer
manual)
Both ends of all the connecting cables should be securely tightned to the sockets
to prevent poor connection.
Connect the power cords of the instrument, PC, and printer to the power supply
connector. (Note: make sure that the rating of the power source is 110VAC 60 HZ.)
Note: The spectrophotometer is a precision electronic instrument.
Take care not to pull out or insert the power cable when the
instrument is switched on, as this could cause serious
damage to the instrument or the computer.

2.3 Start
Make sure there is nothing installed in either of the sample cells which could
block the light path.
Turn on the power for the printer, then the power for the computer and finally the
power for main unit. The computer will start OS automatically. Select UVWin software
in the Start menu. The instrument will start to Self Check providing it detects the
instrument, (shown as figure 2.2). If the software shows: “Warning: Unable to
communicate with main unit……” before the self check, it means that the software
cannot communicate with the instrument. Please check the instrument and PC
communication connection. Restart the instrument and choose “Retry” menu.
Figure2.2 Initialization
After self checking, enter main working program (shown as figure 2.3). The
analysis should be carried out after a preheat time of 60 minutes after switching on the
instrument in order to insure the precision of the results. For detailed operation we
recommend that you are familiar with the operation of the instrument and the software
by referring to this instruction manual, The UVWin software or help document in the
software menu.
After the analysis is complete, the power can be switched off by first turning off the
power supply for main unit, then the power supply for printer, at last the power supply
for computer.
Note:
If an error occurs during the initialization after power on, please try and
restart the instrument. If it still cannot initialize normally, please contact
your local distributor or service center.

Figure 2.3 UVWin interface
2.4 Installation performance
Performance checks of the instrument should be carried out after installing the
instrument. During the course of its life, periodical tests should also be made. The
checks should only be carried out after preheating the instrument for at least 60
minutes after switching on. The testing method can be performed as the instructions
below.
2.4.1 The accuracyand reproducibilityof wavelength
The wavelength accuracy of the instrument is ±0.3nm whereas its reproducibility
is 0.1nm (Please refer to the Chapter 1.4 Specification). The test should be made in
the following manner by using the two characteristic spectrum lines of the deuterium
lamp.
Set the parameters by using the spectrum scan function (refer to UVWin software
manual) as shown in table 2-1 and table 2-2:
Note:
There may be some drifting of the instrument during the preheating, so
please carry out wavelength correction and dark current correction prior
to analysis in order to obtain the best accuracy. For more detailed
instruction please refer to the UVWin software manual.

Table 2-1δ656.1nm characteristic spectrumε
Scan parameter Comment
Photometric Es Energy for sample light
Scan speed Medium
Sample interval Automatic 1nm
Energy condition D2 lamp, gain 2 /3 Reference
Wavelength range 660650 nm
Vertical coordinate
range 0100
Instrument parameter Comment
Spectrum 2.0nm Fixed or variable
Table 2-2δ486.0nm characteristic spectrumε
Scan parameter Comment
Photometric Es Energy of sample light
Scan speed Medium
Sample interval Automatic 1nm
Energy condition D2 lamp, gain 2/3 Reference
Wavelength range 490480 nm
Vertical coordinate
range 0100
Instrument parameter Comment
Spectrum bandwidth 2.0nm Fixed or variable
Scan three times and pick the peaks. Note the three peaks and calculate the
accuracy of the wavelength.
Calculate the mean value of wavelength
O
according to the formula
Formula: ¦
n
i
i
n1
1
OO
i
O
—— measured value of wavelength
n—— measured times, here n=3
The difference in value between the mean value and the standard value is the
wavelength accuracy.
The difference in value between the maximum and the minimum is the wavelength
reproducibility.

2.4.2 Flatness of the baseline
Testing method: Check that the sample beam is blank (empty with no solution). Then
set the measuring parameters by using the spectrum scan function (refer to the
UVWin software manual) as shown in table 2-3
Table 2-3δmeasure the flatness of baselineε
Scan parameter Comment
Photometric mode Abs Energy of sample light
Scan speed Slow
Sample interval Automatic 1nm
Wavelength range 900190 nm
Vertical coordinate
range -0.010.01
Instrument parameter Comment
Spectrum bandwidth 2.0nm Fixed or variable
Correct the baseline first. Then set the range of wavelength to 850-200nm, and
select start for spectrum scanning. Read the absorbance of the spectrum scan by
the graph reading function. The largest absorbance should conform to the
requirement of the flatness of the baseline specification.

Chapter 3 Instrument operation
All of the operation of T8DS is performed by the UVWin software after connection
with the PC. Please read the UVWin software manual in detail before operating. This
chapter will introduce the character of double beam measurement, and the process of
operation of the T8DS using three examples.
3.1 Double beam measurement
3.1.1 What is double beam
The T8DS double beam UV/Vis spectrophotometer has two light beams who’s
energy for the measured sample and reference are the same. This optical principle
(as shown in figure 3.1, R means reference light beam and S means sample light
beam), increases the stability and precision of the instrument by the use of the real
time feedback compensation measuring system of the reference beam.
The most differences between double beam, split beam and single beam on
structure is that the double beam instrument has two light beams in the sample
compartment. Reference and sample can be measured at the same time (as shown
in figure 3.2).

Figure 3.1 Optical Principle
Figure 3.2 Sample cell holder
3.1.2 How to use a double beam instrument
The difference between double beam and single beam (or split beam) for the
analysis is, for single beam you should put the blank and sample into the same
sample cell holder, measuring twice, for blank and sample. Double beam is read just
once for reference and sample.
For double beam instruments, put the black block into sample light beam cell holder
to do the dark current correction.
You can familiarize yourself with the operation of the T8DS by the following
examples.
Reference cell holder
Sample cell holder

3.2 Application examples
3.2.1 Photometric measurement example
Vitamin B1 can promote the metabolizability of carbohydrate and fat, provide energy
for the nervous tissue, prevent the nervous tissue from atrophy and degeneration,
prevent and cure beriberi. The quality determination method of Vitamin B1 for the
pharmaceutical industry is to measure the absorbance at 400nm; The conforming
value should be less than 0.020.
We need to select the photometric measurement function to determine the quality of
Vitamin B1 by UVWin software, the detailed operation steps follow:
:
Prepare reagent
Weight 1g Vitamin B1 in a precision microbalance. Put the 1g of Vitamin
into a 10ml volumetric flask. Add adequate distilled water to dissolve the
Vitamin B1. Select two clean matched quartz cells to fill with distilled water
as the reference solution.
Power on the instrument
Power up the PC which is connect with the T8DS, enter into the Windows
operating system. Be sure there is nothing blocking the beam of the sample
cell holder, and power on the instrument. Start UVWin software and allow
the instrument to initialize. Enter the main working program. The
measurement can only be performed after the preheat time of 60 minutes
after switching on the instrument..
Setting parameters
Select the “Photometry” function and enter into the parameter setting
interface. Set the parameters as follows:
Table 3-2 (Photometric measurement example parameter settings)
Measurement parameters Instruction
Photometric mode Abs
Measurement wl 400nm
Instrument parameter Instruction
Spectral bandwidth 2.0nm Fixed or variable

Dark current correction
Insert the black block into the sample cell holder, to carry out the dark current
correction using the dark current correction function of the UVWin software.
Take out the black block after correction.
Note Dark current correction can eliminate some noise of the
instrument, and insure the precision of result. This does not have to be
carried out for every measurement, only when the environment has
been changed, such as the temperature, the location, measuring high
absorbance sample and so on. (we advise that you perform the dark
current correction after preheating and before measurement.)
Zero
Put the two matched quartz cells which are filled with distilled water into the
sample light beam cell holder and reference light beam cell holder. Cover the
sample compartment and press the “Zero” button of the UVWin software.
The absorbance shown on the top of the main page should be 0.000 Abs.
Measure the sample
Take the cell out of sample cell holder, and replace the distilled water with
the Vitamin B1 solution. Be sure to wash out the cells between samples. Put
the cell into the sample cell holder and cover the sample compartment.
Press the “Start” button of the UVWin software to perform the measurement.
After finishing the measurement, press “Start” again to measure the next
data. The result can be made more accurate by the averaging of several
measurements.
Analyze the result
The result can be saved as a special file format of UVWin software for
checking and printing later.
3.2.2 Spectrum measurement example
Vitamin B12’s characteristic absorption peak is at 361nm, so the quality determination
method of Vitamin B12 is to measure the absorbance at 361nm. The detailed
operation steps of determining the absorption peak of Vitamin B12 by T8DS is as
follows:
Prepare reagent
The Vitamin B12 solution can be mixed with distilled water according to the
proportion of 1:10 to obtain a 10ml diluted solution. Prepare two clean
matched quartz cells to fill with distilled water as the reference solution.
Table of contents
Other PERSEE Measuring Instrument manuals