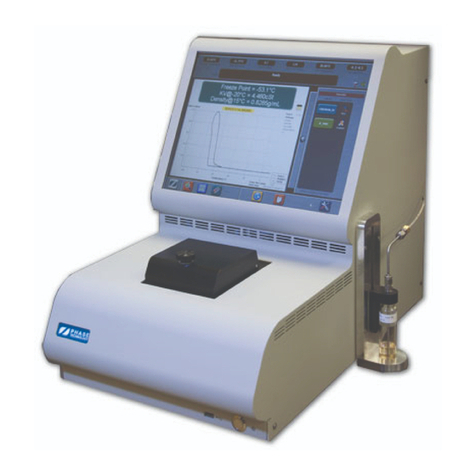
Phase Technologies JFA-70X User manual

JFA-70Xi
COLD FLOW PROPERTIES
ANALYZER SYSTEM
USER GUIDE

70Xi Cold Flow Properties Laboratory Analyzer User Guide
2
NOTICE OF PROPRIETARY INFORMATION
AND COPYRIGHT
Copyright © 2014 Phase Technology. All rights reserved. No part of this publication, or any software
included with it, may be reproduced, stored in a retrieval system, or transmitted in any form or by any
means, including photocopying, electronic, mechanical, recording or otherwise, without the prior written
permission of this copyright holder, Phase Technology.
The following document contains proprietary information of Phase Technology. These contents are
confidential and any disclosure to persons other than the officers, employees, agents or sub-contractors of
the owner or licensee of this manual, without the prior consent of Phase Technology, is strictly prohibited.
Phase Technology
11168 Hammersmith Gate
Richmond, BC, Canada V7A 5H8
Phone: 604-241-9568
Fax: 604-241-9569
www.phase-technology.com
Customer Service & Support:

70Xi Cold Flow Properties Laboratory Analyzer User Guide
3
TABLE OF CONTENTS
Section 1:
How to Connect and Power On the Analyzer 6
Section 2:
HowtoPrepareTestSamples 8
Section 3:
How to Run Tests Using Pre-defined Favorites 8
Section 4:
How to Change Test Settings 10
Section 5:
HowtoCreateandModifyFavorites 11
Section 6:
How to View Test Results 12
Section 7:
HowtoViewPhasePlots 12
Section 8:
How to Use QC Chart Limits, Sample Specifications,
and Trending of Test Results 13
Section 9:
How to Change User Level Access 17
Section 10:
How to Shut Down and Restart the Analyzer 19
Section 11:
How to Use the Analyzer’s Connectivity Features 19
Section 12:
How to Calibrate Viscosity 24

70Xi Cold Flow Properties Laboratory Analyzer User Guide
4
AppendixA.HowtoUseDrySac 28
Appendix B. Cleaning & Routine Maintenance 29
Appendix C. FAQ: Calibration, Recertification and Maintenance 32
Appendix D. Understanding & Using Phase Plots 34
Appendix E. Customer Service & Support 37
AppendixF.Warranty 38

70Xi Cold Flow Properties Laboratory Analyzer User Guide
5
ABOUT THIS GUIDE
This guide will help you become familiar with your Phase Technology 70Xi Cold Flow Properties Laboratory
Analyzer and its features. In the unlikely event you experience a problem, contact Phase Technology for
service and support.
TYPOGRAPHICAL CONVENTIONS
Throughout this guide, the following conventions are used to make it easier to differentiate between
names of various windows or screens, buttons, and messages:
Convention Meaning Example
Bold upper & lower case
Screen or window name Control Panel
BOLD ALL UPPER CASE
(CAPITALS)
Buttons on the touch screen RUN
“Text in parenthesis” Message displayed on screen “Run Count = xxx”
Text in bold blue italics Refers to another chapter or
section in User Guide please refer to the
Analyzer Options section
NOTES, CAUTIONS, AND WARNINGS
Important information and alerts are brought to your attention with the following conventions and icons:
NOTE: Indicates further details that support the information provided in the section.
CAUTION! Indicates situations that require attention to prevent
damaging the unit.
WARNING! Indicates necessary safety precautions to avoid injury.
ASSUMPTIONS
This user manual is designed to be used by chemists and laboratory technicians who have a basic
knowledge of sampling equipment and instrumentation.

70Xi Cold Flow Properties Laboratory Analyzer User Guide
6
1. The analyzer should be set up on a flat, vibration-free surface in a well-ventilated location.
2. On the back of the analyzer, remove the red caps that cover the “PURGE IN” and “PURGE OUT”
fittings. These caps should be kept with the shipping box and related packing materials.
3. Attach the dryer bottle assembly to the back panel by fitting the two mounting bracket holes over
the two mounting screws.
4. Separate the quick-connect fittings on the dryer bottle. Press the latch on the female fitting and
pull them apart.
5. Attach the quick-connect fittings to the “PURGE IN” and “PURGE OUT” fittings on the back of the
analyzer. A “click” sound confirms that the fittings have snapped into place.
6. Mount the Sample Injection Port Assembly onto the analyzer cover with the 4 mounting screws.
Make sure the stainless steel tubing of the Sample Injection Assembly point to the back of the
analyzer. Rotate the tubing if needed. Connect the sample transfer tube (1/8” Teflon tube with
stainless fitting on one end and brass fitting on other end) from the Sample Injection Port
Assembly (stainless steel fitting) to the analyzer “SAMPLE IN” port (brass fitting). Connect the
supplied 1/8” Teflon tube (with brass fitting on one end and no fitting on other end) from the
analyzer “SAMPLE OUT” port to a user-supplied waste bottle.
7. Connect the power cable to the back of the 70Xi Analyzer. Plug the power cable into a grounded
AC outlet that is a dedicated circuit. Use a power surge protector, equipped with a line filter, if
your power source is unstable or noisy.
8. To power up the analyzer, press the round button at the bottom right hand side at the front of
the analyzer.
9. The analyzer will perform a set of self tests to verify that each of the main components of the
analyzer, including the optics system and cooling system, are operating correctly. If a problem is
detected, the self tests will stop and a message will be displayed at the bottom of the screen.
If any component fails the self tests, press the INTELLINOSTICS button for further
information and troubleshooting steps.
How to Connect and Power On
the Analyzer 1

70Xi Cold Flow Properties Laboratory Analyzer User Guide
7
If Pour Point function is available, the message, “Remove sample then press Continue” will be
displayed at the end of the self tests. If the sample cup is empty, press CONTINUE to proceed,
otherwise remove the sample with a cotton swab, then press CONTINUE. The analyzer will
perform an auto-purge function as a final step of the self-tests.
10. After the self-tests are completed, the analyzer shows the Home screen (Fig. 1). The analyzer
returns to this screen whenever the HOME button is pressed.
Figure 1: Home screen
a. The Sample Cup temperature, Optics light Signal, and Run Count are displayed at the
top of the screen. A set of Favorites buttons is listed on the right hand side (See
sections 3. How to Run Tests Using Pre-defined Favorites and 5. How to Create
and Modify Favorites). The main area in the middle is initially blank, but displays a
phase plot when a test is done, or if a previous plot is opened
b. The ACCESS button on the lower left hand corner is used for changing user
access levels, resetting the analyzer, and shutdown. (See section 9. How to Change
User Access Levels).

70Xi Cold Flow Properties Laboratory Analyzer User Guide
8
1. Phase Technology recommends filtering and drying test samples so that they are bright and clear
in appearance and free of excessive moisture before testing. Refer to APPENDIX A: How to Use
DrySac for more details on drying the sample.
2. Fill a 30mL vial with test sample. Make sure the vial is filled up all the way to the neck.
NOTE: The analyzer automatically determines the amount of current sample (up to 30 mL)
needed to rinse and clean the previous sample. Error messages such as “No sample flow” might
occur if insufficient sample is found. For best results, it is important to fill the vial to its neck.
3. Lift the probe of the Sample Injection Port Assembly by sliding up the arm.
4. Place the vial to the indentation at the base.
How to Prepare Test Samples
2

70Xi Cold Flow Properties Laboratory Analyzer User Guide
9
5. Lower the probe by sliding down the arm.
6. The black handle should sit on top of the mouth of the vial.
1. To start a run using a predefined test setting, press and hold (for one second) one of the favorite
buttons (see section 5. How to Create and Modify Favorites).
2. During the test, the LED on the test chamber lid will be red, indicating that the chamber is
running, and the lid should not be opened.
How to Run Tests Using
Pre-defined Favorites 3

70Xi Cold Flow Properties Laboratory Analyzer User Guide
10
a. The STOP TEST button will abort a test that is in progress.
b. After the run has finished, the REPEAT TEST button will rerun the test using
the same settings.
1. The analyzer’s current test settings, such as the Sample ID, Run Mode, and Temperature unit,
etc. can be viewed or modified from the Settings window (Fig. 2). The Settings window can be
opened by tapping a favorite or pressing the arrow button beside the Favorites
window.
2. Changing the analyzer settings requires permission to be enabled by the administrator (see
section 9.How to Change User Access Levels).
Figure 2: Settings
How to Change Test Settings
4

70Xi Cold Flow Properties Laboratory Analyzer User Guide
11
The prefix “QC-“ is reserved for the names of QC samples. (see section 8. How to Use QC Chart and
Limits, Sample Specifications and Trending of Test Results). Press SET AS QC button (next to the
sample ID box) to assign the current sample to be a QC standard. The prefix “QC-“ will be added
to the sample.
NOTE: samples designed with “QC” status are automatically compared to established control limits after a
test. A message alerting users to QC failure will appear on screen should this occur.
3. Press the RUN button to start a test run using the current settings
4. Press the ADD TO FAVORITES button to save the current settings as a new favorite. The
existing Sample ID will become the name of the new favorite.
5. Press the HOME button to close the Settings window and return to the Home screen.
6. The Settings window can also be closed by a horizontal swiping motion on the touch screen,
moving across the bottom of the window.
1. Creating and modifying existing favorites require permission to be enabled by the administrator
(see section 9. How to Change User Access Levels).
2. To create a new favorite, open the Settings window, either by pressing an existing favorite or
pressing the arrow button on the thin bar to the left of the Favorite list. In the Settings
window, make any desired changes to the settings.
3. Press the ADD TO FAVORITES button to save the current settings into a new favorite.
The Sample ID will be the name of the new favorite.
4. The order in which favorite buttons appear in the list may be rearranged by dragging and
dropping any button upwards or downwards.
5. To delete a favorite, drag and drop the favorite button onto the TRASH icon at the lower
right of the favorites window. (The Trash icon is displayed only while dragging a favorite).
How to Create
and Modif
y
Favorites 5

70Xi Cold Flow Properties Laboratory Analyzer User Guide
12
1. The 70Xi analyzer has the ability to multitask, so previous results and phase plots may be viewed
even while the analyzer is running a current test.
The RESULTS HISTORY button displays a table of previous test results.
2. The table of results may be sorted by any one of the columns by pressing the desired heading
(Test #, Date/Time, sample ID, Run Mode, Sample Type, Result). Repeated presses will toggle
between ascending or descending sorting order. It is also possible to search or filter for a specific
type of result by using the Search window to the left of the table of results.
3. If there is a note attached to a test result, it will be indicated by a note icon . Press and hold
the icon to read the note.
4. To view the corresponding phase plot of a result, press the desired row in the table of results.
(see section 7. How to Review Phase Plots for more information on phase plots.)
5. Press the HOME button to return to the Home screen.
When the 70Xi analyzer completes a test run, a phase plot is displayed on screen with the final test result.
(See figure 1: Home Screen)
The phase plot is a graph with the temperature on the horizontal axis and the optics (scattered light)
signal on the vertical axis. When the sample is completely liquid, the optics signal maintains a low and
flat baseline level, but the presence of wax crystals causes a rise in the signal.
A pour point plot shows a sequence of vertical bars that indicate the amount of movement in the sample
when it is perturbed at progressively colder temperatures.
1. To zoom in on part of the phase plot, use the touch screen to drag and paint a rectangle over the
area of interest and release.
The ZOOM OUT button rescales the phase plot to show the entire graph on the screen.
How to View Test Results
6
How to View Phase Plots
7

70Xi Cold Flow Properties Laboratory Analyzer User Guide
13
2. The OVERLAY button allows two or more phase plots to be overlaid on the screen for
comparison purposes.
3. To annotate the phase plot with a note, press the NOTE icon , at the upper right of the
screen, and type in the desired text. Such notes can serve as useful and customized reminder of
the specific result. A note icon will accompany the line of result.
4. The °C°F button switches the temperature scale of the phase plot between degree
Celsius and Fahrenheit.
5. The SWITCH PLOT button is available for Pour or Pour & Cloud point tests. It switches the
view between the light signal graph and the sample movement graph.
1. QC Samples and Control Limits
a. All QC samples are identified with the “QC-“ prefix in the sample ID. Press SET AS QC
in the Settings window (see section 4. How to Change Test Settings) to assign the
current sample as a QC standard (i.e. analyzer will automatically add the “QC-“ prefix to
the current sample ID).
b. In order to enter (or auto-calculate) control limits, there must be an existing Favorite for
the QC sample. Refer to section 5. How to Create and Modify Favorites for more
information.
c. Only administrators are allowed to enter or modify QC control limits (see section 9.
How to Change User Level Access).
d. To assign control limits, press ANALYZER OPTIONS button from the Home
screen.
e. On the Analyzer Options screen, press QC CONTROL LIMITS. The following window
appears.
How to Use QC Chart Limits,
Sample Specifications and
Trendin
g
of Test Results 8

70Xi Cold Flow Properties Laboratory Analyzer User Guide
14
f. Select the QC sample in the list box that you wish to enter or modify the control limits.
g. Select the Temperature Unit (°C or °F) at the top of the window.
h. Enter the Upper Limit, Lower Limit and/or Centerline values for the corresponding run
modes.
i. QC upper and lower control limits (UCL, LCL) can also be automatically calculated by the
analyzer following ASTM D6299 methodology if there are a minimum of 20 valid data
points. The analyzer also allows the user to manually identify and exclude outliers before
calculating the control limits.
j. Press the HOME button to save the control limits and return to the Home screen.
k. Whenever the test result of a QC sample exceeds the control limits, a pop-up window
will appear with the message “The last QC test exceeded the control limit
requirements!.” This pop-up window will appear each subsequent time the analyzer
starts a non-QC test under the same run mode that has failed the previous QC test, until
one of the following rectifying conditions are met:
1) Re-run another QC test that meets the control limits
2) Have an Administrator acknowledge the error message by pressing OK on the
pop-up window
l. Failed QC tests are flagged in the Results History screen with a icon. QC tests
performed without any control limits are flagged in the Results History screen with a
icon.

70Xi Cold Flow Properties Laboratory Analyzer User Guide
15
2. Specification Limits for Non-QC Samples
a. Upper and lower limits can also be assigned to sample not designated for QC purposes.
Such limits may be internal production specification and hence useful for monitoring.
Alerts are accordingly generated by the analyzer in case these limits are exceeded.
b. In order to enter sample specifications, there must also be an existing Favorite for the
sample. Refer to section 5. How to create and modify Favorites for more
information.
c. Only administrators are allowed to enter or modify sample specifications (see section 9.
How to Change User Level Access).
d. To assign specification limits, press ANALYZER OPTIONS from the Home screen.
e. On the Analyzer Options screen, press SAMPLE SPECIFICATIONS
f. Select the sample in the list box that you wish to enter or modify the specification limits.
g. Select the Temperature Unit (°C or °F) at the top of the window.
h. Enter the Maximum Specification, Minimum Specification and/or Expected Value for the
corresponding run modes.
i. Press the HOME button to save the sample specifications and return to the Home
screen.
j. Whenever a sample test result exceeds the specifications, a pop-up window will appear
with the message “The last test exceeded the sample specifications!” Tests that
exceeded the sample specification limits are flagged in the Results History screen with
aicon.

70Xi Cold Flow Properties Laboratory Analyzer User Guide
16
3. Control Charts and Trend Graphs
a. Trend graphs (i.e. time vs. test results graph) can be constructed for both QC and non-
QC samples. Such a plot illustrates the test results of a particular sample (of a specific
sample ID) over time, and can serve as a trending plot.
b. To generate a control chart (for a QC sample) or a trend graph, press RESULTS
HISTORY from the Home screen.
c. From the Results History screen, press the TREND GRAPH button . The Trend
Graph panel appears.
d. Select the sample in the list box, or enter the desired sample ID to generate the control
chart or trend graph for that sample.
e. Once the control chart or trend graph is generated, the phase plot for any result on the
chart or graph can be opened simply by touching the data point on the graph.
f. The QC Control Limits and Sample Specifications button accesses those
screens directly from the trend graph screen (for administrators only)
g. In the case of QC control chart, the analyzer can also calculate the control limits
automatically by pressing the CALCULATE LIMITS button . Follow the on-screen
instructions to identify outliers before actual calculation.
NOTE: a minimum of 20 data points are required for the automatic control limits
calculation.

70Xi Cold Flow Properties Laboratory Analyzer User Guide
17
1. There are 3 different user levels that allow varying degree of configuration control:
a. User: lowest level that may have restricted access to certain features. This is the
default user level upon power up
b. Administrator: level that can be password protected and has access to all available
features. Administrators can also configure access permissions of certain features for the
User group
c. Factory: reserved for factory use only
2. To change the current user level, press the ACCESS button at the lower left corner. The
“Access” screen appears (see Fig. below)
3. Select either USER or ADMINISTRATOR
4. To setup or modify the password at the Administrator level:
a. Switch user level to Administrator
b. From the Home screen, press the ANALYZER OPTIONS button .
How to Change
User Level Access 9

70Xi Cold Flow Properties Laboratory Analyzer User Guide
18
c. Press USER ACCESS CONTROL. The following screen appears.
d. Enter a password of your choice for the Administrator Password. This step should be
performed by an authorized administrator. The screen also allows other permission
settings.
e. Press the HOME button to save the settings and return to the Home screen
f. Once the administrator password has been set up, the analyzer will prompt for the
password each time the user level is switched to Administrator
5. To modify User group permissions:
a. Switch user level to Administrator
b. From the Home screen, press ANALYZER OPTIONS button
c. Press USER LEVEL ACCESS
d. Select either “Allow” or “Deny” for access at the User level:
1) Favorites Changes – adding, deleting or organizing favorites
2) Test Settings Changes – modify test settings for any of the Favorites
3) Function Tests – access to the Function Tests screen
4) USB File Transfer – data file transfers between analyzer and USB ports ( e.g.
flash memory devices)
e. Press the HOME button to save the settings and return to the Home screen

70Xi Cold Flow Properties Laboratory Analyzer User Guide
19
NOTE:it is very important to follow the steps below to either shut down or restart the analyzer properly.
Hard shut downs such as unplugging the power cord while the analyzer is powered on may cause data
corruptions and/or permanent damage to the analyzer.
1. To shut down the analyzer, press the ACCESS button and then press the SHUT DOWN
button
2. To restart analyzer, press the ACCESS button and then press the RESTART button
1. Data Download via USB
a. To download data from the analyzer to a USB memory stick, simply insert the USB
memory stick to the front USB port (beside the power button). The USB Download
screen will automatically appear (see figure on next page).
2
How to Use the Analyzer’s
Connectivity Features 11
How to Shut Down and
Restart the Analyzer 10

70Xi Cold Flow Properties Laboratory Analyzer User Guide
20
b. There are 5 different types of data files that can be downloaded from the analyzer to the
USB memory stick:
1) DIAGNOSTIC FILES FOR CUSTOMER SERVICE
This option downloads all necessary files for Phase Technology’s Customer
Service department to review and perform further data analysis for
troubleshooting
2) SUMMARY OF ALL TEST RESULTS (.CSV)
This option downloads a summary of all test results to a CSV file (Results.csv).
Spreadsheet programs like MS® Excel can be used to display the data and do
further analysis
3) DETAIL PHASE PLOT DATA OF INDIVIDUAL TESTS (.DAT)
This option will open another window for user to select individual tests and
phase plot data. Phase plot data files can be opened and viewed on an external
PC with Phase’s LTB program.
4) BACKUP SOFTWARE
Before upgrading to newer software, it is recommended to use this option to
backup the existing software onto a secondary (USB) memory device
5) FACTORY USE ONLY
Reserved for factory use only
c. Transfer file location: All files will be downloaded to the PHASE_70Xi/[Analyzer Serial
Number] (e.g. PHASE_70Xi/201030001) folder on the USB memory stick
Table of contents
Other Phase Technologies Measuring Instrument manuals