Prostat PGA-710B User manual

Getting Started Operations Guide
PGA-710B
autoanalysis system


Page
A. System Requirements 4
B. Installing the Autoanalysis Applicaon Soware and Drivers 5
C. Connecng the PGA-710B Autoanalysis System to your computer 6
D. Adjust or Conrm the “zero” reference for the PGA-710B System 8
E. Assembling your Autoanalysis System to the Field Meter and Charge Plate Monitor 8
F. Capture and Analyze Data 9
G. Generang a Detailed Report 11
Copyright © 2013 by Prostat® Corporaon. All rights reserved. Printed in the United States of America. No part of this
manual may be used or reproduced in any manner whatsoever without wrien permission. For informaon contact
Prostat Corporaon, 1072 Tower Lane, Bensenville, IL 60106 USA
Prostat is the registered trademark of Prostat® Corporaon

4Rev. B / March 2017
PGA-710B Autoanalysis System
A.
The following hardware and soware is required to run the Autoanalysis Applicaon Soware.
• Microso® Windows® Win7 32-bit, Win7 64-bit, Win8 32-bit, Win8 64-bit, Win10, Server 2003,
Server 2008 or Server 2012.
• 90 MHz Intel Penum-class processor, or an AMD Opteron, AMD Athlon64 or AMD Athlon XP
Processor
• 32 MB of RAM, 96 MB Recommended
• 110 MB of hard disk space required, 40 MB addional hard disk space required for installaon
(150 MB total)
• 800 x 600 or higher-resoluon display with 256 colors
• Microso® Data Access Components 2.6
• Microso® DirectX 9b
• Instrument input limits to ± 2 volts.
Providing greater than ± 2 volts to the PGA-710B Autoanalyzer will void the warranty. For appropri-
ate adapters or cables, please contact Prostat Corporaon or your Prostat Authorized Reseller.

5
Rev. B / March 2017
PGA-710B Autoanalysis System
DO NO connect your PGA-710B Device to your computer or laptop unl installaon is complete.
.NET Framework 4 is required to run the Autoanalysis Applicaon Soware.
If .NET Framework 4 is not currently installed, the Autoanalysis Applicaon Soware
Installaon wizard will prompt you to install from the disk.
1. Insert the USB Flash Drive into a USB Port of
your computer or laptop.
2. Select from the dialog box
and double-click lename “” to
download the soware.
3. Once downloaded, extract the les to your
Desktop and double-click lename “
” in the extracted folder.
4. When prompted, enter the
found on your USB Flash Drive.
Mulple instances of installaon will oc-
cur.
To get addional support, register your copy of
the Autoanalysis Applicaon Soware.
If you haven’t registered your copy during the
installaon, do the following:
Choose > -
… and click on the buon to be taken
to the electronic registraon form.
Step 1 Step 2
6Rev. B / March 2017
PGA-710B Autoanalysis System
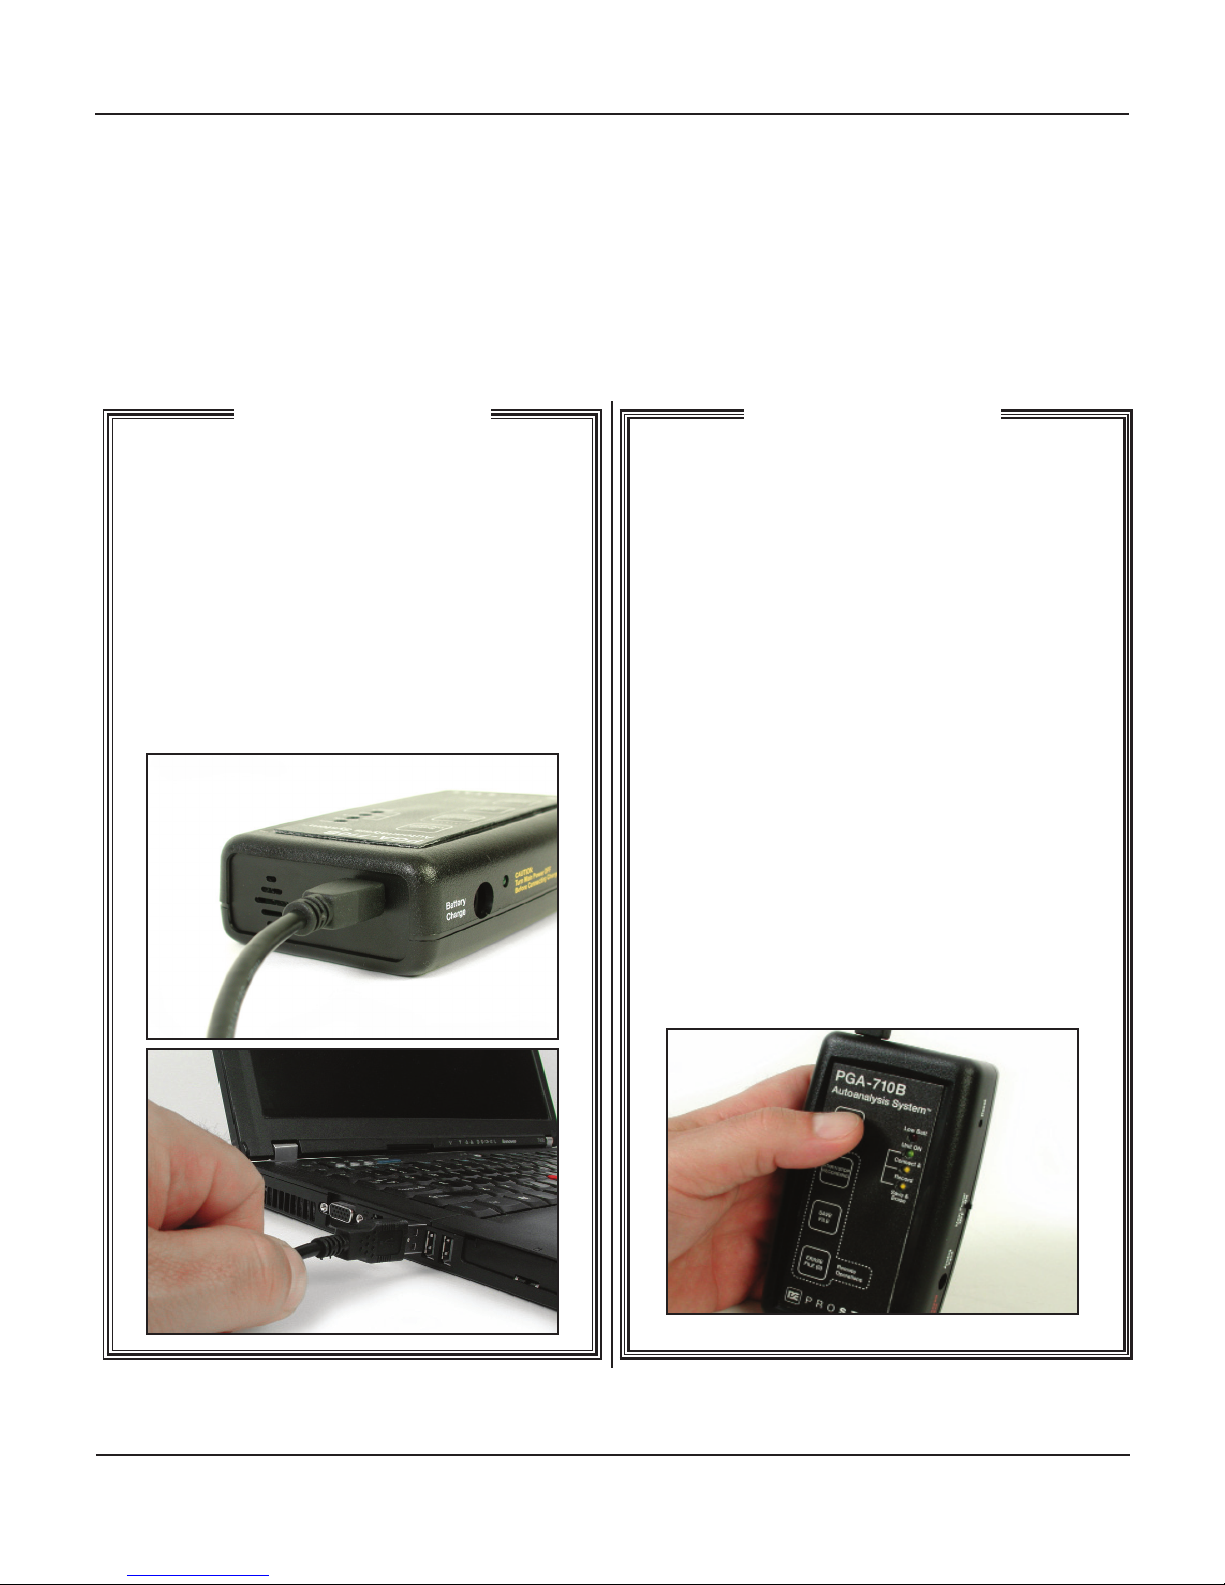
Before you start using or connect the PGA-710B, make sure to charge its baery for at least 8 to 14 hours
using the supplied AC/DC converter. Esmated operang baery life is approximately 8 to 10 hours of
connuous operaon without connecon to USB port, or supplied baery charger. The unit charges when
connected to the computer via USB.
The PGA-710B Autoanalyzer connects to an Electrostac Field meter via its analog output lead and to a
computer using a USB cable.
Windows will complete installaon of the driv-
ers for your PGA-710B:
1. Connect one end of the supplied USB cable
to the PGA-710B Device USB port.
2. Connect the opposite end of the USB cable
to your computer’s USB port.
1. Slide the PGA-710B Main Power Switch .
2. Press and hold the System buon
briey.
3. The green “” LED ashes slowly.
4. The “” LED will ash in-
dicang the PGA-710B and the computer are
communicang with each other.
5. If the drivers have not been installed, you may
need to manually install them. You can install
them from the Drivers folder on the Flash
Drive.
Step 3 Step 4

7
Rev. B / March 2017
PGA-710B Autoanalysis System
At this point, the “” LED will be indicang the PGA-710B Autoanalyzer’s baery is re-
ceiving a charging voltage from the computer’s USB.
This charge is not sucient to completely charge the baery during normal op-
eraons. See the Operaons Manual for more details.
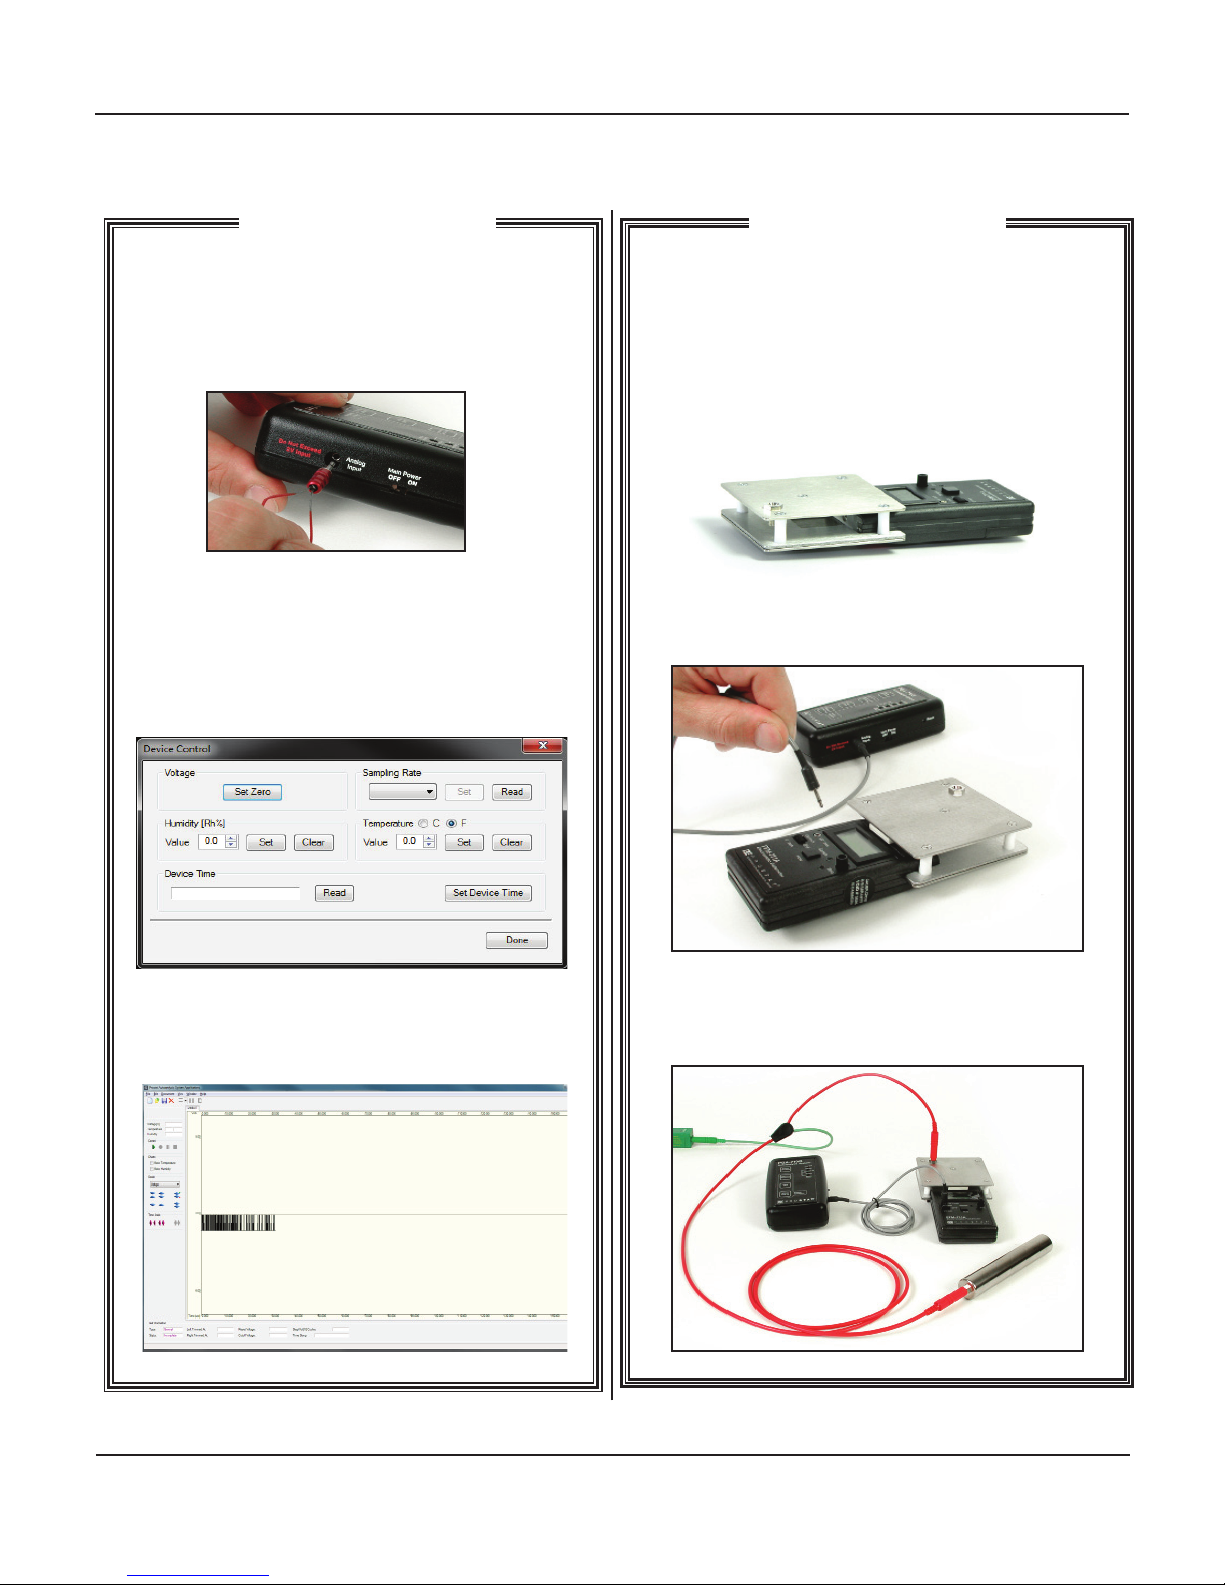
D.
1. Insert the supplied reference shunt into the
analog input of the PGA-710B.
2. Launch the soware. On the Start Screen,
select “” and click .
1. Click from the Data Recording Control
(green arrow) or press F5 on your keyboard.
The preview cursor will begin to move across the
chart screen.
Step 5 Step 6
8Rev. B / March 2017
PGA-710B Autoanalysis System
1. Insert shorng shunt into input receptacle.
2. From the , click on -
. Do the following:
a. Click
b. Click
c. Click
3. Conrm unit at Zero Reference:
a. Click
b. Click (F11)
c. Shows PGA-710B Zero Reference
1. Assemble your professional Prostat PFM-711A
Field Meter and the CPM-720A Charge Plate
Monitor. Aach the Field Meter to a tested
earth ground.
2. Connect the PFM-711A to the PGA-710B using
the provided analog cable.
3. For body voltage measurement, connect a
sensing lead to the Charge Plate and the other
end to a Hand Held Metal Wand.
Step 7 Step 8

9
Rev. B / March 2017
PGA-710B Autoanalysis System
The PGA-710B records and converts analog input from a eld meter instrument to digital
data, then transmits that data to your computer via USB, or stores it for future use.
Anything your eld meter measures will be transmied via the analog cable to the PGA-
710B, then to the computer where the dynamic measurements are displayed on the
screen.
F.
1. With the subject temporarily grounded, turn
on and zero your eld meter.
2. Remove the subject from ground, press
Green arrow (F5) to conrm signal
being transmied. Press Red ball
(F6) when ready to record data.
3. Once test is completed, press Black box Stop
(F8) to stop recording.
1. Assume the following data was recorded
while sing on a chair and then standing .
2. To analyze the data, select
This opens the . Use
and to eliminate data not
to be included in the analysis.
For details on how to test and analyze Footwear/Flooring combinaon, refer to
the provided “” manual.
Step 9 Step 10

10 Rev. B / March 2017
PGA-710B Autoanalysis System
1. Trimmed porons of the chart are eliminat-
ed from the analysis
2. Esmate the number of peaks in test, enter
it in window and click .
1. Click the buon. This allows addion
or removal of minimum or maximum peaks
from the analysis.
2. To add a Minimum peak, click and
drag to a low peak on the chart then le-click
your mouse. To add a Maximum, repeat the
process aer clicking .
3. Click to automacally calculate the
and for the Mini-
mum and Maximum data sets. Displayed are
3 lines for the Minimum and Maximum data.
The center line is the of the data. The
upper line is the of the
data, and the lower line represents the data’s
Step 11 Step 12

11
Rev. B / March 2017
PGA-710B Autoanalysis System
G.
There should be an equal number of alternang minimum and maximum peaks.
±3 Sigma in Step 12 must be completed before generang a report (Step 13).
1. To generate a report, you can either click
the icon or click
.
2. Select which report you wish to view from
the Report Selecon window. (e.g.
)
3. To print the report, simply click the printer
icon. You can also export reports into a .doc,
.r, .xls or .pdf les.
1. You can provide detailed informaon con-
cerning the test and report using the
and .
2. Select > to enter the
informaon.
3. Session Wizard entries appear in Reports
4. Adding Remarks to report:
a. Click drop down menu
b. Select
c. Enter Remarks and click
Remarks are automacally entered and the report
is updated.
Step 13 Step 14

PROFESSIONAL STATIC CONTROL PRODUCTS
Corporate Headquarters • 1072 Tower Lane • Bensenville, IL 60106 • 630-238-8883 • Fax: 630-238-9717 • 1-855-STATIC1 • www.prostatcorp.com
Prostat Corporaon
Specicaons are subject to change without noce.
All Prostat trademarks and trade names are the property of Prostat Corporaon.
All other trademarks and trade names are the property of their respecve companies.
Other manuals for PGA-710B
2
Table of contents
Other Prostat Analytical Instrument manuals


