Rhosonics 8500 User manual

Software Version: 2.3.3 Date: 8 August, 2012 Page 1/46
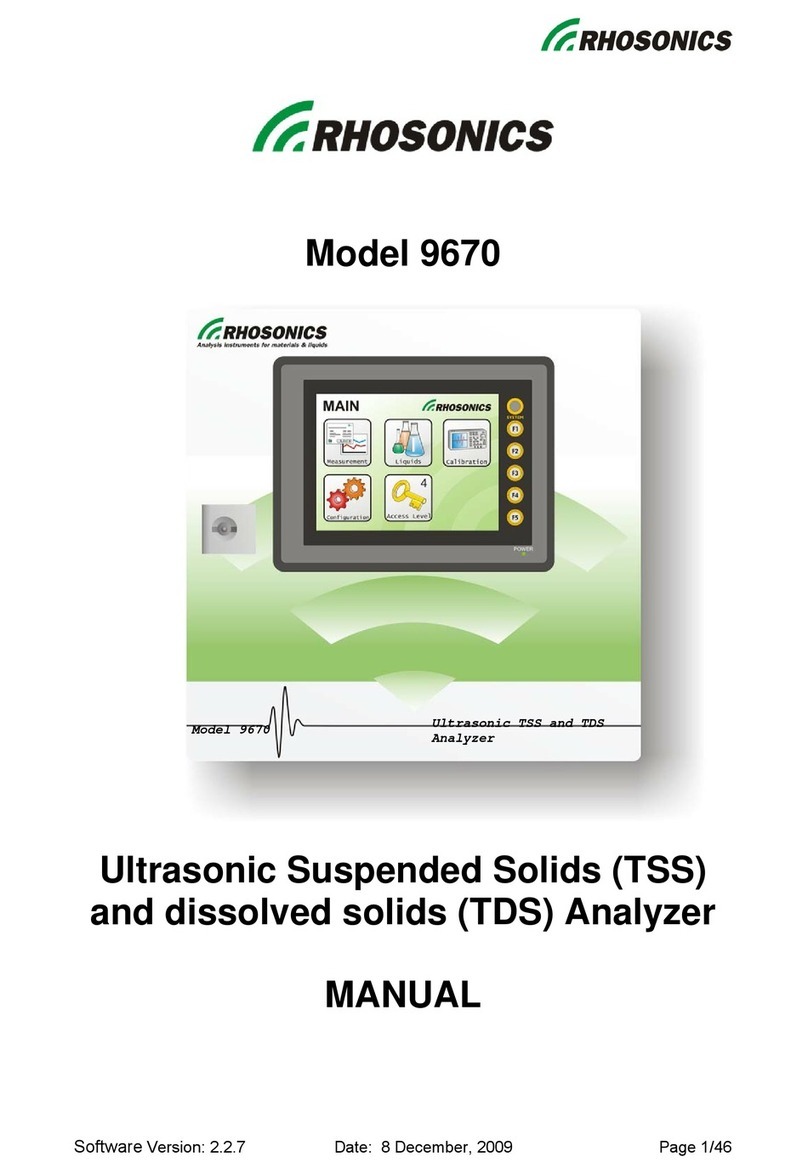
Model 8500
Ultrasonic Inline Concentration
Analyzer for solutions and emulsions
MANUAL
Model 8500
Ultrasonic Inline
Concentration Analyzer

Software Version: 2.3.3 Date: 8 August, 2012 Page 2/46
TABLE OF CONTENTS
1. INSTALLATION 5
1.1 INTRODUCTION 5
1.2 ANALYZER INSTALLATION 5
1.2.1 SPLIT TYPE INSTALLATION 5
1.2.2 WEATHER PROOF HOUSING INSTALLATION 7
1.3 SENSOR INSTALLATION 8
1.4 INSTALLING THE CABLES 8
2. CONFIGURATION. 11
2.1 INTRODUCTION 11
2.1.1 TOUCH SCREEN FUNCTIONS 11
2.1.2 PREPARATIONS 11
2.2 ANALOG OUTPUT CONFIGURATION 12
2.2.1 PROCEDURE 12
2.2.2 OUTPUT SOURCE 12
2.2.3 OUTPUT SCALING 13
2.2.4 ERROR COMMUNICATION THROUGH ANALOG OUTPUTS 13
2.2.5 DECAY TIME 14
2.3 DISPLAY CONFIGURATION 14
2.3.1 SELECTING THE RESULTS 14
2.3.2 SETTING THE DISPLAY RESOLUTION 15
2.3.3 DISPLAY SMOOTHING 15
2.3.4 GRAPH SCALING 15
2.3.5 BACKLIGHT TURN OFF TIME 16
2.4 SENSOR PARAMETERS 16
2.4.1 INTRODUCTION 16
2.4.2 PROCEDURE 16
2.4.3 INSTRUCTIONS: 16
2.4.4 AUTO DEAD TIME 17
2.5 ALARM CONFIGURATION. 18
2.5.1 INTRODUCTION 18
2.5.2 PREPARATION. 18
2.5.3 PROCEDURE 18
2.6 TROUBLE SHOOTING 19
2.6.1 PREPARATION. 19
2.6.2 MEMORY STICK LOGGING 19
2.6.3 PROCEDURE TO STOP LOGGING ON USB MEMORY STICK 19
2.6.4 VERIFYING THE ULTRASONIC SIGNAL WAVEFORM 22
2.6.5 FACTORY DIAGNOSTICS TO USB 24
2.6.6 HARD COPYING SCREENS 25
3. LIQUID SELECTION AND EDITING 26
3.1 LIQUID (PRODUCT)SELECTION 26
3.1.1 PURPOSE: 26
3.1.2 PROCEDURE (MANUAL SELECTION): 26
3.1.3 PROCEDURE (REMOTE SELECTION): 26
3.2 EDITING LIQUIDS (POLYNOMIAL CALIBRATIONS) 26

Software Version: 2.3.3 Date: 8 August, 2012 Page 3/46
3.2.1 INTRODUCTION 26
3.2.2 PURPOSE: 27
3.2.3 PREPARATION FOR EDITING LIQUID PARAMETERS 27
3.2.4 PROCEDURE 27
3.2.5 ADJUSTING INDIVIDUAL ALARM TRIP POINTS. 27
3.2.6 ADJUSTING POLYNOMIALS. 28
4. CALIBRATION 29
4.1 TYPES OF CALIBRATION 29
4.2 TEMPERATURE OFFSET 29
4.2.1 PURPOSE 29
4.2.2 WHEN NEEDED 30
4.2.3 PROCEDURE 30
4.3 ZERO (WATER)CALIBRATION 30
4.3.1 PURPOSE 30
4.3.2 WHEN NEEDED 30
4.3.3 PROCEDURE 30
4.4 FIELD (SAMPLE)CALIBRATION 31
4.4.1 PURPOSE 31
4.4.2 WHEN NEEDED 31
4.4.3 PROCEDURE 31
5. AUTOMATION AND COMMUNICATION. 33
5.1 REMOTE PRODUCT SELECTION 33
5.1.1 PURPOSE 33
5.2 BINARY PRODUCT SELECTION 33
5.2.1 PURPOSE 33
5.3 PRODUCT SELECTION THROUGH RS232 33
5.3.1 PURPOSE 33
5.3.2 METHOD 33
5.4 EXTERNAL HOLD FUNCTION 34
5.4.1 PURPOSE 34
5.5 AUTOMATIC CALIBRATION 34
5.5.1 AUTO DEAD TIME CALIBRATION 34
5.5.2 AUTOMATIC ZERO CALIBRATION 34
6. MAINTENANCE 35
6.1.1 INTRODUCTION 35
6.1.2 PROBE MAINTENANCE 35
6.1.3 4-20 MAC02 COMP.INPUT CALIBRATION 35
6.1.4 4-20 MAOUTPUT CALIBRATION 36
7. FREQUENTLY ASKED QUESTIONS 37
7.1.1 INSTALLATION QUESTIONS 37
7.1.2 OPERATION QUESTIONS 37
7.1.3 CALIBRATION (US SYSTEM) 39

Software Version: 2.3.3 Date: 8 August, 2012 Page 4/46
8. TECHNICAL SPECIFICATIONS 41
8.1 OPERATION CHARACTERISTICS 41
8.2 OPTIONS 41
8.3 SUPPLEMENTAL CHARACTERISTICS 41
8.3.1 ANALYZER WITH TOUCH SCREEN DISPLAY 41
8.4 ENVIRONMENTAL CONDITIONS 42
8.4.1 INGRESS PROTECTION 42
8.4.2 TEMPERATURE 42
8.4.3 HUMIDITY 42
8.4.4 STORAGE CONDITIONS 42
9. TECHNOLOGY 43
9.1 MEASUREMENT SEQUENCE 43
9.2 ULTRASONIC VELOCITY OF SOUND 43
9.3 OTHER ULTRASONIC VARIABLES 43
9.4 ATTENUATION 44
9.5 CONVERSION OF MEASURING PARAMETERS 44
9.6 LIQUID PRESENCE DETECTION 44
10. APPENDICES 45
10.1 OPERATING SOFTWARE STRUCTURE FOR LEVEL 1, 2AND 3IN THE CONFIGURATION MENU 45
10.2 LIST OF SPARE PARTS 45
10.3 OPTIONS 46
10.4 APPENDIX A: SOUND SPEED OF WATER AT 0TO 100 °C 46

Software Version: 2.3.3 Date: 8 August, 2012 Page 5/46
1. Installation
1.1 Introduction
Purpose:
Installation of analyzer control unit, probe(s), cells, and cables.
1.2 Analyzer installation
The installation depends on the version. Whether you have purchased the split type, with
separate display and control unit on PCB, the Weatherproof or the Panel Mount version.
1.2.1 Split type installation
The split type version consists of 2 units, one of which is the controller PCB, which is
mounted in a steel / aluminium housing. To prepare the installation, please refer to the
figures below.
42
172
124.8 30.2
15.1
260
245
170
10
5
22.6
Touch screen /
RS 232
Midden Engweg 37A
NL-3882 TS Putten
The Netherlands
Phone: +31 341 370073
Fax: +31 341 370074
Email: [email protected]
Internet: www.rhosonics.nl
AC
100-240V
Fuse
1.6A
slow
Fuse
3.15A
slow DC
18-36V
-
+
L
N
GND
-12V
+12V
Touch
screen
C
NC 2
NO
Alarm
Pt100 4 wire
Drain
I ref -
Sense -
Sense +
I ref +
4-20 mA
Out
Ch1 Ch2
+ - + -
US Probe
Check wiring before
applying power
To prevent electric shock,
do not remove cover !
WARNING
C
NC 1
NO
Type:
Voltage:
Power:
Fuse:
Freq:
Serial:
8500-SPLT-TOD-VAC
100-240 VAC 18-36 VDC
35 Watt
1.6A Slow 3.15A Slow
50/60 Hz
100506092
Made in Holland
PbPb
GNDGND
Figure 1: Steel / Aluminium housing for split unit analyzer
The above figure shows the dimensions of the housing of the PCB for installation.
1.2.1.1 Display installation.
The display is a Touch Screen type, which can be easily installed in a panel. For cut-out
details, please refer to the below figure.

Software Version: 2.3.3 Date: 8 August, 2012 Page 6/46
131+0.5
-0
174+0.5
-0
Figure 2: Panel cut-out for display installation
1.2.1.2 Touch Screen connections
The touch screen has 2 major connections, i.e. the 24 Volt power supply, and the connection
with the PCB control unit.
The connection with 24VDC is realized through screw-type terminals.
The connection with the PCB control unit must be established with the special cable.
NOTE: Do not use any other cables, like Ethernet cables, as they may cause malfunctioning
or damage to the analyzer.
Connect the 24 Volt DC to the display.
WARNING: DO NOT connect the ground to the display,
if the display is within 0.5 meter of the analyzer. If
possible do not place the display within a 0.5 meter
range of the analyzer.
Connector U-B is used for updating the display software.
Connector U-A is used for an USB stick connection
Connector MJ2 is not used.
U-A U-B
+ - GND
24 VDC MJ2 MJ1
Figure 3: Connection overview display

Software Version: 2.3.3 Date: 8 August, 2012 Page 7/46
WARNING: A TOO TIGHT FIT OF THE SCEEN MAY CAUSE DAMAGE AFTER
INSTALLATION
NOTE: There are two different types of displays, so the ports can be located at other places
on the display than is shown in the drawing.
1.2.2 Weather proof housing installation
120
Display
Cable gland holes (5x) for
M16x1.5 cable glands
300
300
SYSTEM
260
320
10
Figure 4: Weather proof housing
The general appearance of the PCB is given in the next figure.

Software Version: 2.3.3 Date: 8 August, 2012 Page 8/46
Ultrasonic
Channel 2
Communication
Temperature
inputs 4-20 mA
Alarm
Relays
Conductivity
Power supply
external devices
Mains
Power DC Power
External
Control
Chan.1
isolated
(option)
1 2
+ - + -
Output
+ -
Input
- - + +
GND
- - + +
GND
Temp 1
Temp 2
Drive +
Drive -
In -
In +
Gnd
Tmp
Tmp
Chan. 1
Chan. 2
Drive +
Drive -
In -
In +
Gnd
Tmp
Tmp
C
NO
NC
C
NC
NO
1
2
Density
meter Touch
screen
G
-12
+12
90-240
Volt
Fuse
1.6A
slow
Fuse
3.15A
slow 18-36
Volt
Gnd
-
+
Model
Serial No.
Ext. Hold
Liquid
select
Gnd
Input
Gnd
0
1
2
3
4
5
nd
S
S
G
I2C Density meter
Binary I/O
RS 232 /
422 /485 Ethernet
Touch screen
RS 232/485
Channel 1
G
-12
+12
Figure 5: PCB layout with all cable connections.
NOTE:
Not all connectors are used. The connectors shown are for all types of analyzers.
1.3 Sensor installation
Preparation.
It is important that the sensor is installed in a straight pipe run, preferably with minimally 5
diameters of straight pipe run upstream, and 3 pipe diameters of straight pipe run
downstream.
In addition, the probe must be installed in a vertical pipe, or sidewise in a horizontal pipe.
This implies that the probe must not be installed on top of the pipe, nor on the bottom, as
eventual gas bubbles may accumulate on the sensor surface(s). Installation on a vertical
pipe section is preferred, as gas bubbles are always able to escape.
Summary:
5D of pipe length upstream, 3D pipe length downstream of probe location point.
Do not mount directly after a point where the liquid is likely not homogeneous (i.e. after a
CO2 dosing point, after a component dosing valve)
Installation in vertical pipe is best, in case of installation in horizontal pipe: install sensor
from one side of the pipe. Never install the sensor on the top or on the bottom of the pipe.
1.4 Installing the cables
Refer to figure below for general mounting overview of the cables.

Software Version: 2.3.3 Date: 8 August, 2012 Page 9/46
SYSTEM
Concentration
Sound Speed
Temperature
Attenuation Time
Concentration NaOH 25.34 %wt
Temperature 21.68 °C
Attenuation 35
Spound speed 1798.352 m /s
Hold
MAIN
NEXT
Any type of probe
US-1
Alarm 1 (High relay)
Alarm 2 (Low relay)
4-20 mA in (=Comp. in)
4-20 mA out 2
4-20 mA out 1 (Optional: Isolated output)
RS 232 / RS 422 / RS 485 1
Ethernet (Optional)
24 VDC
or
100...240 VAC
PC
Pt100-1
Figure 6: Schematic cabling overview analyzer (in cabinet) with ultrasonic sensor and
temperature sensor
US-1
Pt100-1
SYSTEM
Concentration
Sound Speed
Temperature
Attenuation Time
Concentration NaOH 25.34 %wt
Temperature 21.68 °C
Attenuation 35
Spound speed 1798.352 m/s
Hold
MAIN
NEXT
PC
Any type of probe
Alarm 1 (High relay)
Alarm 2 (Low relay)
4-20 mA in (=Comp. in)
4-20 mA out 2
4-20 mA out 1 (Optional: Isolated output)
RS 232 / RS 422 / RS 485 1
Ethernet (Optional)
24 VDC
or
100...240 VAC
PLC / PC
RS 422 /
RS 485
(Optional)
Figure 7: Schematic cabling overview analyzer (split units) with ultrasonic sensor and
temperature sensor

Software Version: 2.3.3 Date: 8 August, 2012 Page 10/46
Ultrasonic sensor
+ Temperature sensor Rhosonics Analyzer
1 Temperature sensor cable
2 Ultrasonic coax cable
3 Cat 6 patch cable (no standard cable)
Display
(Touch screen)
1
2
3
Process pipe
with flow
SYSTEM
Pb
GND
GND
Touch
screen / RS 232
Midden Engweg 37A
NL-3882 TS Putten
The Netherlands
Phone: +31 341 370073
Fax: +31 341 370074
Email: [email protected]
Internet: www.rhosonics.nl
AC
100-240V
Fuse
1.6A
slow
Fuse
3.15A
slow DC
18-36V
-
+
L
N
GND
-12V
+12V
Touch
screen
C
NC 2
NO
Alarm
Pt100 4 wire
Drain
I ref -
Sense -
Sense +
I ref +
4-20 mA
Out
Ch1 Ch2
+ - + -
US Probe
Check wiring before
applying power
To prevent el ectric shock,
do not remove cover !
WARNING
C
NC 1
NO
Type:
Voltage:
Power:
Fuse:
Freq:
Serial:
8500-SPLT-TOD-VAC
100-240 VAC 18-36 VDC
35 Watt
1.6A Slow 3.15A Slow
50/60 Hz
100506092
Made in Holland
Pb
24 VDC
Figure 8: Schematic cabling overview analyzer Split type with ultrasonic sensor and
temperature sensor, 24 VDC power supply
Ultrasonic
Channel 2
Communication
Temperature inputs
4-20 mA
Alarm
Relays
Conductivity
Power supply
external devices
Mains
Power DC Power
External
Control
Chan.1
isolated
(option)
1 2
+ - + -
Output
+ -
Input
- - + +
GND
- - + +
GND
Temp 1
Temp 2
Drive +
Drive -
In -
In +
Gnd
Tmp
Tmp
Chan. 1
Chan. 2
Drive +
Drive -
In -
In +
Gnd
Tmp
Tmp
C
NO
NC
C
NC
NO
1
2
Density
meter Touch
screen
Gnd
-12 V
+12 V
90-240
Volt
Fuse
1.6A
slow
Fuse
3.15A
slow 18-36
Volt
Gnd
-
+
Model
Serial No.
Ext. Hold
Liquid
select
Gnd
Input
Gnd
0
1
2
3
4
5
0 1 2 3 4 5 6 7 Gnd
SCL
SDA
GND
I2C Density meter
Binary I/O
RS 232 /
422 /485 Ethernet
Touch screen
RS 232/485
Channel 1
Gnd
-12 V
+12 V
Connected to
cover
Power cable
Central earth
connection point
Figure 9: Schematic overview for earth cables inside WPF housing

Software Version: 2.3.3 Date: 8 August, 2012 Page 11/46
2. Configuration.
Configuration can be done through the
configuration menu, by pressing the exit icon
on the main measurement screen:
Figure 10: MAIN MENU page
NOTE: The shown icons depend on your
access level.
2.1 Introduction
Once you have chosen the configuration mode, you will be able to establish specific
operating parameters of the analyzer. These parameters include:
1. Sensors, including parameters of the probe
2. 4~20 mA output, including scaling, source choice and error handling
3. 4~20 mA input, for external compensation, i.e. CO2 compensation.
4. Display, i.e. choice of results to be displayed
5. Alarm output setting, i.e. type, trip points, and choice of source
2.1.1 Touch Screen Functions
NOTE: The backlight will automatically turn off after 30 minutes. To turn it on back
again, simply touch the screen at any location.
The touch screen display has the following functions:
to display measurement results in values or graphics
to change parameters and/or sources, like for instance the selected liquid
The LED located at the bottom side of the display area lights if the display is
powered up.
At the right side of the display six buttons are located with the following functions:
[SYSTEM] : NA
[F1] : changes the access level to access level 1 and changes the
page to the first measurement page
[F2] : turns the backlight OFF (touching the screen will turn the
backlight on)
[F3], [F4] : NA
[F5] : saves the current page of the display to the USB stick
2.1.2 Preparations
Before attempting to configure the transmitter, define the following:
The desired output settings for the 2 4~20mA outputs, i.e.
What measured value you wish to transmit through the 2 pcs 4~20 mA
outputs.
The scaling of these parameters.

Software Version: 2.3.3 Date: 8 August, 2012 Page 12/46
What to do when the system detects problems, i.e. gas bubbles.
Consider which parameters you wish to be viewed during normal operation.
I.e. Concentration for 1st parameter shown
I.e. Temperature for 2nd parameter shown
Consider which parameters need to be monitored by the alarms.
What measured value (i.e. concentration) you wish to check.
Whether you wish to use 2 alarms for hi-hi lo-lo configuration.
If the analyzer is used for several different products: alarm trip points for each
product.
2.2 Analog Output configuration
This section describes how you can configure your 4~20mA outputs:
With these settings, you can set the following:
To choose the result to transmit through the 4~20 mA outputs.
The scaling of these parameters.
What the system should do when the system detects problems, i.e. gas
bubbles.
Access level 2 is required (supervisor).
The access code is 7410.
2.2.1 Procedure
Through the main menu, chose configure, then
outputs.
Both outputs can be configured, as per below.
Figure 11: 4-20 mA OUT 1 page
2.2.2 Output source
► From the Configuration menu, press [4-20
mA OUT ]
►Choose [Configuration] and [4-20 mA
OUT 1 or 2]
► On the 4-20 mA OUT # menu, press [Source OUT # name] to go the
Assignment page 1 menu
► Here you can choose between the Calculated polynomial (the concentration) and
one of the measured value’s
If you choose for Calculated Polynom:
►Press [Polynom 1 or 2 calculated]
You will be returned to the 4-20 mA OUT #
menu.
If you chose for one of the Measured values:
►Press the button [More settings]
►Press the button of the desired value
You will be returned to the 4-20 mA OUT #

Software Version: 2.3.3 Date: 8 August, 2012 Page 13/46
menu.
Figure 12: ASSIGNMENT PAGE 1 page
2.2.3 Output Scaling
The analog output is of the 4~20 mA type.
When you wish to scale your output to a range of 10 to 15 wt%, the procedure is as
follows:
► Press [4 mA Equals]
► Enter the value 10 (wt%), the lowest value, corresponding to 4 mA
► Press [Enter] (automatic return to the 4~20 mA OUT1 or 2 page)
► Press [20 mA Equals]
► Enter the value 15 (wt%), the highest value, corresponding to 20 mA
► Press [Enter] (automatic return to the 4~20 mA OUT 1 or 2 page)
CAUTION:
Scaling the output to a high range, i.e. 0~100 wt%, results in loss of accuracy. The
accuracy of the output is 0,05 % of scale. Choosing a smaller range (difference
between low and high value) results in a better resolution. In the above example, the
accuracy of the output is 0,1% of (15-10), which equals 0,0025 wt%.
2.2.4 Error communication through analog outputs
During an inline analysis, conditions may not always be perfect to perform a correct
measurement. The analyzer automatically detects when the liquid is not
homogeneous, or when gas bubbles are present, generates errors and initially holds
its last valid reading.
In most processes, upset conditions may occur incidentally, due to not completely
dissolved gases. The analyzer freezes the measurement during these conditions.
Too long freezing may lead to a constant output, which in turn may lead to the
conclusion that the process is perfect. To signal a too long duration of upset process
conditions, the analyzer can react to these errors in four different modes.
Force Low: force output to 3mA after XXX seconds
Force High: force output to 20mA after XXX seconds
Force Update: force output to maintain measurement (only for Temp and
Gain)
Hold last: Hold last correct measured value
Determine first:
How long do I allow the system not to signal any upset process conditions?
What milli-Amp value do I wish to receive when erratic conditions continue for
a too long period of time?
From the analog output menu, press Error
Mode
Figure 13: ERROR MODE OUT 1 page

Software Version: 2.3.3 Date: 8 August, 2012 Page 14/46
Example: The output should force low when 120 seconds of continuous loss of signal
occurs.
► Press [Error Mode] on the 4~20 mA output 1 or 2 menu.
► On the Error mode OUT 1 page, press the button of your choice:
► Press the [Force Low]
► Enter “120” (via pop up keypad)
► Press [Enter]
► Press [Accept]
After the specified number of seconds, the 4~20 mA OUT will be forced to the
specified level (Low level is 3 mA, High level is 21 mA).
Repeat this procedure for 4~20 mA OUT 2
NOTE
When you wish to output temperature, set to “Force update” (no time can be set).
2.2.5 Decay time
Smoothing is strongly recommended, since it gives you more accuracy. In addition,
rapid changes in concentration are being smoothed, hence the output value more
represents the “bulk” value of the liquid. When fast response is not required, we
strongly recommend setting the τ63 time between 5 and 20 seconds. Since
smoothing affects the response time, the best setting is a trade-off between accuracy
and response time.
A decay rate of 5 seconds is recommended for most applications.
Figure 14: DECAY TIME page
2.3 Display configuration
Purpose:
Define the parameters you wish to be
viewed during normal operation.
Define damping.
Define the resolution on the display.
2.3.1 Selecting the results
Normally, you wish to view the concentration as main parameter, and the
temperature as second parameter (shown small). Should your analyzer be capable
of measuring more chemical components, you may wish to select another
component. In addition, it is possible to view other, secondary parameters, such as
sound speed or Ultrasonic attenuation, for specific evaluations.
The procedure is as follows:
Example: Concentration, i.e. Original Extract in ºP must be the primary measurement
result. The temperature should be shown in smaller numbers, as secondary result.
NOTE: This procedure does not affect the output and alarm configurations.

Software Version: 2.3.3 Date: 8 August, 2012 Page 15/46
► From the Configuration menu, press [Display]
► On the Display configuration menu, press [Source 1 name] to go the the Source
1menu
► Here you can choose between the Calculated polynomial (the concentration) and
one of the measured value’s
If you choose for Calculated Polynom:
►Press [Polynom 1 or 2 calculated]
You will be returned to the Display configure
menu.
If you chose for one of the Measured values:
►Press the button [More settings]
►Press the button of the desired value
You will be returned to the Display configure
menu.
Figure 15: DISPLAY CONFIGURE page
NOTE: The same steps have to be followed to set Source 2
2.3.2 Setting the display resolution
This menu allows you to toggle between 2 digits and 3 digits resolution. This setting
does not affect the output resolution. The 3-digit resolution may be selected when
additional readout accuracy is required, which is useful during field calibrations. For
additional readout accuracy, it is recommended to apply some display smoothing
too. See next section for details.
► On the Display configuration menu, press [Resolution]
► Press [2Digits] or [3 Digits] on the Resolution page (automatic return to the
Display configuration page)
2.3.3 Display smoothing
This setting is the same as the decay time for the analog outputs. The result is that
concentration values are smoothened before they are sent to the output.
A decay rate of 5 seconds is recommended for most applications.
2.3.4 Graph scaling
Purpose:
During normal operation of the analyzer, you can activate additional screens, such as
the graphs, allowing you to see the trend of the results as configured in the previous
section. The graphs show the trend of the results over the last 15 minutes of
operation.
The scaling of the graph is done in this section.
Define the scales of the 2 graphs (Y-axis starting and ending points).
The plotted results are those which were configured in the display menu.
Once you have reached the menu through Configuration –Display:
► Press [Trend configuration]

Software Version: 2.3.3 Date: 8 August, 2012 Page 16/46
► Press [Min/Max value y-axis 1/2]
Now you can enter the values that should
correspond to minimum and maximum of the y-
axis 1 and y-axis 2 (via pop-up keypad)
► Press [Trendline sampling time]
Now you can enter the time that should
correspond to the time a trend value is written
on the graph.
NOTE: The graph will plot the results which are
monitored by the display. Should you wish to
plot other results, then this is only possible by
changing the display source value.
Figure 16: DISPLAY CONFIGURATION GRAPH 1 page
2.3.5 Backlight turn off time
This setting allows you to set the time that the backlight has to be turned OFF automatically.
If the backlight doesn’t have to be turned OFF, enter 0 minutes. Touching the screen will turn
the backlight ON. The set time has a fixed cycle
and starts when the display is powered ON, so it
can happen that if you touched the screen the
backlight is turned OFF within the set time.
2.4 Sensor parameters
2.4.1 Introduction
When replacing a probe, it is necessary to
enter the probe constants as supplied on the
Probe Calibration Data Sheet (PCDS).
Figure 17: SENSOR page
2.4.2 Procedure
Obtain the Probe Calibration Data Sheet. The serial number of the probe is
indicated on the sheet.
From the main menu, choose Configuration –Sensor –US sensor
Check or modify the data as indicated on the data sheet
NOTE: If a probe is replaced, the previous data sheet is no longer valid.
2.4.3 Instructions:
► On the Configuration menu, press [Sensor]
► On the Sensor menu Press [Ultrasonic]
The following menu appears:
► Enter the appropriate values and confirm with
[Enter] to return to this page.
► Press [Auto Dead time Cal.] to choose ON or
OFF (see next section for details)
► Press [Accept] (automatic return to the Sensor
parameters page)

Software Version: 2.3.3 Date: 8 August, 2012 Page 17/46
Figure 18: ULTRASONIC PROBE CONFIGURATION page
2.4.4 Auto dead time
2.4.4.1 Introduction
The auto dead time function takes care of variations in the “dead time”, a probe-
specific variable which is determined in the factory and is used to measure precisely
the actual transit time in the liquid. The dead time is an important value and may
change in time.
The instrument has a built-in feature that performs this vital calibration automatically
during normal process conditions, carefully checking that the necessary
circumstances are meeting the same conditions as in the factory, during the final
calibration and quality control procedure.
When leaving the “Ultrasonic Probe Configuration” page the setting of the auto dead
time is automatically set to “OFF”.
2.4.4.2 Advantages.
The Auto-dead-time enhances the reliability of the measurement, as it continuously
checks and adapts the dead time value without operator attention and the need to
return the probe to the factory for recalibration. When the Ultrasonic connecting
cable is replaced with the same, a longer or a shorter cable, there is no need to
manually adjust the dead time.
2.4.4.3 Procedure.
► With the sensor in water, free of gas bubbles, with a low concentration solids and
dissolved components.
► Press Auto Dead Time and select ON.
When the probe is installed in a filled pipe line, and process conditions are
considered to be stable, which is determined by the analyzer, it will perform
continuous measurement of the system dead time. You are still able to enter a
number in the Dead Time field, however the instrument will automatically correct the
entered value to the correct value. The Auto Dead Time is only working if the
“Ultrasonic Probe Configuration” page is displayed.
►The value of the dead time has to change after pressing ON but this can take a
minute.
► When the number in the field is giving a stable value (normally between 1100 and
1200), Press Auto Dead Time and select OFF or leave the page.

Software Version: 2.3.3 Date: 8 August, 2012 Page 18/46
2.5 Alarm configuration.
2.5.1 Introduction
Alarm relays are provided for monitoring specific measured concentrations. The
analyzer allows you to define which parameters are monitored, and at what values
the relays should be possible. In addition, you may select whether the alarms are
activated during fault conditions (Normal) or activated when no alarm is present
(inverted operation).
2.5.2 Preparation.
Determine which value you wish to monitor with each alarm.
Determine whether you wish the alarm relay contacts to be activated during
normal operation (no alarm) or during a fault condition. This decision has
consequence for the alarm wiring, as a Normally Open (NO) contact will be
closed when the value falls within the low and high limit.
Determine high and low trip points for each alarm.
NOTE
The analyzer has a database with specific set points for each individual beer type. As
the adjustment of the set points is liquid type dependant, the procedure for changing
the set points is covered in chapter “Liquid selection and editing”, paragraph “Editing
liquids”.
2.5.3 Procedure
► Through the Configuration menu, press [Alarm]
► After choosing Alarm 1 or Alarm2, press [Alarm 1/2 name/unit] to choose the
parameter to be monitored.
► Here you can choose between the Calculated polynomial (the concentration) and
one of the measured value’s
If you choose for Calculated Polynom:
►Press [Polynom 1/2 calculated]
You will be returned to the Alarm 1 or 2 menu.
If you chose for one of the Measured values:
►Press the button [More settings]
►Press the button of the desired value
You will be returned to the Alarm 1 or 2 menu.
Figure 19: ALARM 1 page
NOTE: Usually this would be the main parameter, i.e. concentration in %w/w.
► Press [Low Alarm]
► Enter the value that should correspond to low alarm (via pop up keypad)
► Press [Enter] (automatic return to the Alarm 1 page)
► Press [High Alarm]
► Enter the value that should correspond to high alarm (via pop up keypad)
► Press [Enter] (automatic return to the Alarm 1 page)
► Press [Accept] (after pressing Accept it may take up to 10 seconds to return to
the Alarm configuration page)

Software Version: 2.3.3 Date: 8 August, 2012 Page 19/46
Repeat these steps for Alarm 2 if desired.
IMPORTANT:
Changes made to the alarm settings of an individual liquid will remain valid until the
alarm settings for this liquid are changed again.
2.6 Trouble shooting
2.6.1 Preparation.
For trouble shooting, it is important to record as much data as possible
Use of the memory stick feature allows you to log measurement data
The memory stick can be used to download all settings of the analyzer
The memory stick can be used to download a typical waveform, which can be
useful for trouble shooting
Record other observations, i.e. pipe full/empty and/or laboratory gathered
samples with results and time tag, in order to compare with the analyzer
results
For factory back-up, you can send stored files with your comments, facilitating
fast response from the factory
2.6.2 Memory Stick Logging
Slide the empty USB memory stick in the U-A connector of the display
Check that the USB memory stick flashes, indicating write/read actions
Wait until the continuous flashing stops (the display is making folders on the
USB stick, this should take about 5
minutes)
Open “Logging” in the Information /
Diagnostics menu
Enter the log sampling time
Press “Start logging”. The main
measurement page should indicate that
the logging process is active.
All main data, detail data, and a time tag is
recorded in a temporary file on the memory
stick.
Figure 20: LOGGING page
IMPORTANT
Never take out the memory stick without stopping the log process first
ALWAYS wait until the memory stick stops flashing (may take several minutes)
The data will be stored in the following folder: RHO\SAMPLE\. In this folder, you will
find folders, indicating the day in the format YYMMDD. After day, the last data is
assembled in a .CSV file, and a new folder is created for the next day of logging.
The .CSV files can be easily opened with Excel. The stored .BIN files are temporary
files and cannot be opened, converted or used otherwise.
2.6.3 Procedure to stop logging on USB memory stick
Press “Stop & Save Log to USB”

Software Version: 2.3.3 Date: 8 August, 2012 Page 20/46
Wait until the page “Saving data to USB” is disappeared from the screen, this
may take up to 5 minutes
Remove USB stick and check the log data with Excel
Table of contents
Other Rhosonics Measuring Instrument manuals