RigExpert AA-2000 ZOOM User manual

AA-2000 ZOOM RigExpert®
User’s manual
Antenna and cable analyzers

For latest manuals and software updates,
please visit
http://rigexpert.com
.

4
5
5
5
6
6
7
7
8
8
8
9
9
10
10
11
12
13
13
14
21
24
24
25
26
31
32
36
38
Introduction
Operating the AA-2000 ZOOM
First time use
Main menu
Multifunctional keys
Connecting to your antenna
SWR chart
Chart ZOOM
Data screen
Frequency and range entry
Return loss chart
R,X chart
Smith chart
Memory operation
SWR mode
Display all parameters
MultiSWR mode
Applications
Antennas
Coaxial lines
Measurement of other elements
Annexes
Annex 1: Specifications
Annex 2: Precautions
Annex 3: Tools menu
Annex 4: Setup menu
Annex 5: TDR mode
Annex 6: Calibration
Annex 7: Dummy loads
Table of contents

User’s manual
Thank you for purchasing a RigExpert
AA-2000 ZOOM Antenna and Cable Analyzer! We
did our best to make it powerful yet easy to use.
The analyzer is designed for measuring SWR
(standing wave ratio), return loss, cable loss,
as well as other parameters of cable and
antenna systems in the range of 100 kHz to
2000 MHz. A built-in ZOOM capability makes
graphical measurements especially effective.
An integrated Time Domain Reflectometer
mode can be used to locate a fault within the
feedline system. The analyzer is equipped
with a
Bluetooth Low Energy
module for a
wireless connection with your laptop, tablet or
smartphone.
The following tasks are easily accomplished by
using this analyzer:
• Rapid check-out of an antenna
• Tuning an antenna to resonance
• Comparing characteristics of an antenna
before and after specific event (rain, hurricane,
etc.)
• Making coaxial stubs or measuring their
parameters
• Cable testing and fault location, measuring
cable loss and characteristic impedance
• Measuring capacitance or inductance of
reactive loads
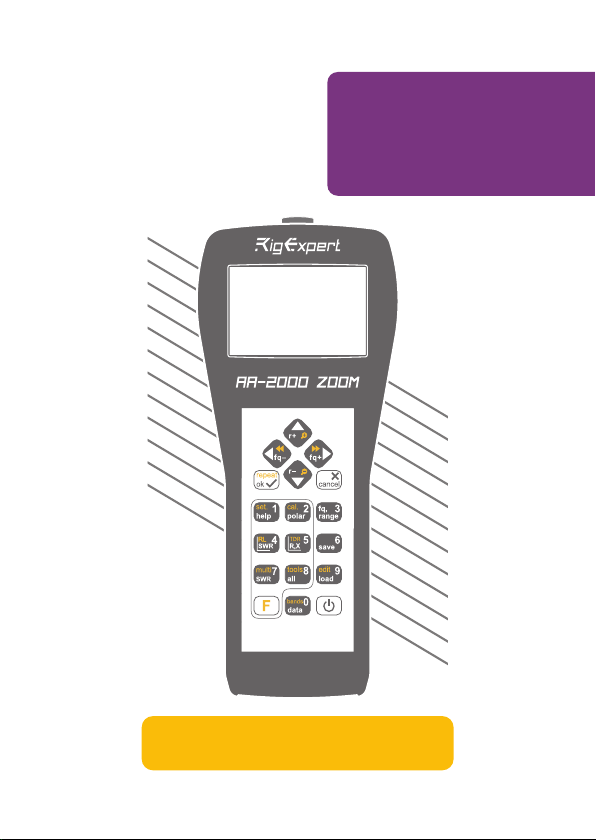
1. Antenna connector
2. Color display
3. Keypad
4. USB connector
4
Introduction
1
2
3
4

RigExpert AA-2000 ZOOM
Main menu
The Main menu acts as a starting point
from where different tasks may be
launched.
Use (Cursor up) and (Cursor
down) keys to scroll through the menu,
then press (OK) to select an item.
For your convenience, a battery
indicator is shown at the top-left corner
of the screen. This indicator is replaced
with a USB icon when the analyzer is
connected to your computer.
The analyzer will be turned off automatically if not in use for too long.
First time use
Please insert three AA sized
batteries (alkaline , Ni-MH or LiPO
accumulators) into the battery
compartment of the analyzer,
watching the polarity.
Press the (Power) key located at the bottom-right corner of the keypad to turn
on the analyzer. After displaying the initial message (showing a firmware version and a
serial number of the instrument), a Main menu appears on the screen.
You may use hot keys for the quick access to certain tasks. For instance, press
the
(SWR chart) button to open the SWR chart screen immediately.
5
Operating the
AA-2000 ZOOM

User’s manual
Multifunctional keys
Most keys on the analyzer’s keypad perform
several functions.
For instance, numbers (1) are used to enter
frequency and other numerical parameters.
Main functions (2) provide quick access to most
common tasks. Alternative functions (3) are
executed if the user holds the (Functional)
key. For the convenience, alternative functions
are marked with yellow.
You may press the (Help) key to open a help screen listing all active hot keys.
Connecting to your antenna
Plug the cable to your analyzer’s antenna connector, and then tighten the rotating
sleeve. The rest of the connector, as well as the cable, should remain stationary.
If you twist other parts of the connector when tightening or loosening, damage may
easily occur. Twisting is not allowed by design of the N-connector.
6
1
2
3

RigExpert AA-2000 ZOOM
Chart ZOOM
Use the arrow keys to increase or decrease the center frequency or the scanning range.
Watch the chart zooming in or out, or changing its position. Use the (Functional
key) and (Cursor up) or (Cursor down) key combination to zoom the vertical
scale of the chart.
SWR chart
Once your antenna is connected to
the analyzer, it is time to measure its
characteristics. Press the (SWR
chart) key to open the SWR chart screen,
then press (OK) to start a new
measurement.
A few moments later, the result will be
displayed on the analyzer’s screen.
Press the + key combination to
run a continuous sweep.
A small triangle at the bottom of the chart corresponds to a point at which the SWR
reaches its minimum.
Do not forget to press the (OK) key for the new measurement to start.
Press (Functional key) and to quickly choose a radio amateur band.
7

User’s manual
Data screen
The data screen is available in all chart
modes. Press the (Data) key to
display various parameters of a load at
cursor.
Frequency
and range entry
To enter the center frequency or the
sweep range, press the (Frequency,
Range) key.
Use cursor keys to navigate, or the
to keys to enter values. Do not forget
to press the (OK) key to apply.
Press (Up) or (Down) cursor keys while holding
the (Functional) key to quickly choose a radio amateur band.
Return loss chart
The return loss (RL) chart, which is very similar to the SWR chart, is activated by
pressing the (Functional key) and (RL chart) key combination in the Main
menu.
8

RigExpert AA-2000 ZOOM
R,X chart
Press the (R,X chart) key in the
Main menu to access the R,X chart mode.
Positive values of reactance (X)
correspond to inductive load, while
negative values correspond to capacitive
load.
The chart will display R and X for series
or parallel models of a load. Press
(Functional key) and to switch
between these models.
Smith chart
The (Smith chart) key opens a
screen where the reflection coefficient is
plotted on the Smith chart.
For a list of hot keys, press the
(Help) key, as usual.
A small marker is used to indicate the center frequency.
The marker at the bottom of the screen shows a resonant
frequency closest to the center of the scan.
9

User’s manual
Memory operation
Device has 250 unified slots for storing
your records. Record operations are
linked to relevant data screens - SWR,
RX, RL, Smith charts mark their records
with ‘Z’ slot identificator, TDR chart
marks with ‘T’ identificator.
SWR mode
To watch the SWR at a single frequency,
press the (SWR) key.
Do not forget to press the (OK)
key to start or stop the measurement.
Change the frequency with (Left)
or (Right) cursor keys, or press
the (Frequency) key to enter a new
frequency.
Use and to switch between meter and trend view.
Use , , or and respectively for
Load, Save or Edit Name operations in relevant data screens.
10

RigExpert AA-2000 ZOOM
Display all parameters
To display various parameters of a load
on a single screen, press the (All)
key.
Do not be confused by negative values of L or C. This can be useful for
experienced users.
This screen displays values for
series
as well as
parallel
models
of impedance of a load.
11
• In the
series
model, impedance is
expressed as resistance and reactance
connected in series:
• In the
parallel
model, impedance is
expressed as resistance and reactance
connected in parallel:
R
X
Z = R + jX R X
Z = R ||+ jX

User’s manual
MultiSWR mode
Press the (Functional key) and
(Multi) key combination to see the SWR
at up to five different frequencies. This
mode may be useful for tuning multi-
band antennas.
Use (Up) and (Down) cursor keys to select a frequency to be set or changed,
then press the (Frequency) key to enter a new value. Do not forget to press the
(OK) key to start the measurement.
12

RigExpert AA-2000 ZOOM
The picture on the left shows the result
for one band real antenna.
The next screen shot shows result for 50
Ohm calibrated load, making in such way
ideal all-band antenna (in mathematical
terms only).
Antennas
Checking the antenna
It is a good idea to check an antenna before connecting it to the receiving or transmitting
equipment. The SWR chart mode is good for this purpose. Also you can use Multé
tool located in Tools. Multé will check your rig against all HAM bands defined in your
region and rate all bands where SWR lower than 3.0 in range of 1...5 stars. Select band
for detailed evaluation and press to run SWR chart for this band.
13
Applications

User’s manual
Adjusting the antenna
When the measurement diagnoses that the antenna is off the desired frequency, the
analyzer can help in adjusting it. Physical dimensions of a simple antenna (such as a
dipole) can be adjusted knowing the actual resonant frequency and the desired one.
Other types of antennas may contain more than one element to adjust (including coils,
filters, etc.), so this method will not work. Instead, you may use the SWR mode, the
All parameters mode or the Smith chart mode to continuously see the results while
adjusting various parameters of the antenna.
For multi-band antennas, use the MultiSWR mode. You can easily see how changing
one of the adjustment elements (trimming capacitor, coil, or physical length of an
aerial) affects SWR at up to five different frequencies.
Coaxial lines
Open- and short-circuited cables
The pictures on the right show R and
X charts for a piece of cable with
open- and short-circuited far end. A
resonant frequency
is a point at which X
(reactance) equals to zero:
• In the open-circuited case, resonant
frequencies correspond to (left
to right) 1/4, 3/4, 5/4, etc. of the
wavelength in this cable;
• For the short-circuited cable, these
points are located at 1/2, 1, 3/2, etc.
of the wavelength.
14

RigExpert AA-2000 ZOOM
Cable length measurement
Resonant frequencies
of a cable depend on its length as well as on the velocity factor.
A
velocity factor
is a parameter which characterizes the slowdown of the speed of
the wave in the cable compared to vacuum. The speed of wave (or light) in vacuum is
known as the
electromagnetic constant
:
c
=299,792,458 meters (or 983,571,056 feet)
per second.
Each type of cable has different velocity factor: for instance, for RG-58 it is 0.66.
Notice that this parameter may vary depending on the manufacturing process and
materials the cable is made of.
To measure the physical length of a cable,
1. Locate a resonant frequency by using the R,X chart.
Example:
The 1/4-wave resonant frequency of a
piece of open-circuited RG-58 cable is
4370 kHz.
2. Knowing the
electromagnetic
constant
and the
velocity factor
of the
particular type of cable, find the speed of
electromagnetic wave in this cable.
299,792,458
×
0.66 =
197,863,022 meters per second
- or -
983,571,056
×
0.66 =
649,156,897 feet per second
15

User’s manual
Velocity factor measurement
For a known
resonant frequency
and physical length of a cable, the actual value of the
velocity factor
can be easily measured:
3. Calculate the physical length of the
cable by dividing the above speed by
the resonant frequency (in Hz) and
multiplying the result by the number
which corresponds to the location of this
resonant frequency (1/4, 1/2, 3/4, 1, 5/4,
etc.)
197,863,022 / 4,370,000
×
(1/4) =
11.32 meters
- or -
649,156,897 / 4,370,000
×
(1/4) =
37.14 feet
3. Finally, find the
velocity factor
.
Just divide the above speed by the
electromagnetic constant.
Example:
5 meters (16.4 feet) of open-circuited
cable. Resonant frequency is 9400 kHz
at the 1/4-wave point.
2. Calculate the speed of electromagnetic
wave in this cable. Divide the length
by 1/4, 1/2, 3/4, etc. (depending on the
location of the resonant frequency), then
multiply by the resonant frequency (in
Hz).
5 / (1/4)
×
9,400,000 =
188,000,000 meters per second
- or -
16.4 / (1/4)
×
9,400,000 =
616,640,000 feet per second
1. Locate a
resonant frequency
as
described above.
188,000,000 / 299,792,458 = 0.63
- or -
616,640,000 / 983,571,056 = 0.63
16

RigExpert AA-2000 ZOOM
Cable fault location
To locate the position of a probable fault in a cable, just use the same method as when
measuring its length. Watch the behavior of the reactive component (X) near the zero
frequency:
• If the value of X is moving from –∞ to 0, the cable is open-circuited:
• If the value of X is moving from 0 to +∞ , the cable is short-circuited:
17

User’s manual
Making 1/4-λ, 1/2-λ and other coaxial stubs
2. Cut a piece of cable slightly longer than
this value. Connect it to the analyzer. The
cable must be open-circuited at the far
end for 1/4-λ, 3/4-λ, etc. stubs, and
short-circuited for 1/2-λ, λ, 3/2-λ, etc.
ones.
A piece of 1.85 m (6.07 ft) was cut.
The margin is 10 cm (0.33 ft). The
cable is open-circuited at the far end.
3. Switch the analyzer to the All
parameters measurement mode. Set the
frequency the stub is designed for.
28,200 kHz was set.
4. Cut little pieces (1/10 to 1/5 of the
margin) from the far end of the cable until
the X value falls to zero (or changes its
sign). Do not forget to restore the open-
circuit, if needed.
11 cm (0.36 ft) were cut off.
1. Calculate the physical length. Divide
the electromagnetic constant by the
required frequency (in Hz). Multiply the
result by the velocity factor of the cable,
then multiply by the desired ratio (in
respect to λ).
299,792,458 / 28,200,000
×
0.66
×
(1/4) = 1.75 meters
- or -
983,571,056 / 28,200,000
×
0.66
×
(1/4) = 5.75 feet
Pieces of cable of certain electrical
length are often used as components of
baluns (balancing units), transmission
line transformers or delay lines. To make
a stub of the predetermined electrical
length,
Example:
1/4-
λ
stub for 28.2 MHz, cable is RG-
58 (velocity factor is 0.66)
18

RigExpert AA-2000 ZOOM
Measuring the characteristic impedance
The
characteristic impedance
is one of the main parameters of any coaxial cable.
Usually, its value is printed on the cable by the manufacturer. However, in certain cases
the exact value of the characteristic impedance is unknown or is in question.
To measure the characteristic impedance of a cable,
1. Connect a non-inductive resistor
to the far end of the cable. The exact
value of this resistor is not important.
However, it is recommended to use 50 to
100 Ohm resistors.
Example 1: 50-Ohm cable with 75
Ohm resistor at the far end.
Example 2: Unknown cable with 50
Ohm resistor at the far end.
2. Enter the R,X chart mode and make
measurement in a reasonably large
frequency range (for instance, 0 to 200
MHz).
Example 1:
50-Ohm cable
Example 2:
Unknown cable
19

User’s manual
3. Changing the display range and
performing additional scans, find a
frequency where R (resistance) reaches
its maximum, and another frequency
with minimum. At these points, X
(reactance) will cross the zero line.
Example 1:
4.46 MHz – min., 8.92 MHz – max.
Example 2:
3.47 MHz – max., 7.16 MHz – min.
4. Switch to the Data at cursor screen
by pressing the (Data) key and
find values of R at previously found
frequencies.
Example 1:
36.2 Ohm – min., 71.6 Ohm– max.
Example 2:
114.0 Ohm– max, 50.0 Ohm – min.
5. Calculate the square root of the
product of these two values.
Example 1:
square root of (36.2
×
71.6) =
50.9 Ohm
Example 2:
square root of (114.0
×
50.0) =
75.5 Ohm
20
The Tools menu (see page 26) contains several automated tools for coaxial line
calculations.
Table of contents
Other RigExpert Measuring Instrument manuals

RigExpert
RigExpert AA-170 User manual

RigExpert
RigExpert REAMP User manual

RigExpert
RigExpert AA-35 ZOOM User manual

RigExpert
RigExpert ZOOM series Mounting instructions

RigExpert
RigExpert AA-650 ZOOM User manual

RigExpert
RigExpert Stick Pro User manual

RigExpert
RigExpert AA-3000 ZOOM User manual

RigExpert
RigExpert AA-230 ZOOM Mounting instructions

RigExpert
RigExpert AA-30 User manual

RigExpert
RigExpert AA-1500 ZOOM User manual