TECHNO-AC SUCCESS CBI-436N Manual


2
1. Design and principle of operation
Cable locator «Success CBI-436N» is designed for:
-Detection of energized cables (50-60 kHz mode) underground up to 6 m depth
-Survey the ground before the ground works (“Broadband” mode with frequency range between
0.05 and 8.6 kHz)
-Indirect measurement of the depth.
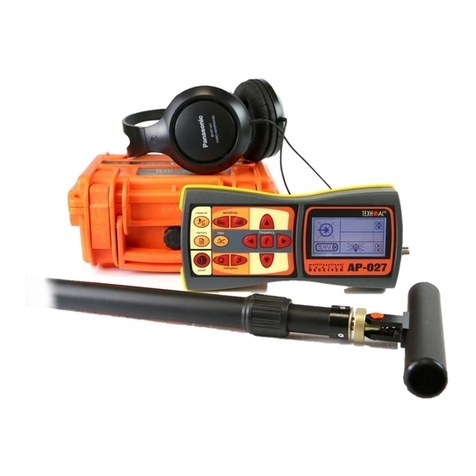
Kit components are:
1–Electromagnetic sensor EMD-247
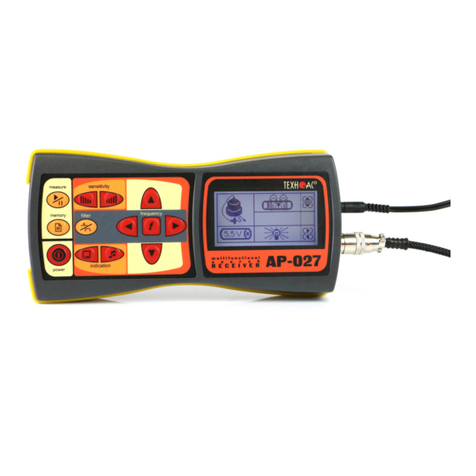
2–Receiver АP-027
3–Headphones
Operation conditions
- Ambient temperature, °С ...........................................................-20 to +50
- Relative humidity, % ............. .....................not more than 85 % at t = 35 ° C
1 2
3

3
2. Receiver AP-027
Appearance and Controls
Fig. 2.1
932
1
6
5
7
84
10 11
12
13
14
15
1 power on/off button 9▲/▼ selected parameter adjustment
buttons (up/down)
2visual indication type button 10 frequency button (filter frequency
adjustment on/off)
3sound indication type button 11 LCD screen
4◄/► parameter selection buttons (left/
right) 12 headphones jack
5filter button (broadband on/off) 13 sensors connector
6memory button 14 protective insert
7start/pause button
(measurement mode) 15 external power supply socket
8 / sensitivity buttons (higher/lower)
Technical specifications of the Receiver are listed in Appendix A.
Screen controls are listed in Appendix B.
*Set of external PowerBank (for
example, Xiaomi Mi Power Bank
20000 mAh with protective case and
power adaptor питания SAMSUNG
ART-U90EWE 5.0 V/2.0 A)
2.1 Preparing Receiver AP-027 for operation
1. Insert 4 AA elements in battery compartment of the receiver, observing the polarity. Pic
2.1 p.14 If accumulators are used, they should be fully charged with charger, supplied
separately.
Receiver cab also work from external PowerBank, supplied separately*.
NOTE
AP-027 automatically switches to external power supply, when connected to PowerBank.
Some models of PowerBanks should be activated by pressing separate button on their body.
When working at negative temperatures (to -20°С) place PowerBank under clothes.

4
2. Set the receiver on the holder
3. Put one end of the holder below protective rubber of the receiver.
4. Put other end of the holder below the second rubber
5. The receiver is ready for the operation.
It is recommended to adjust the length of the neck strap for more comfort during operation.

5
4. Operation sequence in passive cable route detection mode
Fig. 4.1
Used equipment:
1. Connect the electromagnetic sensor and
headphones to the corresponding receiver
connections headphones (if necessary)
4.1 Connection of sensors and check of the receiver operability
2.1 To set the electromagnetic sensor from
transport to operating position. In order to do
that: loosen the locking nut (1), extend the
bar (2) to a required length and fix with the
locking nut
2.2
Loosen the locking nut (1) and install the electromagnetic sensor
(2) in a position used in route detection. Fix the position with the
locking nut. Horizontal position – is used for route detection by
maximum method, and transport position for route detection by
minimum method
3. Turn on
the receiver
AP-027
electromagnetic
sensor EMD-247
receiver
AP-027
1. 2.
1. 2.
headphones

6
4. In the start window of the receiver display:
Check the charge status of the batteries the charge
should be no less than 4,0 V). If the battery charge is low,
replace the batteries.
Check accuracy of the
sensor connection. If a
«no sensor» symbol ,
is lit on the display, check
if the sensor is connected
correctly.
Check the received signal type
as «continuous» (by any of
buttons ▲/▼)
Set the necessary level of receiver
display backlighting, using ◄/► buttons
Fig. 4.2
If it necessary, change the
frequency of the second filter
by changing the number of
harmonic component «f
HRM
» to
another by buttons or .
№2
4.2 Conduct receiver setup
For tracing of energized
cables please set
frequency 50 Hz.
1. Switch on the
measurement mode
using the button
5. Set input signal level using
sensitivity buttons and
Level (at the bottom of the scale)
must be within 50 ... 90% of the
maximum
2.
To select the necessary
frequency press the frequency
button . symbol will appear
3. Using buttons ◄/►, set
the desired frequency in the
filtration zone
for example, 50 Hz
4.
Leave the filter adjustment
mode by pressing the frequency
button .
Indicator
will appear in the volume
adjustment zone
6.
Set an acceptable volume
level volume using
◄/►
buttons
7. Moving along the route,
it is necessary to move the
electromagnetic sensor across
the route in one and the other side
to maintain a maximal level of the
signal.
Attention! input overload can lead
to the wrong interpretation of data

7
8. Set the required gain factor of filtered signal to
«×1/2/4/8», by pressing buttons ▲/▼
9. Commence detection or tracing according to the
method set in p.4.3, avoiding prolonged input/output
overloads
4.3 Route location methods
1.The Maximum method
This method consists of positioning the electromagnetic sensor in the direction of the magnetic
field created by the utility radiation (fig.4.3). EMD antenna must be positioned horizontally and
the sensor placed in a plane perpendicular to the cable route. In this case the maximum signal
level is observed when the sensor antenna
passes directly above the utility line. The
maximum method is intended for a quick
route location. Flat peaks of the signal
level curve do not allow for high location
accuracy, but enables a quick route
location.
2. The Minimum method
When the EMD antenna in a vertical (transport) position is placed directly above the route
the signal is at its lowest level fig. 4.4. As the distance from the point directly above the pipeline
increases, the signal level first rises sharply then slowly decreases. This is the minimum method,
which is used to determine a more precise
route location (after quick route tracing
using maximum method.
Horizontal
position
Fig. 4.4
Fig. 4.3
Vertical
position
The Maximum method
The Minimum method

8
5. Additional features
5.1 Task: Indirect electromagnetic mode of depth
measuring
Equipment used: receiver AP-027, electromagnetic
sensor EMD
Tip: When determining the depth, one should take into
account the terrain. In order to obtain precise results, select
flat surface areas.
Method: 1. Find the precise pipeline route location
(preferably using the minimum method). Mark the spot.
2. Fix the sensor antenna at a 45 angle to the ground surface,
minimum of the signal is observed at a distance from the point
«above the route», equal to the depth of the utilities, when the
antenna axis intersects the axis of the route. This is the indirect
method of measuring the depth of utility (fig. 5.1)
5.2 Task: Detecting the pipeline and utility lines intersection point.
Equipment used: receiver AP-027, electromagnetic
sensor EMD, headphones.
Fig.5.1
Fig.5.2
Method: 1. Perform preliminary pipeline route location.
2. Turn on the receiver and set it up for broadband.
3. Рosition the electromagnetic antenna over the
pipeline, parallel to the pipeline route (signal level
displayed on the receiver screen will be close to zero)
(fig. 5.2). Perform route location in accordance with
the maximum method. When following the route, the
intersection points with utility lines can be identified by
the maximum signal.

9
Appendix A
Technical specification receiver AP-027
Parameter Tracing
Type of accepted signal Uninterrupted /pulse
Frequencies of the receiver’s
filter
Central frequency of quasi-resonant filter 50..60
Hz,100….450 Hz through 50 Hz,
120…540 Hz through 60 Hz,
512 Hz / 1024 Hz / 8192 Hz/ 33kHz
«Broadband», (operating
mode) 0,05 …8,6 kHz
Gain factor 100 dB
Visual indication
Liquid-crystal display- symbols and meaning of the chosen
modes and parameters.
-animated (moving) scale of the output signal level
- digital value and animated (moving) scale of the output
signal level
-graphic (moving diagram) of the output signal level
- frequency content of the output signal level
-digital and graphic display of output signal levels kept in the
“memory’.
Sound indication
Headphones natural broadband or filtered signal.
Headphones-synthesized
sound. Frequency
modulation
Built-in emitter -
synthesized sound.
Frequency modulation
Supply Voltage 4…7 V.
- alkaline batteries АА type 1,5 V (4 pcs.).
Time of continuous
operation not less than
20 h
Automatic shutdown when
the device is not active After 30 minutes of inactivity
Ambient temperature, C Minus 20 C ..+50 C
Weight of the electronic
unit, kg
0,46
Ingress protection rating IP54

10
Appendix B
Switching-on the receiver
1. Switching-on the receiver
When the receiver is switched on, the display shows the following sequence: manufacturer’s
trademark (logo) «TECHNO-AC», Business card of the Receiver with the Software version number
and the Start window (fig.А.1).
When switching the receiver with the button while
holding button , after Business card Window of network
frequency selection will appear. Frequency of 50 Hz or
60 Hz is selected by any of button ◄/►, and «input» with
transfer to Start window is performed by pressing the button again
.
2. The start window
The start window displays the following information:
Fig.А.1
voltage indicator
When power voltage ≤4.0V after
switching on the warning signal
is heard, when power voltage ≤
3.8V there is the image of fully
discharged battery and the
device will automatically
switch off after
type of the sensor
connected
Sensor not connected
Acoustic sensor(AD)
Electromagnetic sensor(EMD)
type of signal received
when working with AD
- «sound of liquid leakage (continuous acoustic signal)
- «sound generated by an impact (acoustic impulses during transmitter
operation)
During work with electromagnetic sensor
-continuous signal from the power network, cathode protection of
trace generator
- pulsed signal of trace generator
- Dual-frequency signal of the trace generator
indicator backlighting intensity
There are four levels of indicator
backlighting intensity
/ / /
Fig. А.2
parameters of detector of
harmonic component with net
frequency
№ and frequency of harmonic
component of net frequency (for the
second filter)
indicators of used buttons
Type of signal received, available
for this of the sensor is selected
by ▲/▼ buttons
№ of harmonic component of
the net frequency (for the second
filter) is selected by buttons
/
Indicator backlighting intensity is
selected by the buttons◄/►
Return to the Start Window from measurement mode is performed by pressing ((pause
mode) and .

11
3. Scale window
When measurement mode is selected (except the two-frequency), Scale working window
appears first fig.А.3.
Fig. А.3
Visual indication button can lead to the indication modes of Graph (fig.А.4) and Acoustic
signal spectrum(fig.А.5) or Power range spectrum (fig.А.6) and Broadband electromagnetic
range (fig.А.7).
Sensitivity
- sensitivity symbol
«_dB» -the value of input
amplification factor(0…62dB
adjusted by using / )
- ensitivity scale
Two-segment scale
reflects the processed signal
Light segment:
- in the mode -current
value of the signal (valid +
interference):
- in the mode - current
value of the signal for the previous
second (pulse amplitude).
Dark segment:
-in the mode - level of the
processed valid signal;
- in the modes and
-current signal
level(valid+ interference)
A completely filled scale
signifies output overload
Filtering
Displays the frequency range
scales with numerical and graphical
representation of the pass band
During work with AD:
- pass band filter
- broadband
During work with EMD
:
- central frequency of the
narrow band filter
- broadband
Presence of the indicator signifies
possibility of filter parameter
adjustment.. The filter is switched on
and off by using the filter button
Scale
Contains a amplification
factor value ×1/2/4/8.
- indicator of buttons used▲/▼
Sound
- «natural» sound in the
headphones (volume level 1to 8
can be adjusted by
◄/►buttons)
--«synthesized» sound to
headphones (volume level 1 to 8 can
be adjusted by ◄/►buttons)
- «synthesized» sound in built-
in speaker (volume level of the built-
in speaker can not be adjusted).
Narrow scale
Displays the level of input signal
A filled upscale signifies input
overload. Overload can be
eliminated and the optimal level of
input signal can be set by using the
/
Figure
Displays the level of processed
signal
- in the mode - valid signal
level value
- in the mode - current
signal level value
- in the modes and -
maximum current signal level value
for the previous second (pulse
amplitude)

12
4. Graph window
The graph displays the changes in processed signal levels over time and moves at constant
speed from right to left.
The graph
shows processed signal
- in mode - change in the level of processed valid signal over time
- in modes , and - change in the level of current signal value over time
Narrow scale
Displays the level of input signal.
A filled upscale signifies input overload.
Overload can be eliminated and he
optimal level of input signal can be set
by using the /
Figure
Displays the level of processed signal
- in the mode valid value of the signal
- in the mode - current value of the signal
- in the mode and maximum current value of the signal for the previous second (pulse amplitude)
5. Acoustic signal spectrum window
It displays the spectrum of the filtered signal.
When working with EMD switching the window can have the following view :
Fig. А.4
Fig. А.5
dark segments
correspond to the frequency
components of valid
(«continuous») signal
light segments
correspond to frequency
components of accidental
interference
Band pass of the filter on the figure - 0,21…0,95kHz. It is possible to switch over
to adjusting the image scale at vertical by means of ▲/▼ and volume in headphones
by◄/►. it is possible to switch over to adjusting the pass band and vise versa by means of
(→◄/►→ ).
The frequencies at which light segments significantly predominate over dark probably are the
interference frequencies to be suppressed by the band pass filter.

13
6. Power range spectrum window
The window is available in the electromagnetic mode
of broadband and can be called for by the additional
touch of a button . The display shows the industrial
frequency spectrum of «10 ... 640 Hz». Maximum of
emission spectrum of the power cable falls to 50/60 Hz.
Two-segment columns show the current and minimum
values of the frequency components of the signal.
Typically, the spectrum contains harmonic components
which are dependent on the form of voltage and current
in the load. There can be often present strong odd harmonic components at frequencies of
150/180, 250/300 (Hz), etc.
7. Broadband electromagnetic spectrum window
The window is available in the electromagnetic mode
of broadband and can be called for by pressing the
button . The display shows the industrial frequency
spectrum of «0.40…8.60 kHz».
Two-segment columns display the current and
minimum values of the frequency components of the
signal.
8. Memory window
Fig. А.6
Fig. А.7
value of the valid signal level
Number of memory
cells. Selection of
memory cells is
performed by ◄/►
buttons
levels of useful signal, fixed by memory buttons
pressings
The receiver has an ability to record/view
30 saved signal levels (fig.А.8). Output
signal level values are recorded every time
the memory button pos. 6.fig.2.1 is
pressed in the measurement mode.
The memory of the receiver provides 30
cells for filling, any subsequent record is
the last one.
The review mode is called up by the
memory button .
Fig. А.8
In order to do that: turn off measurement mode by pressing , the start/pause button ,
review memorized fields using ◄/► buttons.
Leaving Memory window for the previous measurement mode occurs by sequentially pressing
memory button and measurement buttons.
When the receiver is powered off, the recorded data is not saved.

14
9. Audio indication
The sound is output to the headphones or the built-in sound transmitter. Three categories of
sound are used:
- «Natural» without filtering (broadband) to the phones;
- «Natural» filtered (narrowband) to the phones;
- «Synthetic» (modulation of sound frequency by the level of the filtered signal) to the phones
or to the built-in transmitter.
When working with AD only «natural» sound is used.
When working with EMD in the mode «natural sound to the phones» the adopted «high active»
frequency 8192Hz and 33kHz, before playing, are converted into a well-acceptable «low»
frequencies of 1575 Hz and 3470 Hz respectively.
«Synthesized» sound is created by a principle: «Frequency of the audible sound signal (pitch)
is directly proportional to the signal level,» and the volume does not depend on the level of the
received signal. «Synthesized» sound is played while values «figure≥2».
The volume of the headphones is set by the operator using buttons ◄/►. Two pressings
correspond to the one change of figure on the display «8 ... 1/1…8».
Volume of the «synthesized» sound on the built-in transmitter can not be regulated.
Table of contents
Other TECHNO-AC Security Sensor manuals

TECHNO-AC
TECHNO-AC Success CBI-116N User manual

TECHNO-AC
TECHNO-AC SUCCESS TPT-522N Manual

TECHNO-AC
TECHNO-AC SUCCESS ATP-434N User manual

TECHNO-AC
TECHNO-AC Success AT-407N Parts list manual
TECHNO-AC
TECHNO-AC Success AG-309.15 N User manual

TECHNO-AC
TECHNO-AC Success AT-107N Manual

TECHNO-AC
TECHNO-AC SUCCESS-438.15N Manual