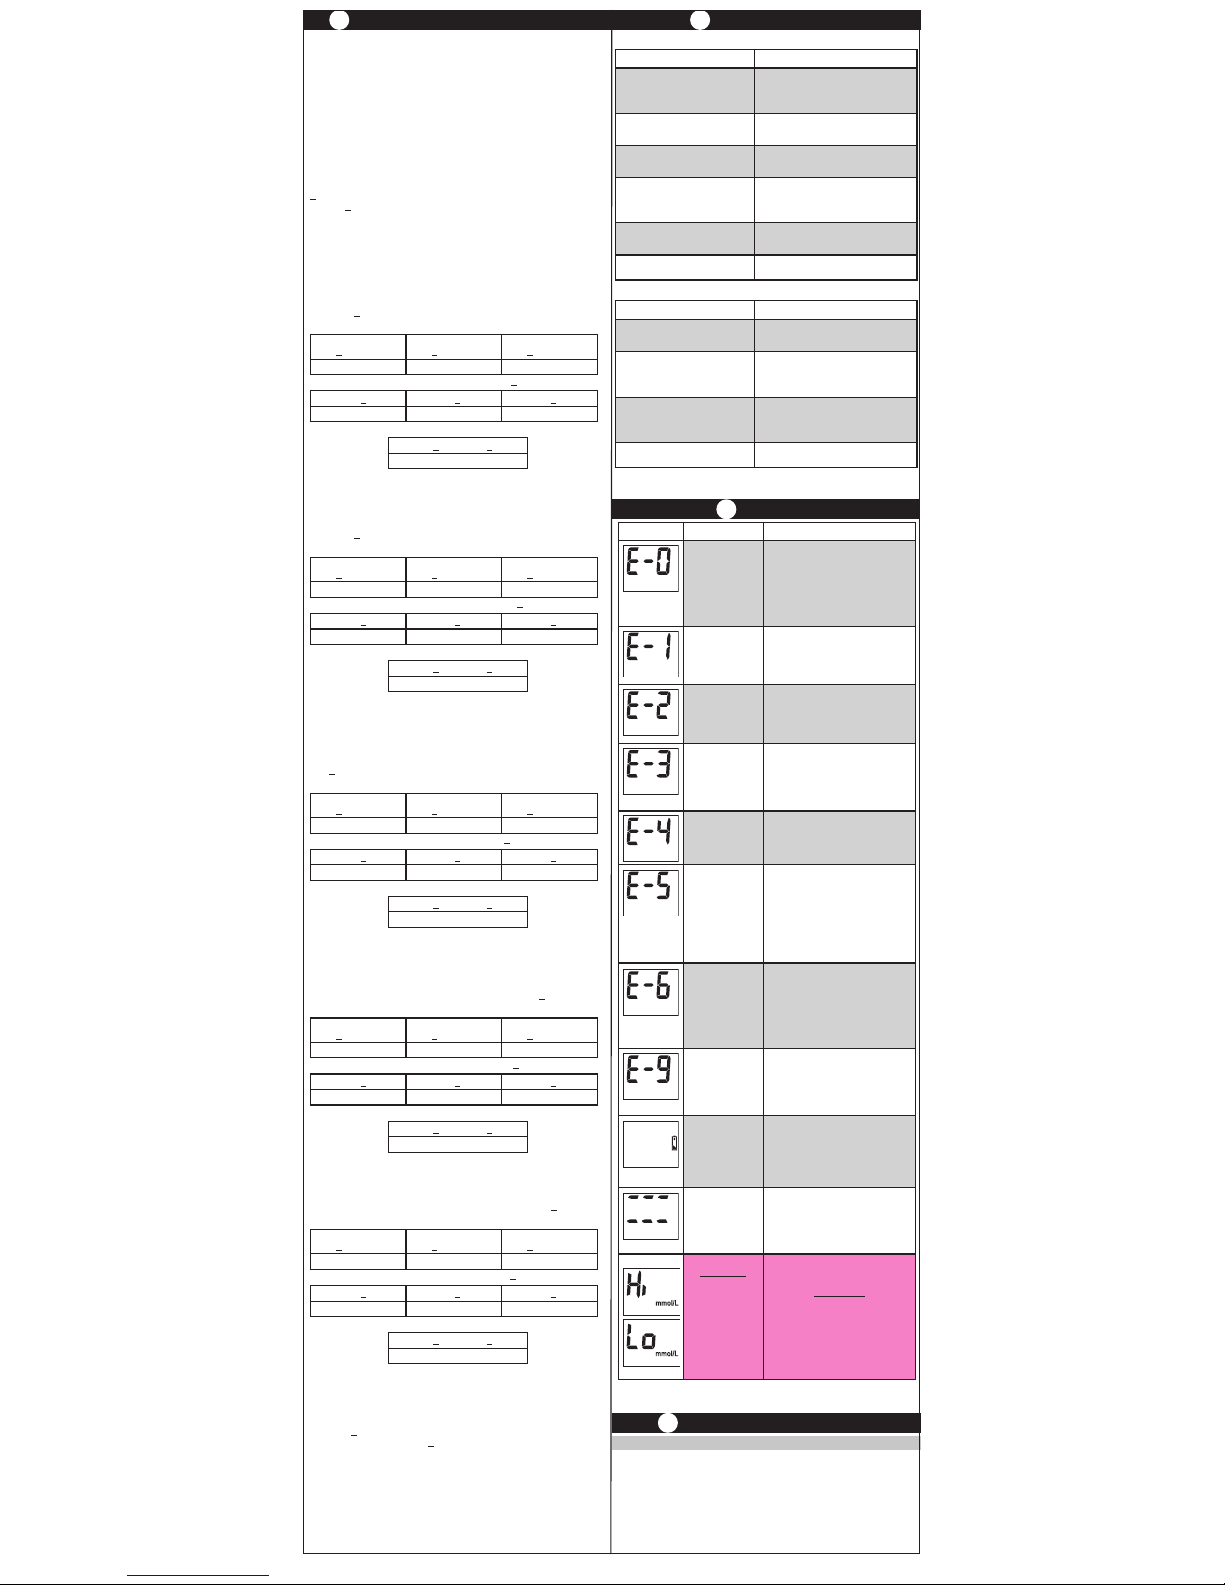
If error message still appears, any other error message appears, or
troubleshooting does not solve the problem, contact for assistance.
Display Reason Action
Invalid
Hematocrit
Repeat with new test strip, using
capillary whole blood from the finger
or forearm or venous whole blood
collected only in a sodium heparin
blood collection tube.
If error persists, contact for assistance.
Temperature
Error
•
Too Cold/ Too Hot
Move meter and test strips to area
between 5°C-40°C;
wait 10 minutes for system to reach
room temperature before testing.
Sample Not
Detected or
Sample Drop on
Top of Test Strip
Retest with new test strip and
larger sample.
Make sure SampleTip of test strip
touched top of sample drop.
Used Test Strip,
Test Strip Outside
of Vial Too Long
Repeat with new test strip.
If error persists,
contact for assistance.
Meter Error Contact for assistance.
Test Strip Error or
Very High Blood
Glucose Result
(higher than
33.3 mmol/L)
Retest with new test strip. If error
persists, contact for assistance.
If you have symptoms such as
fatigue, excess urination, thirst or
blurry vision, follow a Doctor or
Healthcare Professional’s advice for
high blood glucose.
Test Strip
Removed During
Test or Micro USB
Cable
Connected while
Testing
Unplug Micro USB cable. Repeat
with new test strip. Make sure
result is displayed
before removing test strip. If error
persists, contact for assistance.
Meter Error Contact for assistance.
Low or Dead
Battery
Low: About 50 tests can be done
before battery dies.
Dead: Battery Symbol appears
before meter turns off.
Change the battery.
Broken Display Do not use meter for testing.
Contact for assistance.
WARNING!!
Out of Range -
High Results
> 33.3 mmol/L
Out of Range -
Low Results
< 1.1 mmol/L
WARNING!!
Retest with new test strip. If result
is still“Hi”(High) or“Lo”(Low)
contact a Doctor or Healthcare
Professional immediately.
11 MESSAGES
9PERFORMANCE CHARACTERISTICS5
Reason Action
Test strip inserted upside down
or backwards
Remove test strip from meter. Re-
insert test strip correctly into the
meter.
Test strip not fully inserted Remove test strip from meter. Re-in-
sert test strip correctly into the meter.
Test strip error Remove test strip from meter. Repeat
with new test strip.
Meter is dead or there is not a
battery in the meter
Remove test strip from meter.
Replace battery in meter. Use new
test strip for testing.
Battery in the meter backwards Battery must be placed in meter with
positive (“+”) side facing up.
Meter error Contact for assistance.
1. After inserting test strip, meter does not turn on.
Reason Action
Sample drop too small Repeat test with new test strip and
larger sample drop.
Sample applied after two
minute shut-off
Repeat test with new test strip. Apply
sample within 2 minutes of inserting
test strip into meter.
Problem with test strip Repeat with new test strip. If testing
still has not begun, contact for
assistance.
Problem with meter Contact for assistance.
10 TROUBLESHOOTING
2. After applying sample, meter does not begin testing.
PRECISION: Precision describes the variation between results. There are two types of precision
results measured - repeatability (using blood) and intermediate precision (using control solution).
Repeatability: N=100
Mean (mmol/L) 1.3 2.1 4.1 7.7 11.4 16.4 27.6
SD (mmol/L) 0.05 0.08 0.13 0.25 0.38 0.53 0.75
%CV 4.2 3.8 3.2 3.3 3.3 3.2 2.7
Intermediate Precision: N=100
Mean (mmol/L) 2.1 6.4 17.7
SD (mmol/L) 0.1 0.2 0.6
%CV 4.2 3.4 3.3
SYSTEM ACCURACY: Diabetes experts have suggested that glucose meters should agree within
+0.83 mmol/L of the medical laboratory values at glucose concentrations below 5.55 mmol/L
and within +15% of the medical laboratory values at glucose concentrations at or above
5.55 mmol/L.6The tables below show how often healthcare professionals (HCP) and users
achieve these goals using capillary fingertip, capillary forearm, and venous blood samples when
glucose results are not fluctuating. The laboratory reference instrument is the Yellow Springs
Instrument (YSI).
FOR HEALTHCARE PROFESSIONALS
99.5% of TRUE METRIX GO fingertip values performed by healthcare professionals (HCP) fell
within ±0.83 mmol/L of the YSI results at glucose levels <5.55 mmol/L and within ±15% at
glucose levels >5.55 mmol/L.
Fingertip Capillary Samples (HCP vs. YSI) for glucose concentrations <5.55 mmol/L
Within
+0.28 mmol/L
Within
+0.56 mmol/L
Within
+0.83 mmol/L
94 / 156 (60.3%) 146 / 156 (93.6%) 155 / 156 (99.4%)
Fingertip Samples (HCP vs. YSI) for glucose concentrations >5.55 mmol/L
Within + 5% Within + 10% Within + 15%
227 / 444 (51.1%) 383 / 444 (86.3%) 442 / 444 (99.5%)
Fingertip Samples for glucose concentrations between 1.1-33.3 mmol/L
Within +0.83 mmol/L or +15%
597/600 (99.5%)
Parkes Error Grid: 100% of individual fingertip glucose measured values performed by
healthcare professionals fell within Zone A of the Parkes Error Grid (PEG).
98.2% of TRUE METRIX GO forearm values performed by healthcare professionals (HCP) fell
within ±0.83 mmol/L of the YSI results at glucose levels <5.55 mmol/L and within ±15% at
glucose levels >5.55 mmol/L.
Forearm Capillary Samples (HCP vs. YSI) for glucose concentrations <5.55 mmol/L
Within
+0.28 mmol/L
Within
+0.56 mmol/L
Within
+0.83 mmol/L
28 / 62 (45.2%) 53 / 62 (85.5%) 60 / 62 (96.8%)
Forearm Capillary Samples (HCP vs. YSI) for glucose concentrations >5.55 mmol/L
Within + 5% Within + 10% Within + 15%
74 / 156 (47.4%) 132 / 156 (84.6%) 154 / 156 (98.7%)
Forearm Samples for glucose concentrations between 1.1-33.3 mmol/L
Within +0.83 mmol/L or +15%
214 / 218 (98.2%)
Parkes Error Grid: 99.1% of individual forearm glucose measured values performed by
healthcare professionals fell within Zone A and 0.9% in Zone B of the Parkes Error Grid (PEG).
Venous Blood
99.1% of TRUE METRIX GO venous values performed by healthcare professionals (HCP) fell within
±0.83 mmol/L of the YSI results at glucose levels <5.55 mmol/L and within ±15% at glucose
levels >5.55 mmol/L.
Venous Samples (HCP vs. YSI) for glucose concentrations <5.55 mmol/L
Within
+0.28 mmol/L
Within
+0.56 mmol/L
Within
+0.83 mmol/L
61 / 90 (67.8%) 85 / 90 (94.4%) 90 / 90 (100%)
Venous Samples (HCP vs. YSI) for glucose concentrations >5.55 mmol/L
Within + 5% Within + 10% Within + 15%
66 / 130 (50.8%) 122 / 130 (93.8%) 128 / 130 (98.5%)
Venous Samples for glucose concentrations between 1.1-33.3 mmol/L
Within +0.83 mmol/L or +15%
218/220 (99.1%)
Parkes Error Grid: 100% of individual venous glucose measured values performed by
healthcare professionals fell within Zone A of the Parkes Error Grid (PEG).
FOR CONSUMERS
99% of TRUE METRIX GO fingertip values performed by users fell within ±0.83 mmol/L of the YSI
results at glucose levels <5.55 mmol/L and within ±15% at glucose levels >5.55 mmol/L.
Fingertip Samples (User vs. YSI) for glucose concentrations <5.55 mmol/L
Within
+0.28 mmol/L
Within
+0.56 mmol/L
Within
+0.83 mmol/L
13 / 17 (76.5%) 17 / 17 (100%) 17/17 (100%)
Fingertip Samples (User vs. YSI) for glucose concentrations >5.55 mmol/L
Within + 5% Within + 10% Within + 15%
46 / 83 (55.4%) 73 / 83 (88.0%) 82/83 (98.8%)
Fingertip Samples for glucose concentrations between 1.1-33.3 mmol/L
Within +0.83 mmol/L or +15%
99/100 (99.0%)
Parkes Error Grid: 100% of individual fingertip glucose measured values performed by users
fell within Zone A of the Parkes Error Grid (PEG).
98.2% of TRUE METRIX GO forearm values performed by users fell within ±0.83 mmol/L of the
YSI results at glucose levels <5.55 mmol/L and within ±15% at glucose levels >5.55 mmol/L.
Forearm Samples (User vs. YSI) for glucose concentrations <5.55 mmol/L
Within
+0.28 mmol/L
Within
+0.56 mmol/L
Within
+0.83 mmol/L
13 / 31 (41.9%) 22 / 31 (71.0%) 31/31 (100%)
Forearm Samples (User vs. YSI) for glucose concentrations >5.55 mmol/L
Within + 5% Within + 10% Within + 15%
34 / 78 (43.6%) 64 / 78 (82.1%) 76 / 78 (97.4%)
Forearm Samples for glucose concentrations between 1.1-33.3 mmol/L
Within +0.83 mmol/L or +15%
107/109 (98.2%)
Parkes Error Grid: 100% of individual forearm glucose measured values performed by users fell
within Zone A of the Parkes Error Grid (PEG).
USER PERFORMANCE EVALUATION: A study evaluating glucose values from fingertip
capillary blood samples obtained by 100 lay persons showed the following results:
100% within +0.83 mmol/L of the medical laboratory values at glucose concentrations
below 5.55 mmol/L and 98.8% within +15% of the medical laboratory values at glucose
concentrations at or above 5.55 mmol/L. ELECTROMAGNETIC COMPATIBILITY
This meter meets the electromagnetic immunity requirements as per EN ISO 15197:2015.
It meets the electromagnetic emissions requirements as per EN 61326 series. Interference
from the meter to other electronically driven equipment is not anticipated. The
electromagnetic environment should be evaluated prior to operation of the device.
Do not use the meter in a very dry environment, especially one in which synthetic
materials are present. Do not use the meter close to sources of strong electromagnetic
radiation, as these may interfere with the proper operation.
12 SYSTEM SAFETY INFORMTION
Use contact information at the bottom of the page for assistance.