•Normal mode displays a waveform when the trigger conditions are met, otherwise the oscilloscope
does not trigger and the display is not updated.
•Auto mode is the same as Normal mode, except it forces the oscilloscope to trigger if the trigger
conditions are not met.
Info: While making a selection in menus, it is a must to hold down by the touch-pen in the menu area and
the requested choice could be made by sliding menu area up and down. To exit from the current menu,
press to the menu button again.
Figure 4. Trigger Menu
After the channel source selection, also it might be needed to choose the trigger level, too. Vertical trigger
level (3) must place at somewhere between the signal's maximum and minimum level in order to trigger
the signal properly. To set trigger level, firstly, let it activate by holding down with pen to the point where
vertical (3) and horizontal (2) trigger levels intersect. Right after the activation, trigger level color shows
highlight. Then, the requested level can be adjusted by sweeping the junction point. In case of release the
touching on the screen, the triggering level colors fade and lock onto the point.
If the trigger will be made via external signal, firstly, the trigger should be selected from menu as an
external channel (Table 1). Henceforth, signal generator output (SG-OUT) is used as an external triggering
input. The triggering signal to SG-OUT is applied as square wave. Whereas the voltage between 2V - 5 V,
remains at the level of logic-1; the voltage ratings under 0.8V, remains at the level of logic-0. In this kind of
trigger, the vertical trigger level remains stable in the middle of the screen owing to the fact that there is no
demand on vertical position (3) calibration. The external triggering signal must place between 0V - 5V.
Critical Note: While SG-OUT is used as signal generation, signalization must not be practiced for external
trigger. Otherwise, overlap probability between two signals would be inevitable. Firstly, it is a must to
select EXT channel from the trigger menu and then signal can be applied.
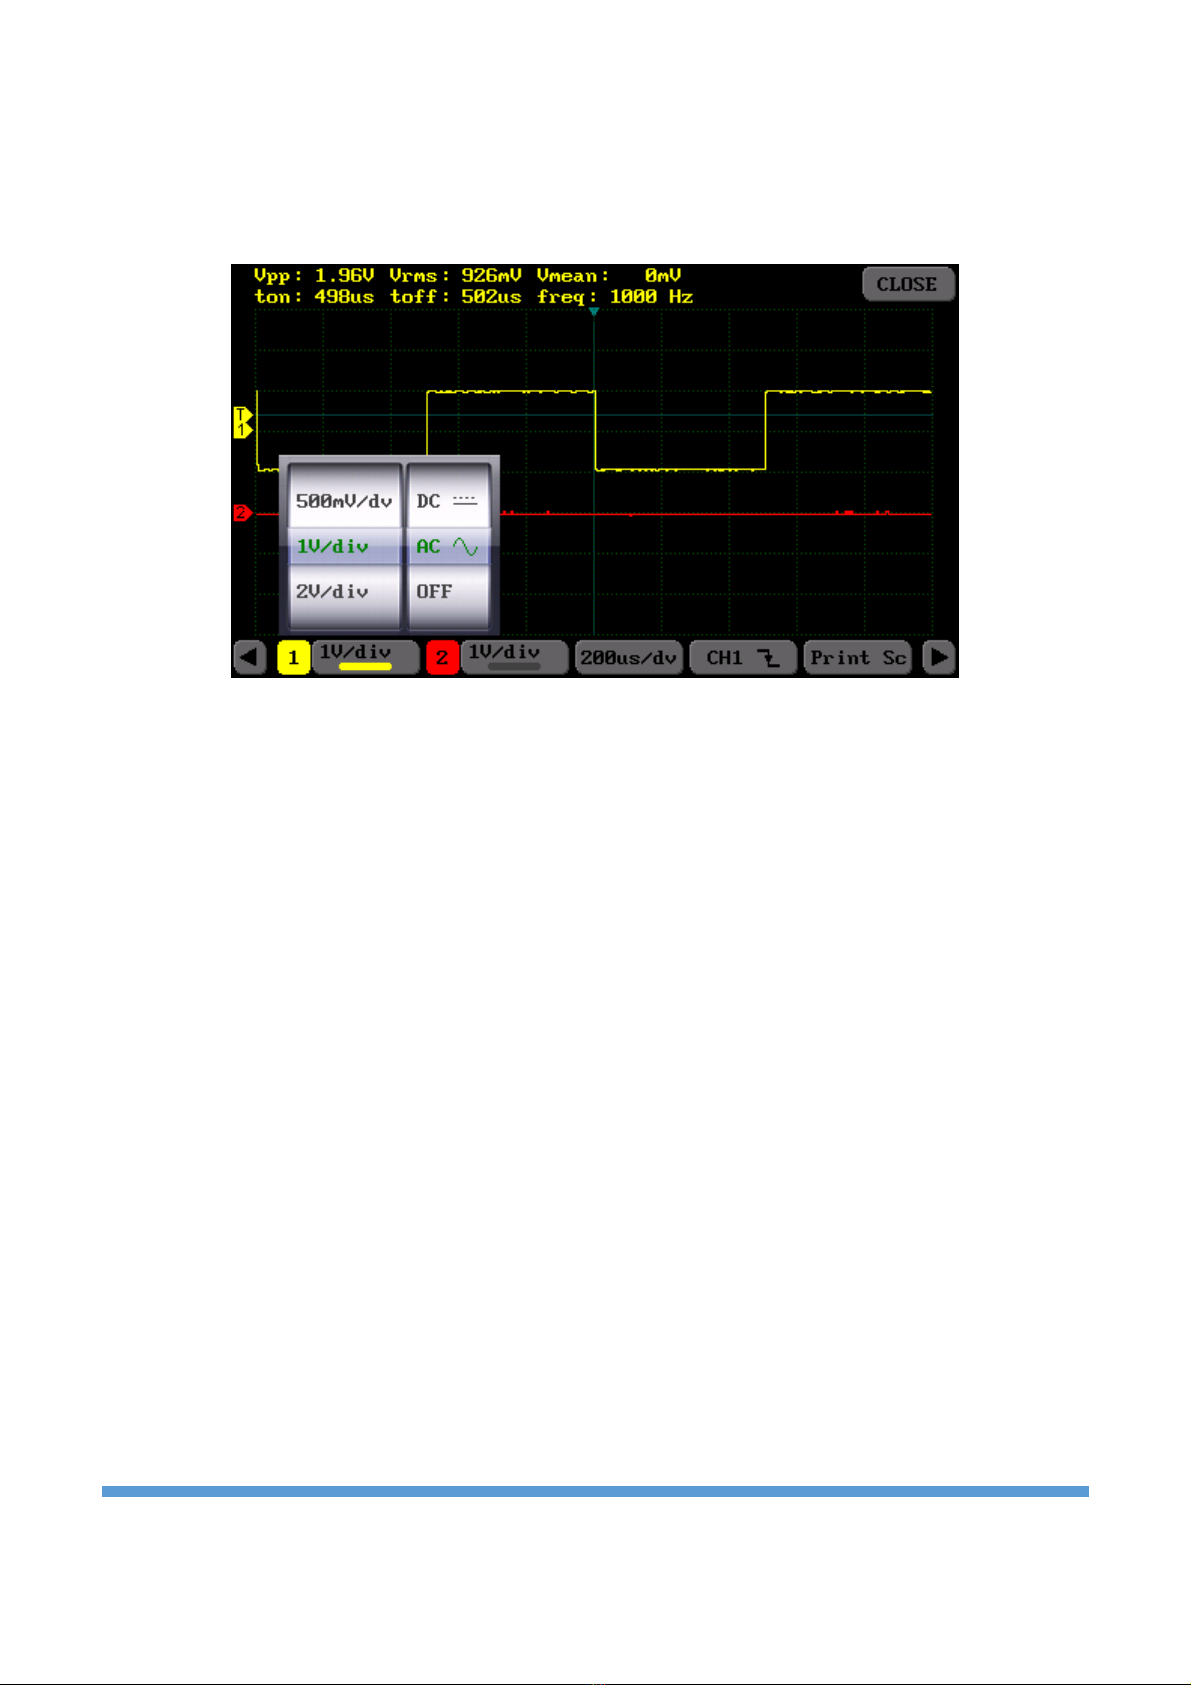
3.3. Channel Setting
On the purpose of observing the signals clearly on the screen, there may be needed to adjust for every
single channel. To adjust the Channel-1, the button numbered (12); to adjust the Channel-2, the button
numbered (15) should be selected (Figure 3a). The Channel-1's setting menu is seen in the Figure 5. It
consists of two parts: In the menu's left side, vertical sensitivity can be arranged a value ranging from