unilab The LED Array User manual

UNILAB
The LED Array
™
Notes for Use 721 UNILAB L75279
v. 06/03
FifeX and UNILAB would like to acknowledge the
support of Jim Jamieson (SSERC) and the Fife
schools, in developing this exciting new product.

Description
The LED Array™ is a robust and attractive
device comprising 1 white LED and a set
of 10 coloured LEDs from red to violet,
wavelengths from 641 to 411 nanometres.
Purpose
It can be used to explore the interaction
between colour filters and specific colours
of light, to illustrate and explain the
behaviour of different wavelengths of light,
and to prove and work out a value for
Planck's constant.
The experimental method for Planck’s
constant involves simple measurements,
but requires appreciation of errors and an
awareness of underlying assumptions.
Kit Contents
LED Array™
Plugtop 5V 1A d.c. power supply
For the suggested experiments, you will
also need:
Colour filters, at least two each of:
red, green, blue, cyan, magenta, yellow
A diffraction grating (300 lines/mm)
Diffraction gratings with different
spacings, e.g. 200 and 600 lines/mm
A metre rule
A sheet of A3 white card and marker pen
A voltmeter to read 0 to 6V d.c.
The LED Array™ LED data
Voltages measured between the common
connection point and the individual LED
contacts, are in the range 1.8 to 4V.
Safety
The LED Array™ should be used under the
supervision of a qualified teacher, and with
the plugtop power supply provided. A risk
assessment prior to use is recommended.
The LEDs in this product are “ultra bright”.
Do not look directly at them from close
range. Do not stare at any bright LED
source.
When working in low ambient light levels,
extra caution must be taken. Advise
pupils not stare, and to look at the LEDs
for the minimum time during experimental
procedures.
FifeX and UNILAB accept no responsibility
for injury or damage caused by misuse of
the LED Array™.
Power supply
It is recommended that you use the 5V d.c.
plugtop power supply provided.
Connect the plug top power supply lead to
the socket on the left side of the LED
Array™.
Plug the power supply into a mains
socket.
Locate the on-off switch above the power
supply socket. Switch on.
on
off
common
on-off
switch
power
supply
socket
common
contact for
voltmeter
positive (+)
contact
points for
each LED
white
LED
LED colour
deep red
red
orange
yellow
green
bright green
turquoise
blue
deep blue
violet
wavelength
nm
641
627
609
600
574
539
494
468
451
411
frequency
1014 Hz
4.68
4.78
4.93
5.00
5.23
5.57
6.07
6.41
6.65
7.30
Suggested experiments
1. Colour, and the effects of colour filters
2. Effect of a diffraction grating, and the
link to colour and wavelength.
3. Prediction from initial observations, of
the effect of using a different grating.
4. Calculation of wavelength for any
colour
5. How LEDs generate light
6. Determination of Planck’s constant, h
6b. Alternative method - measuring the
striking voltages for the LED Array
7. Assumptions underlying the
measurement of Planck's constant

1. Colour, and the effects of colour filters
Observe the colours of the LEDs, the
sequence corresponds to a rainbow or
spectrum produced by a prism.
Work in a dark corner, look at the LED
array through a variety of colour filters.
When a red filter is used, the red LEDs
appear brighter than the rest. The red
filter allows red light to pass and blocks
other colours.
When a green filter is used, the green
LEDs appear brighter than the rest. Green
light passes through, and other colours
are blocked.
You can see more than one colour of LED,
through any particular filter.
Filter materials allow a small range of
colours to pass, so the green filter might
allow green, plus some blue and yellow
light to pass.
If you have two filters of the same colour,
use them to make a “double filter” and
look at the LED array again. You should
find that the blocking of other colours is
more effective.
No matter which filter you use, the white
LED looks the colour of the filter. This is
because the white LED (like any source of
white light) contains all colours.
2. Effect of a diffraction grating, and the
link to colour and wavelength
A diffraction grating is a set of very fine,
parallel lines ruled very close together on
a transparent film. There may be 50, 300
or even 600 lines per millimetre. You can
check using a microscope.
Switch on the LED array.
Hold the grating only by its card frame, to
avoid touching the film.
With the grating close to one eye, look at
the LED array. Sketch what you see.
What happens to the light from the white
(top) LED? If you are not sure, ask
someone to cover and uncover the white
LED as you look through the grating.
How does the grating affect red light,
compared with violet light?
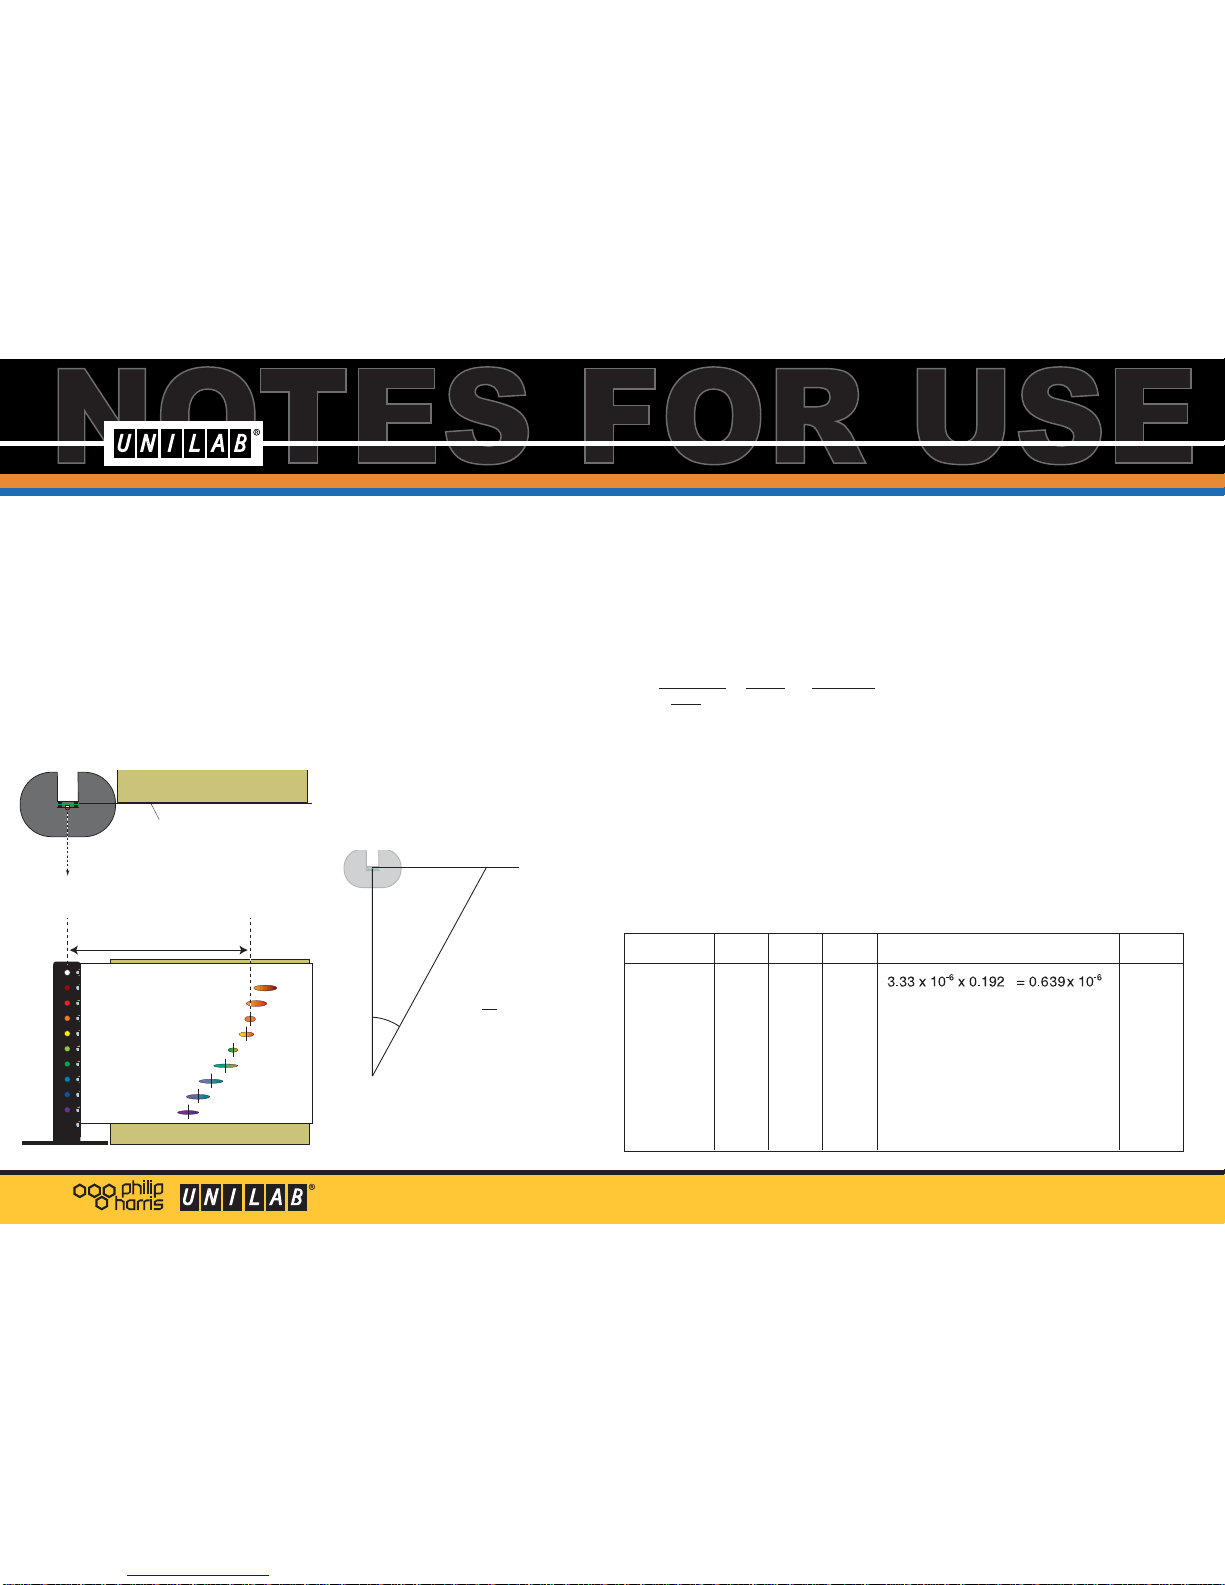
You should see the original LEDs, in a
vertical line, with images of the LEDs to
the left and right of the central line.
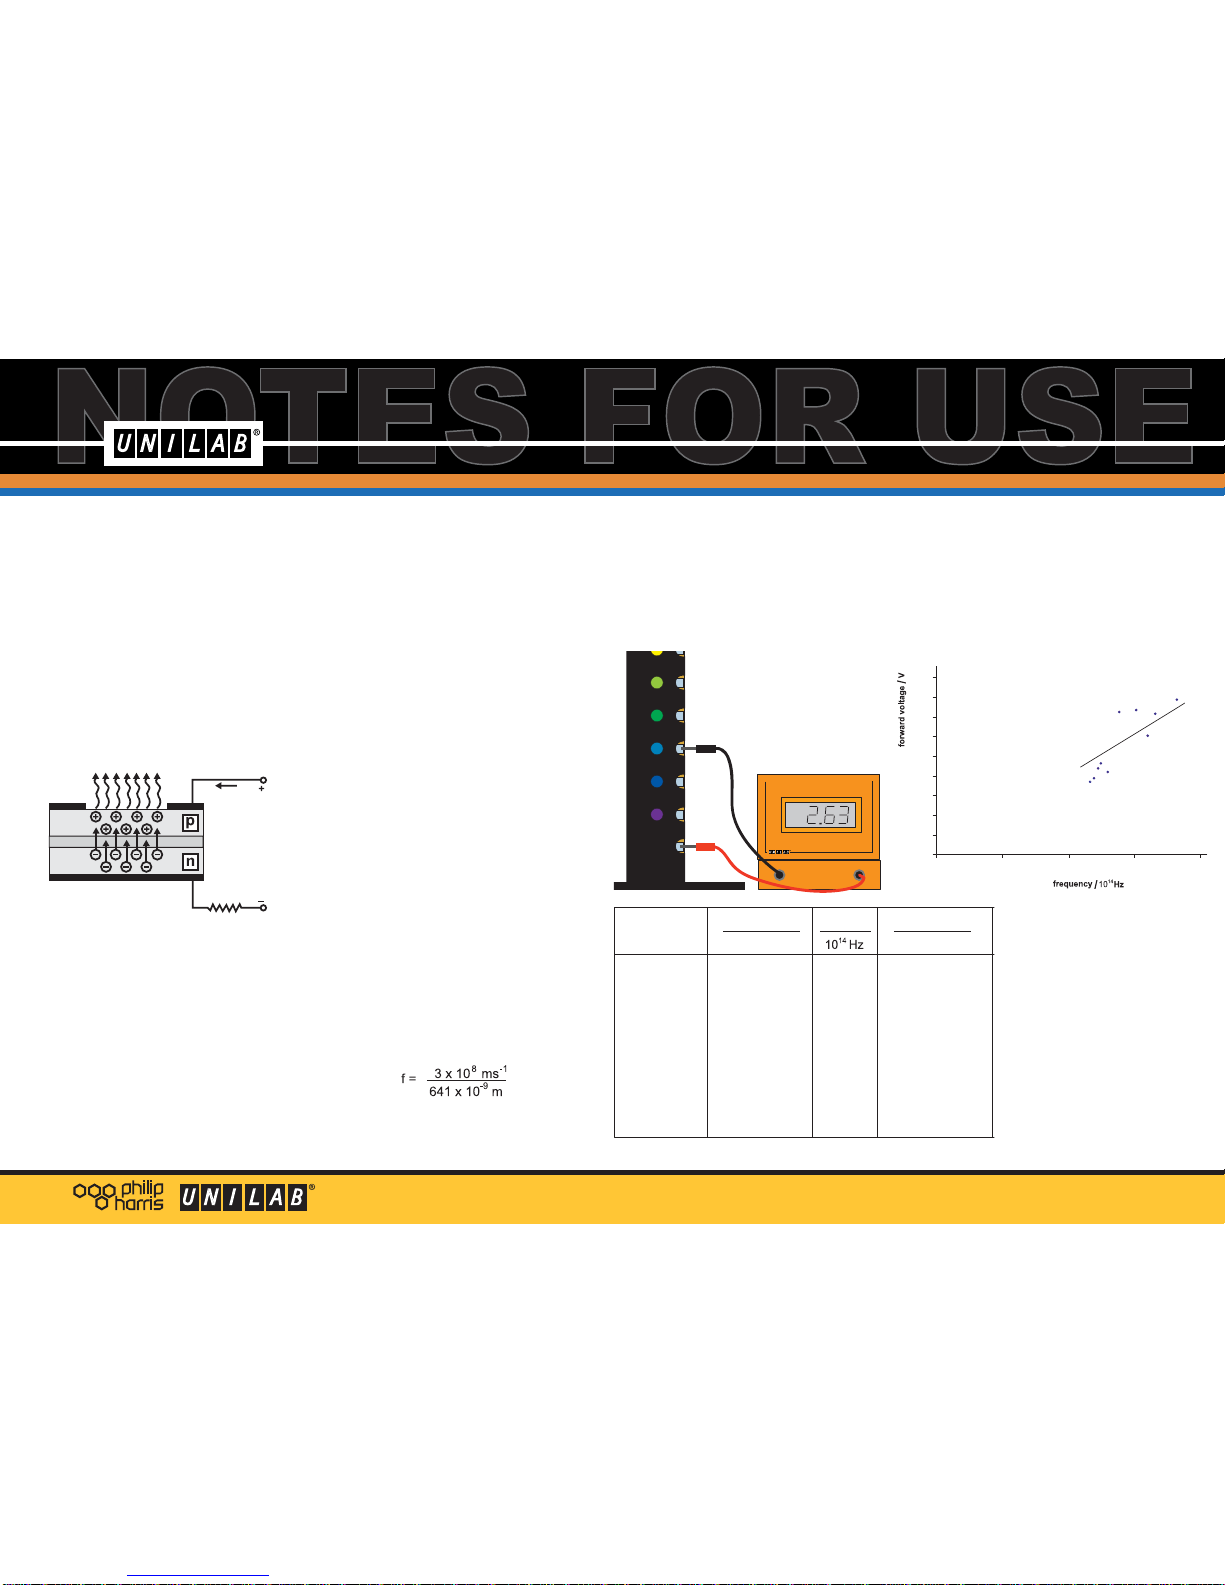
The white LED gives a spectrum from red
to violet on the left, and violet to red on
the right. Clearly, different colours behave
slightly differently at a diffraction grating.
Colours are separated into a spectrum.
Each LED gives a slightly stretched image,
and not in a single colour! This tells us
that each LED emits a range of colours,
rather than a single colour.
Each LED’s image is also a different
distance from the central line.
Look at the sketch and imagine a number
of single waves, stretching from the
vertical centre line to the image of each
LED. The wave for the red LED is longer
than for the yellow or blue or violet LED.
The lengths of these imaginary waves are
proportional to the actual wavelengths of
the light. What is the approximate
difference between the wavelengths of red
light and violet light?
3. Prediction from initial observations, of
the effect of using a different grating.
You have seen the effect of a diffraction
grating on light of different colours, i.e
light of different wavelengths.
Diffraction is caused by interaction
between light waves and the small gaps
between the lines on the grating.
If we use a grating with more or less lines
per millimetre, how will the image change?
Predict what you expect to see, then test
your prediction using a different grating.
If a ripple tank is available, study the
interaction between plane waves and a
barrier with two gaps in it.
Waves passing through the gaps produce
a diffraction pattern. Here is a typical
pattern, showing first order diffraction (F).
Change the wavelength or the size and
separation of the gaps in the barrier.
Observe changes in the diffraction pattern.
ROYGBI V
%
300 lines/mm
on
off
common
FF

4. Calculation of wavelength for any colour
The images to left and right of the central
vertical line of LEDs are called first order
fringes. If you look again and hold the
grating close to your eye, you should see
a second set of images, fainter and further
out from the vertical centre line. These are
second order fringes.
By making simple measurements, you can
calculate the wavelength of the light
emitted by each LED.
Support a sheet of A3 card or paper,
vertically, to one side of the LED array, this
can be done using blu tac and a box.
Now face the LED array, with the
diffraction grating 1 metre from the array,
and close to your eye. Arranging the
grating in a clamp stand might help you fix
the distance accurately.
The A3 card should be at right angles to
the line from your eye to the array.
As you look through the grating, guide
another student to mark the centre of each
first order image, using a marker pen.
Without disturbing the card, measure the
distance, y, from the centre line of the LED
array to each mark in turn, in metres.
Note the LED colour and the distance, y.
For each LED, calculate tan θθ
in this case x= 1 metre
Use a scientific calculator (or the Windows
Calculator accessory) to find the angle θθ
using the tan-1 or “Inv tan” function.
Then find sin θθand enter it in the table.
In the formula m λλ= d sin θθ
m = 1 for a first order fringe
λλ= the wavelength of light from the LED
d = the spacing of the lines in the grating,
in metres.
For a 300 line/mm grating this is
1 = 1mm = 10-3 metre
300 300 300
1mm = 0.00333 x 10⁻³
d = 3.33 x 10⁻⁶ m
So, for each LED λλ= 3.33 x 10⁻⁶ x sin θθ
A typical result has been entered for the
deep red LED.
Measure yfor the rest of the LEDs,
calculate and enter the wavelength in the
table.
Units
Your wavelength values in the table were
calculated as 0.574 x 10⁻⁶ metre, for
example.
Wavelengths of light are usually quoted in
nanometres (nm), and that value would
become 574 nm.
1 nanometre is 10-9 or 1 thousand
millionth of a metre. Visible light has
wavelengths in the range 400 to 700nm,
for a typical human eye.
Errors
The quoted wavelength for the deep red
LED is 641 nanometres.
The value 639nm is quite close, within
0.5% in fact.
What are the likely sources of error in
wavelength values measured in this way?
How can you change the method to give
even more accurate values?
on
off
common
y
w
w
w
.
f
i
f
e
x.co.u
k
A3 card
to diffraction
grating and
observer
box
w
w
w
.
f
i
f
e
x.co.u
k
x
y
θtan θ= x
y
LED colour
deep red
red
orange
yellow
green
bright green
turquoise
blue
deep blue
violet
sin θ
0.192
wavelength λ = d sin θ
tan θ
0.196 m
λ (nm)
639
(metres)
y(m)
0.196

5. How LEDs generate light
In the p-region of an LED, there are many
more positive than negative charges.
In the n-region electrons are more
numerous than positive electric charges.
When sufficient voltage is applied across
the LED, electrons gain enough energy to
move across the junction between p and n
regions, into the p-region.
Once in the p-region, the electrons are
immediately attracted to the positive
charge due to Coulomb forces between
the opposite charges and they re-combine.
For each re-combination the electric
potential energy of the electron is released
as a quantum of electromagnetic energy.
This release takes the form of a photon of
light in a very narrow frequency range,
that is a characteristic of the doped
semiconductor material.
If the applied excitation voltage exceeds
the level at which photons are just emitted,
then the excess energy appears mainly as
phonons (quanta of lattice vibrational
energy).
Calculating photon energy
The energy of the light emitted is related
to the electric charge (e) of an electron
and the voltage (V) required to just light
the LED.
In a simplified form,
energy = eV joules
e = 1.6 x 10⁻¹⁹ coulomb
energy is also = hf
h is Planck's constant
f is photon frequency
so eV = hf
and V = hf/e
A graph of V against f has a gradient of h/e
subject to the assumptions in section 7.
6. Determination of Planck’s constant, h
Use a diffraction grating to view the first
order fringes, as in Experiment 4, and
calculate the wavelength for each LED.
Enter the values in a table, see example.
Calculate the frequency for each
wavelength, using the formula,
f = c/λλ
λλis photon wavelength
c = 3 x 10⁸ms-1
e.g. for the deep red LED, the wavelength
is 641nm or 641 x 10-9 metres, so
f = 0.00468 x 10¹⁷s-1
= 4.68 x 10¹⁴ Hz
Use a voltmeter(e.g. Unilab Easy Read wth
20V d.c. attachment) to measure the
forward voltage for each of the LEDs.
Connect the positive lead to the metal
contact marked 'common' and touch the
negative lead on the contact next each
LED in turn.
Complete the table with frequency and
forward voltage values for each LED.
Plot a graph of V against frequency, and
draw a line of best fit.
The gradient of this graph is close to
0.5 x 10⁻¹⁴
So h/e = 0.5 x 10⁻¹⁴
and e = 1.6 x 10⁻¹⁹
Finally, h = 8.0 x 10⁻³⁴
This value is slightly high,
the accepted value being
6.626 x 10⁻³⁴ joule second.
The alternative method of
measuring the voltage
(below) may provide a more
accurate value.
on
off
common
LED colour
Wavelength
nm forward voltage
V
deep red 641 4.68 1.85
red 627
orange 609
yellow 600
green 574
bright green 539
turquoise 494
blue 468
deep blue 451
violet 411
frequency
0 2.0 4.0 6.0 8.0
0
0.5
1.0
1.5
2.0
2.5
3.0
3.5
4.0
4.5

6. Alternative method - measuring the
striking voltages for the LED array
Instead of the plugtop power supply,
connect a 0 to 5V d.c. variable, regulated
power supply to the LED array.
First, increase the voltage slowly from 0 to
5 volts. Observe that each LED “strikes”
in sequence, from red to violet.
Next, with the voltmeter connected to each
contact in turn, check the reading when
each LED just lights. This is the striking
voltage.
Add a column to the table, and record the
striking voltage for each LED. The values
are slightly different from the previous set
of forward voltages, and in sequence.
Plot a graph of striking voltage against
frequency.
Find the gradient and calculate the value
of Planck’s constant, h, as before.
A complete set of results is given below.
7. Assumptions underlying the
measurement of Planck's constant
Apart from errors introduced by the
observers, these methods for determining
Planck’s constant:
- ignore any potential drop across the
semiconductor materials of the LED
- assume that the threshold of photon
release is accurately determined (when
using the variable d.c. supply)
- assume that, at recombination, 100% of
the energy input, eV, is released as
photon energy, hf.
When the fixed power supply is used, you
will notice that there is a large gap in the
forward voltage between the green and the
bright green LEDs. This is due to different
properties of the semiconductor materials
used to make the LEDs above and below
this point.
The plotted values appear to lie in two
groups.
Two best fit lines may be drawn, one using
the top 5 LEDs, the other using the bottom
5 LEDs. These gradients should provide a
better value of Planck's constant.
Online Support
Further information on experiments can be
found at www.fifex.co.uk/flaonline.htm
and you are invited to submit suggestions
for new experiments, to the same site.
Troubleshooting
If one or more LEDs fail:
1.Switch off the LED array immediately.
2.Disconnect the power lead from the
socket in the side of the LED array.
3.Check the output voltage of the d.c.
supply. It should be 5V d.c.
4.Reconnect the power lead to the LED
array and switch it on.
If the LEDs do not all light disconnect the
supply and contact your supplier for
advice.
If the plugtop power supply is lost or
suspected damaged in any way, contact
your supplier immediately.
LED colour
Wavelength
nm forward voltage
VV
striking voltage
deep red 641 4.68 1.85 1.437
red 627 4.78 1.96 1.466
orange 609 4.93 2.2 1.529
yellow 600 5.00 2.35 1.562
green 574 5.23 2.12 1.620
bright green 539 5.57 3.63 2.085
turquoise 494 6.07 3.68 2.115
blue 468 6.41 3.04 2.230
deep blue 451 6.65 3.58 2.300
violet 411 7.30 3.94 2.885
frequency
Note: It is the responsibility of the user
to check that the power supply gives:
- a maximum of 5 volts
- the correct polarity
- regulated d.c.
The correct connector is a miniature
power jack with 5.5mm external and
2.5mm internal diameter.
The centre contact must be positive.
Popular Lighting Equipment manuals by other brands

Omron Microscan
Omron Microscan NERLITE Smart Series quick start guide

Cameo
Cameo HYDRABEAM 400 CLHB400W user manual

Tekky
Tekky MOURNING GORY Installation and operating instructions

BSi
BSi iZettel installation guide

Elation
Elation EVLED1024SMD Video Wall quick start guide

Chauvet
Chauvet Abyss LED 3.0 user manual