AMS TCS3720 User manual

Document Feedback
TCS3720
Content Guide
Demo Kit Manual •PUBLIC
UG001018 •v1-00 • 2021-Aug-17
22 │2
Content Guide
1Introduction ................................... 3
1.1 Kit Content....................................................3
1.2 Ordering Information ....................................3
2Getting Started .............................. 4
3Hardware Description ................... 5
4Software Description .................... 6
4.1 Connect Software to Hardware....................6
4.2 System Menus..............................................7
4.3 System Level Controls ...............................10
4.4 Auto Polling ................................................11
4.5 Device ID Information.................................11
4.6 Log Status and Control Information............12
4.7 “Configuration” Tab.....................................13
4.8 “ALS” Tab ...................................................16
4.9 “Prox” Tab...................................................18
5Resources ....................................20
6Revision Information...................21
7Legal Information.........................22

Document Feedback
TCS3720
Introduction
Demo Kit Manual •PUBLIC
UG001018 •v1-00 • 2021-Aug-17
22 │3
1 Introduction
The TCS3720 features ambient light, color (RGB) sensing and proximity detection. The device
integrates two advanced emitter drivers within a compact 3.34 mm × 1.36 mm × 0.6 mm OLGA
package.
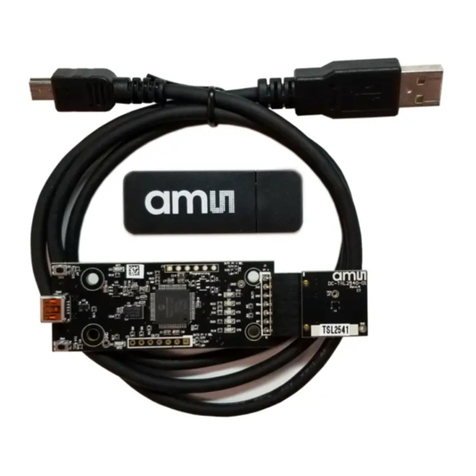
1.1 Kit Content
Figure 1:
Evaluation Kit Contents
No.
Item
Description
1
TCS3720 Daughter Card
PCB with TCS3720 sensor installed
2
EVM Controller Board
Used to communicate USB to I2C
3
USB Cable (A to Micro-B)
Connects EVM controller to PC
4
Flash Drive
Include application installer and documents
1.2 Ordering Information
Ordering Code
Description
TCS3720 EVM
ALS/Color and Proximity Sensor for Behind
OLED Applications
1
2
3
4

Document Feedback
TCS3720
Getting Started
Demo Kit Manual •PUBLIC
UG001018 •v1-00 • 2021-Aug-17
22 │4
2 Getting Started
The software should be installed prior to connecting any hardware to the computer. Follow the
instructions found in the Quick Start Guide (QSG). This loads the required driver for the USB interface
and the device’s graphical user interface (GUI).
The balance of this document identifies and describes the controls available on the GUI. In
combination with the TCS3720 datasheet, the QSG and application notes available on the
ams OSRAM website, www.ams-osram.com, there should be enough information to allow evaluation
of the TCS3720 device.

Document Feedback
TCS3720
Hardware Description
Demo Kit Manual •PUBLIC
UG001018 •v1-00 • 2021-Aug-17
22 │5
3 Hardware Description
The hardware consists of the EVM Controller, the TCS3720 EVM daughter card, and a USB interface
cable. The EVM controller board provides power and I2C communication to the daughter card through
a seven-pin connector. When the EVM controller is connected to the PC through USB, a green LED
lights to indicate the system is receiving power. The LED will be turned off when the GUI program is
started.
For schematics, layout and BOM information please see the documents located in the TCS3720 EVM
folder (All Programs →ams-OSRAM →TCS3720 EVM →Documents).
Figure 2:
Evaluation Kit Hardware

Document Feedback
TCS3720
Software Description
Demo Kit Manual •PUBLIC
UG001018 •v1-00 • 2021-Aug-17
22 │6
4 Software Description
The main window (Figure 3) contains the system menus, system level controls, device information and
logging status. The box on the left side of the window controls various system-wide parameters and
functions. The Configuration tab contains controls to setup both ALS and Proximity detection
parameters. Configuration changes are disabled when the device is running (Power On box checked).
The ALS tab displays ALS data and contains a plot area in which raw ALS data is drawn. The Prox tab
displays proximity data and contains a plot area in which the proximity data is drawn. The application
polls the raw proximity data periodically and reads the ALS data from the device FIFO.
Figure 3:
GUI Main Window
4.1 Connect Software to Hardware
On startup, the software automatically connects to the hardware. On successful initialization, the
software displays a main window, containing controls pertinent to the connected device. If the software
detects an error, an error window appears. If “Device not found or is unsupported” appears, verify the
correct daughterboard is properly connected to the EVM controller board. If “Cannot connect to EVM
board” appears, verify the USB cable is connected. When the EVM controller board is connected to

Document Feedback
TCS3720
Software Description
Demo Kit Manual •PUBLIC
UG001018 •v1-00 • 2021-Aug-17
22 │7
the USB, a green LED lights to indicate the USB cable is connected and providing power to the
system. The LED will remain lit until the any software application opens the controller. The light will
then be switched off so that it will not interfere with any light measurements.
If the EVM board disconnects from the USB bus while the program is running, it displays an error
message and then terminates. Reconnect the EVM board and restart the program.
4.2 System Menus
At the top of the window there are pull-down menus labeled File, Prox Log, ALS Log, and Help. The
File menu provides basic application-level control. The Log menus control the logging of ALS and
Prox data, and the Help menu provides version and copyright information for the application.
4.2.1 File Menu
The File menu contains the following functions:
Figure 4:
File Menu
The Reread Registers function forces the program to re-read all of the control registers from the
device and display them on the screen. This does not read the output data, because the program
reads those registers continually while it is running.
Click on the Exit command to close the main window and terminate the application. Any unsaved log
data is cleared from memory. The application can also be closed by clicking the red “X” in the upper
right hand corner.

Document Feedback
TCS3720
Software Description
Demo Kit Manual •PUBLIC
UG001018 •v1-00 • 2021-Aug-17
22 │8
4.2.2 Prox Log Menu
The Prox Log menu controls the logging of Proximity data and saves the log data to a file. Log data
accumulates in memory until discarded or written to a data file.
Figure 5:
Prox Log Menu
Click Start Logging Prox to start the logging function. Each time the program polls the output
information from the device, it creates a new log entry showing the raw data values, the values of
various control registers, and the values entered by the user into the text fields near the bottom right
corner of the window.
Click Stop Logging Prox to stop the logging function. Once logging stops, the user may store the
data in a file, or continue collecting additional data by clicking Start Logging again.
The Log a Single Prox Entry command causes logging to start, collect one single entry, and
immediately stop again. This function is not available when logging is already running.
Click Clear Prox Log to discard any previously collected data. If there is data in memory, which has
not been saved to disk, this function displays a prompt asking to verify it is OK to discard the data. If
the log is active when this function executes, the log continues running after the existing data is
discarded.
Click Save Prox Log to save the collected log data to a csv file. This stops the logging function, if it is
active, and displays a file dialog box to specify where to store the logged data. The Log Status and
Control Information section below describes the default file name, but you may change the file name if
desired.
4.2.3 ALS Log Menu
The ALS Log menu controls the logging of ALS data and saves the log data to a file. Log data
accumulates in memory until discarded or written to a data file.
Note: ALS data logging is available only when the ASP1/ASP2 feature is disabled (ASP1 is set to 0).
Document Feedback
TCS3720
Software Description
Demo Kit Manual •PUBLIC
UG001018 •v1-00 • 2021-Aug-17
22 │9
Figure 6:
ALS Log Menu
Click Start Logging ALS to start the logging function. Each time the program receives a new set of
ALS data from the device, it creates a new log entry showing the raw data values, the values of
various control registers, and the values entered by the user into the text fields near the bottom right
corner of the window.
Click Stop Logging ALS to stop the logging function. Once logging stops, the user may store the data
in a file, or continue collecting additional data by clicking Start Logging again.
The Log a Single ALS Entry command causes logging to start, collect one single entry, and
immediately stop again. This function is not available when logging is already running.
Click Clear ALS Log to discard any previously collected data. If there is data in memory, which has
not been saved to disk, this function displays a prompt asking to verify it is OK to discard the data. If
the log is active when this function executes, the log continues running after the existing data is
discarded.
Click Save ALS Log to save the collected log data to a csv file. This stops the logging function, if it is
active, and displays a file dialog box to specify where to store the logged data. The Log Status and
Control Information section below describes the default file name, but you may change the file name if
desired.
4.2.4 Help Menu
The Help menu contains a single function: About.
Figure 7:
Help Menu

Document Feedback
TCS3720
Software Description
Demo Kit Manual •PUBLIC
UG001018 •v1-00 • 2021-Aug-17
22 │10
The About function displays a dialog box (Figure 8) showing version and copyright information for the
application and library. Click the OK button to close this window and continue.
Figure 8:
About Window
4.3 System Level Controls
Immediately below the top menu bar there are checkboxes used to control the system level functions
of the TCS3720 device.
The Power On checkbox controls the PON function of the TCS3720. When this box is checked, the
oscillator is on and the device is running measurements according the settings in the System Level
Controls and the Configuration tab. When the device is running, the Configuration tab and System
Controls are disabled to prevent changing the settings while the measurement is ongoing. When this
box is unchecked, the oscillator is off and the device does not operate. The Configuration tab and
System Controls are then enabled and you can change the controls to setup the parameters for next
run.
The Enable box contains checkboxes to enable the ALS, Prox, and Temperature functions. Check a
box to enable the function and uncheck it to disable the function. Note that, even though it may be
enabled independently, the Temperature function does not operate unless the Prox function is also
enabled. If Temperature is enabled but Prox is not, a red error indicator will be displayed beside the
Temperature checkbox.
The Operating Mode pulldown is used to control the operation of the ALS and Prox functions when
both are enabled. In Sequential Mode, ALS and Prox functions are performed serially, one after the
other, with no overlap. During Concurrent and Parallel Operation, Prox operations may occur during

Document Feedback
TCS3720
Software Description
Demo Kit Manual •PUBLIC
UG001018 •v1-00 • 2021-Aug-17
22 │11
ALS operations. In Concurrent Mode, the ALS integration will be paused any time a Prox operation is
flashing the VCSEL light source. In Parallel Mode, ALS integration will not pause when the VCSEL
light source flashes.
The Channel Configuration pulldown is used to control how the photodiodes are connected to the
ADC channels of the device, and how the device data is collected as a result. In 2-Channel Mode, the
Clear and Green photodiodes are connected to channel 0 and the Red and Blue photodiodes are
connected to channel 1. In Color mode, the Clear, Red, Green, and Blue are connected to channels 0-
3 respectively. The device will produce one ALS value for each active channel during each ALS
integration cycle (See ATIME, ASP1, and ASP2 programming below).
The Internal VSYNC checkbox enables the VSYNC signal to be generated internally when an
external VSYNC signal is not received at the expected time.
Setting the ALS VSYNC checkbox allows ALS processing to be synchronized with the VSYNC signal.
Setting the Prox VSYNC checkbox allows Prox processing to be synchronized with the VSYNC signal.
Clicking on the Soft Reset or Hard Reset buttons will perform the soft or hard reset operations as
described in the datasheet.
4.4 Auto Polling
The application automatically polls the TCS3720 raw Prox data and reads the ALS data from the
FIFO, depending on the Enable bits. The Poll Interval at the right upper corner of the form displays
the actual time between reads of the device. At the bottom center of the screen is a control, Polling
Interval, which specifies the time to wait between each poll of the hardware. This control may be set
from 15 ms to 10000 ms (10 seconds).
4.5 Device ID Information
The lower left corner of the window displays the ID number of the EVM Controller board, identifies the
device being used. It also specifies the part number and I2C address of the device and a unique
identifier which is stored with any logged data so that you may associate it back to this device.

Document Feedback
TCS3720
Software Description
Demo Kit Manual •PUBLIC
UG001018 •v1-00 • 2021-Aug-17
22 │12
4.6 Log Status and Control Information
The lower right corner of the window contains status information and controls for the logging function:
Figure 9:
Logging Status
This section contains text boxes that are stored in the log file data and used to build the file name for
the log file. If the data in these fields are changed, the new values are stored with any new data
logged. The default file name is based on the value in the right-hand textbox, at the time the log file is
written. If nothing is entered in the boxes they default to a period (“.”).
Sample default file name:
TCS3720_1-2-3_Log_HH_MM_SS.csv
From Application
From User Input
The Count values displayed are counts of the number of samples currently in the ALS and Prox log
buffers.

Document Feedback
TCS3720
Software Description
Demo Kit Manual •PUBLIC
UG001018 •v1-00 • 2021-Aug-17
22 │13
4.7 “Configuration” Tab
The main portion of the screen contains a tab labeled Configuration.
Figure 10:
Configuration Tab
4.7.1 Configuration Controls
The Configuration Tab contains controls that affect operation of the Prox and ALS functions. The
ALS-related tabs are toward the right side of the tab and the Prox-related tabs are on the left.
Prox Controls
The PPULSE control controls the number of pulses that are used for each prox integration. The
actual number of pulses is one more than the value of this control and is displayed to the right of the
control. The valid settings for this control are from 0 –63 which corresponds to 1 –64 pulses.
The PPULSE_LEN control sets the length in microseconds of each prox pulse. The length of the
actual pulse is two more than the value of this control and is displayed to the right of the control. The
valid settings for this control are from 0 –1023, corresponding to 2 µs –1025 µs.
The PGAIN1 and PGAIN2 controls set the value of the Prox Gain stages. The stage 1 gain can be set
to 1x, 2x, 4x, 8x, or 16x. The stage 2 gain can be set to 2.5x, 5x, or 10x. The PGAIN2 control includes
a setting labeled “Unused”. This value should not be selected and will produce indeterminate results.

Document Feedback
TCS3720
Software Description
Demo Kit Manual •PUBLIC
UG001018 •v1-00 • 2021-Aug-17
22 │14
The PLDRIVE box contains a group of controls which set the drive current for the VCSELs.
●Step specifies the step size in milliamps for both of the VCSEL drivers. You may select 0.5 mA,
1.0 mA, 1.5 mA, or 2.0 mA.
●LDR0 and LDR1 controls set the drive currents based on the step size. The selected step size
is multiplied by (LDRx + 1) to determine the resulting current. The current is displayed to the
right of this control. The LDRx controls have a range of 0 –15, providing a current ranging from
0.5 mA to 32 mA based on the setting of the Step control
●Each of the LDRx controls also has an associated Enable checkbox. When this box is
checked, the driver is active and will be used during prox measurements. If the box is not
checked, the driver will be disabled during prox measurements.
The PTIME control sets the rate at which each prox cycle begins when hardware averaging is
enabled. The actual time is (PTIME + 1) × 88 µs, and is displayed to the right of this control. If PTIME
is set to be less than the actual prox time (determined by PPULSE and PPULSE_LEN), the prox time
will override this value. The PTIME control can be adjusted from 0 to 255 which provides times
ranging from 88 µs to 22.528 ms.
The PWEN control enables the insertion of a wait time between normal prox integration cycles.
The PWTIME and PWLONG controls determine length of the optional prox wait time. If PWLONG is
unchecked, the prox wait time is defined as (PWTIME + 1) × 2.779 ms. If PWLONG is checked, the
wait time is multiplied by 12. PWTIME can be set from 0 to 255, providing a range from 2.779 ms to
711.424 ms. If PWLONG is enabled, this time extends from 33.348 ms to 8.537 sec.
The Binsrch Target control selects the target PDATA value that the calibration function will attempt to
reach when calibrating the prox response.
The POFFSET control sets the offset value which is used to the PDATA value to remove the effects of
electrical and system crosstalk. POFFSET is set by the device, during the calibration function, or may
be manually set to any value within a range of ±255.
Clicking on the Cal button will cause the device to perform a calibration. The device will use a binary
search method to adjust the POFFSET value so that it produces a PDATA result that is as close as
possible to the selected Binsrch Target value.
Checking the Auto Offset Adjust checkbox, will cause the device to examine every PDATA value
generated. If a PDATA value of 0 is detected, the current POFFSET value will be reduced by 1.
When Auto Offset Adjust is selected, the POFFSET control will be disabled and will be read from the
device and displayed each time it polls for the normal Prox data results.
The Auto Pulse Control (APC) function can be turned off by checking the Disable checkbox. The
APC function should normally be disabled in high crosstalk configurations.
The Prox Delay control is used along with the Prox VSYNC control to set a time delay between the
VSYNC signal and the beginning of the Prox cycle. The delay time is Prox Delay × 1.357 µs. The
value can be set from 0 to 65535 meaning the delay can be up to 88.931 ms.

Document Feedback
TCS3720
Software Description
Demo Kit Manual •PUBLIC
UG001018 •v1-00 • 2021-Aug-17
22 │15
The HW Average control causes the device to average multiple prox integrations for each PDATA
output. Using this pull-down menu, you can select to average 2, 4, 8, or 16 values, or disable the
hardware averaging function. If enabled, the hardware will use the PTIME value to control how fast
the selected number of cycles is collected and will then set PDATA to the average of the collected
data.
ALS Controls
The ALS GAIN box contains the controls to set the gain for each of the ALS channels.
AGAIN 0, AGAIN 1, AGAIN 2, and AGAIN 3 set the gain values for each of the ALS channels. The
gain may be set to any power of two from 1x through 4096x.
The ATIME control sets the mail ALS integration time. The actual ALS integration time is
(ATIME + 1) × 2.779 ms. If ASP1/ASP2 sampling is not active, each active ALS channel will produce
one ALS value per ALS cycle. If ASP1/ASP2 is active, each active channel will produce a value for
every alternating ASP1 and ASP2 time within the ATIME time period.
The AWEN control enables the insertion of a wait time between normal ALS integration cycles.
The AWTIME and AWLONG controls determine length of the optional ALS wait time. If AWLONG is
unchecked, the ALS wait time is defined as (AWTIME + 1) × 2.779 ms. If AWLONG is checked, the
wait time is multiplied by 12. AWTIME can be set from 0 to 255, providing a range from 2.779 ms to
711.424 ms. If AWLONG is enabled, this time extends from 33.348 ms to 8.537 sec.
The ASD (ALS Sampling Delay) control is used along with the ALS VSYNC control to set a time delay
between the VSYNC signal and the beginning of the ALS cycle. The delay time is ASD × 1.357 µs.
The value can be set from 0 to 65535 meaning the delay can be up to 88.931 ms.
The ASP1 and ASP2 settings allow the programmed ATIME period to be broken into multiple
alternating ASP1 and ASP2 time periods. If ASP1 is set to 0, ASP2 is disabled and ASP1 will assume
the value of ATIME, meaning only a single ALS sample per channel will be created each ATIME. If
ASP1 is non-zero, ASP2 should not be programmed to 0. If only an ASP1 period is required, ASP2
should be programmed to the same value as ASP1. The ASPx controls can be set from 0 to 16383.
The ASPx time is calculated as (ASPx + 1) × 1.357 µs, so the range for each is 1.357 µs to
22.233 ms.
Although the programming of ASP1, ASP2 and ATIME is highly flexible, it is always recommended
that ATIME be an integer multiple of ASP1 + ASP2, that is ATIME = N × (ASP1 + ASP2), where N is a
positive integer.
Checking the Double Data Mode checkbox causes for each channel to store data into the FIFO as an
8-bit value rather than the normal 16-bit value. In very low-light situations, this allows twice as many
samples to be stored in the FIFO, but if the actual data in any channel exceeds 8 bits, this setting will
result in the loss of data, and so should be used carefully.

Document Feedback
TCS3720
Software Description
Demo Kit Manual •PUBLIC
UG001018 •v1-00 • 2021-Aug-17
22 │16
Checking the Residual Bits checkbox enables appending additional bits to the ALS data values, to
increase their accuracy. See the datasheet for an explanation of the effect that this has on the data
format and the interpretation of the ALS channel values.
Clicking on the FIFO Clear button will cause any data remaining in the FIFO to be cleared. Under
normal operation, the GUI will only start/stop in pre-defined circumstances and use of this button
should be unnecessary.
4.8 “ALS” Tab
The main portion of the screen contains a tab labeled ALS. It displays measurement data.
Figure 11:
ALS Tab
4.8.1 ALS Output Data
The left side of the ALS tab displays the ALS measurement data and a snapshot of the ALS FIFO
status. The contents of the ALS data depends on the configuration of the ALS channels and the ASP1
and ASP2 settings.
The ALS data is displayed in four lines, one for each possible active channel. If the device is
configured for 2-Channel Mode, then the lines for channels 2 and 3 will be grayed out and will always
display 0. If Color Mode is selected, all four lines will be active.
The setting of ASP1 and ASP2 control the display of the data columns. If ASP1/ASP2 operation is not
active (ASP1 = 0), all of the data will be displayed in the first column, labeled ASP1, and the ASP2

Document Feedback
TCS3720
Software Description
Demo Kit Manual •PUBLIC
UG001018 •v1-00 • 2021-Aug-17
22 │17
column will always display 0. If ASP1/ASP2 operation is active (ASP1 > 0) then the data is displayed
in both columns.
The ALS data is read from the FIFO until all of the data for the configured ATIME value is read. It is
then displayed on the screen. If ASP1/ASP2 operation is not active, there will be a single data point
for each. That data will be added to the graph (if enabled) and displayed in the ASP1 and ASP2
columns. If ASP1/ASP2 operation is active, all of the data will be added to the graph, as appropriate,
but only the first ASP1 and ASP2 value for each channel will be displayed under the ASP1 and ASP2
columns.
4.8.2 FIFO Status
The ALS FIFO box shows a snapshot of the FIFO status each time the program polls the device. The
following items are displayed:
●Empty: This box will be marked if the FIFO is empty when polled.
●Overflow: This box will be marked if an overflow condition has occurred since the last poll.
●Level: Shows the number of data sets waiting to be read (Data set size can vary from 2 to 16
bytes, depending on Channel configuration, Double Data Mode, and ASP1/ASP2 settings.
4.8.3 ALS Data Plot
The remaining portion of the ALS tab is used to display a running plot of the collected ALS values. The
last 500 values are collected and plotted on the graph. As additional values are added, the old values
will be deleted from the left side of the graph. To start the plotting function, check the Enable Plot
checkbox and select the 0, 1, 2, and/or 3checkboxes. If 2-Channel mode is selected only boxes 0
and 1 will be active. The Clear Plot button will clear the data from the screen and start a new plot.
Figure 12:
ALS Data Plot
The scale of the Y-axis of the plot can be adjusted by clicking on the small up and down arrows at the
top left corner of the plot. The scale can be set to any power of 2 from 64 through 65536.

Document Feedback
TCS3720
Software Description
Demo Kit Manual •PUBLIC
UG001018 •v1-00 • 2021-Aug-17
22 │18
The data for each channel will be displayed in a different color, but if ASP1/ASP2 operation is active,
the lines for the ASP1 and ASP2 data will be the same color.
4.9 “Prox” Tab
The main portion of the screen contains a tab labeled Prox. The controls in this tab are divided into
two sections, each performing a separate function.
Figure 13:
Prox Tab
4.9.1 Prox Output Data
The left side of the Prox Tab displays output and status data. This data is polled from the device at the
user-specified interval. The actual polling interval is shown in the upper right-hand corner of the
screen.
●PDATA displays the latest polled Proximity channel count. Note that the TCS3720 can be
configured to run much faster than this program can run, so this field will not display every
PDATA value from the device.
●SW Avg is an average of the most recent 32 values polled from the device.
●StDev is the standard deviation of the last 32 values polled from the device.
●Temp is the current temperature reading from the device. This value is only valid if both prox
and Temperature are enabled.

Document Feedback
TCS3720
Software Description
Demo Kit Manual •PUBLIC
UG001018 •v1-00 • 2021-Aug-17
22 │19
●VSYNC indicates the most recent VSYNC period detected. This value is only valid if a VSYNC
signal is present.
●VSYNC Lost will be marked when the device detects a missing VSYNC signal
●VSYNC LOST Int will be marked when the VSYNC LOST Interrupt is active.
●Saturation is marked to indicate that some saturation condition has occurred in the prox
processing. The Stage 2, Amb Lvl Comp, Stage 1 Amb, and Stage 1 Pulse indicators
provide further information regarding the saturation condition. See the Datasheet for an
explanation of the meaning of each of these status bits.
4.9.2 Prox Data Plot
The remaining portion of the Prox tab is used to display a running plot of the collected PDATA values.
The last 350 values are collected and plotted on the graph. As additional values are added, the old
values will be deleted from the left side of the graph. To start the plotting function, check the Enable
Plot checkbox.
Figure 14:
Prox Data Plot
The scale of the Y-axis of the plot can be adjusted by clicking on the small up and down arrows at the
top left corner of the plot. The scale can be set to any power of 2 from 16 to 16384.
The Prox and ProxAvg checkboxes control which data is displayed on the plot.
Click the Clear Plot button to discard the current data and continue plotting the new data. Note if the
Clear Plot button is clicked while the plot is disabled, the data is discarded, but the actual plot will not
be updated until the plot function is re-enabled.

Document Feedback
TCS3720
Resources
Demo Kit Manual •PUBLIC
UG001018 •v1-00 • 2021-Aug-17
22 │20
5 Resources
For additional information regarding the TCS3720, please refer to the datasheet. For information
regarding the installation of the TCS3720 EVM host application software please refer to the TCS3720
EVM Quick Start Guide.
Designer’s Notebooks dealing with various aspects of optical measurement and optical measurement
applications are available. All content is available on the ams OSRAM website www.ams-osram.com.
For further information, please refer to the following documents:
●TCS3720 Datasheet
●TCS3720_QG001011 EVM Quick Start Guide (QSG)
●TCS3720_UG001018 User’s Guide (this document)
●TCS3720 EVM Schematic Layout
Other manuals for TCS3720
2
Table of contents
Other AMS Motherboard manuals

AMS
AMS AS5 Series User manual

AMS
AMS AS3933 Operating and installation instructions

AMS
AMS AS5000 User manual

AMS
AMS AS5270-MF_EK_SB User manual

AMS
AMS TSL2521 User manual

AMS
AMS T 2672 Series User manual

AMS
AMS TSL2584TSV User manual

AMS
AMS AS5047P-TS_EK_AB User manual

AMS
AMS AS5601-SO_EK_ST User manual

AMS
AMS TSL2540 EVM User manual