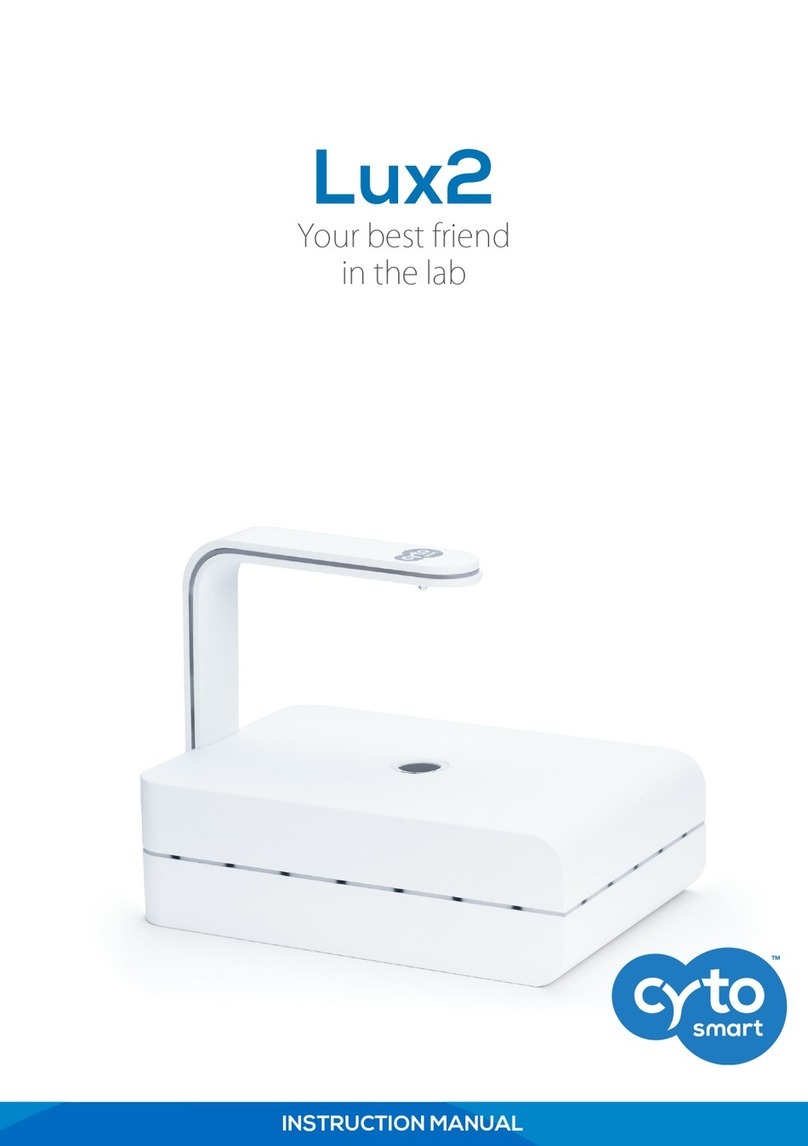
CytoSMART Omni User manual

1
CytoSMART® Omni
Instruction manual

2
Table of Contents
Safety information ........................................................................................................................................3
1. Introduction ..............................................................................................................................................4
How easy the CytoSMART® Omni works ..................................................................................................4
Ideal circumstances for cell cultures.........................................................................................................4
System overview.......................................................................................................................................4
2. Getting started..........................................................................................................................................5
3. Setting up the CytoSMART®Omni.............................................................................................................6
Setup Procedure .......................................................................................................................................6
Registration of the Device.........................................................................................................................7
4. Performing an experiment........................................................................................................................9
Focusing on the Cells ..............................................................................................................................10
Starting an experiment ...........................................................................................................................11
During the Experiment............................................................................................................................12
Ending an experiment.............................................................................................................................14
5. Appending a scan to an experiment .......................................................................................................15
6. Connecting to the Cloud .........................................................................................................................16
Login to the cloud ...................................................................................................................................16
Project overview .....................................................................................................................................16
Experiment overview..............................................................................................................................17
Experiment results..................................................................................................................................17
Map view page....................................................................................................................................18
Graph pane .........................................................................................................................................21
Edit areas.............................................................................................................................................19
Scan overview pane ............................................................................................................................21
Area page............................................................................................................................................22
Group areas.........................................................................................................................................21
7. Cleaning and troubleshooting.................................................................................................................23
Cleaning and maintenance .....................................................................................................................23
Troubleshooting......................................................................................................................................23
8. Technical specification............................................................................................................................26
9. Warranty.................................................................................................................................................27
3
Safety information
To avoid damage or malfunction of the CytoSMART®Omni:
•Be sure to set this device on a firm, stable and horizontal surface. The device may break or cause
injury if it falls.
•Shut down the device immediately if it produces smoke, a strange odor or unusual noise. Continued
use may lead to fire. Unplug the power cable and USB cable immediately.
•Do not connect cables in ways other than those mentioned in this manual, as this may cause damage
and lead to fire.
•If water or other liquid enters the device, discontinue use immediately. Continued use may lead to
fire. Unplug the power cable and USB cable immediately.
•Do not attempt to repair or remove the outer case of the device. If you open this instrument, you put
yourself at risk of bodily harm due to electrical shock in addition to damaging the device.
•Never attempt to repair, disassemble or modify this device yourself, tampering with this product may
result in injury or fire.
•Do not drop the device or allow objects to fall onto it.
•Do not allow the device to be submerged in liquid.
•Do not place heavy objects on top of this device and never stand or lean on this device. Failure to
follow this may cause the equipment fall or collapse, which results in possible breakage and/or injury.
•Do not autoclave the device.
•Do not perform the sterilization cycle of an incubator with the device inside.

4
1. Introduction
Thank you for purchasing the CytoSMART® Omni. The CytoSMART® Omni is an in-incubator automated
live-cell imager that uses state of the art optics and image analysis software. Its innovative design allows
you to acquire a brightfield scan of any cell culture vessel within minutes and provides almost instant
cloud-based image analysis of your cell culture.
How easy the CytoSMART® Omni works
The CytoSMART® Omni can be installed within several minutes and requires minimal training.
Hardware and software work together like a charm. The system consists of the CytoSMART® Omni, an
automated live-cell imager, which operates inside a CO2-incubator. The device is linked to a Windows
laptop that is delivered together with the CytoSMART® Omni. Via the laptop, you can customize your
imaging settings and get started. The images are then transferred to the CytoSMART™ Cloud via an
internet connection. You can access the CytoSMART® Cloud via any web browser on any device with an
internet connection. In the cloud, it is possible to view both the unprocessed and analyzed data and
download the images, videos and Excel-files regarding the cell culture. All your data is right there when
you need it.
Ideal circumstances for cell cultures
With the CytoSMART® Omni, cells can remain in their ideal culture conditions inside the incubator by
monitoring them online. There is no need to disturb the best environment of your experiment.
The CytoSMART® Omni is ideal for performing viability experiments or migration assays in multi-well
plates. The system can also be used for cell culture quality control or experiments in microfluidic devices.
System overview
The hardware of the CytoSMART® Omni consists of:
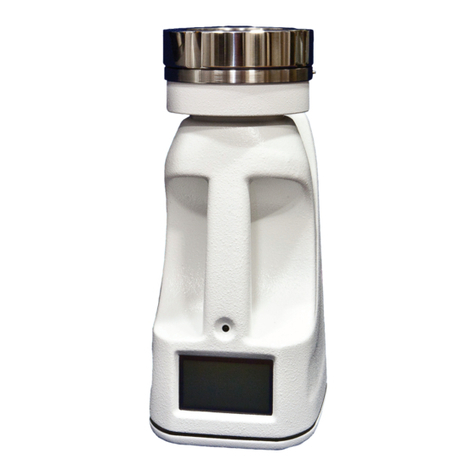
1. Light arc –Contains the light source (LED) for imaging.
2. Cable ports –For connecting the device to power and to the laptop via USB.
3. Optical window –Can hold most transparent culture vessels.
4. Camera –Camera that takes the images.

5
2. Getting started
The content of the CytoSMART® Omni package contains:
1. CytoSMART® Omni
2. USB cable
3. Power adapter
4. CytoSMART® Omni Instruction manual
5. CytoSMART® Omni quick starter guide
6. License key
Remember, if you ever have any questions regarding your purchase, please visit
https://www.cytosmart.com/support or contact our support staff via support@cytosmart.com or the
live chat function in the software or in the cloud. We are happy to help you out.

6
3. Setting up the CytoSMART®Omni
It is really easy to set up the CytoSMART® Omni. All you need are these items:
•An incubator
•The CytoSMART® Omni
•USB-cable
•Power-adapter for the Omni
•Omni adapter plate
•License key (delivered with the Omni)
•A Windows tablet, laptop or PC with internet access (preferably via a LAN-cable) and a USB 3.0 port.
The Windows device needs to be on AC power to make sure the device does not power off during
the experiment.
Be sure to remove any wrapping before placing the CytoSMART® Omni inside the incubator. Also clean
the device with a lint-free wipe and 70% ethanol or isopropanol.
Important: Do not use acetone to clean the device and do not autoclave the device.
Setup Procedure
Important: Place the CytoSMART® Omni in the incubator at least 1 hour before the start of your
experiment to make sure the device has equilibrated to incubator temperature.
1. Turn on the tablet, laptop or PC. Make sure the laptop or tablet is connected to the power plug.
2. Check if the incubator has a cable port in the back.
a. If so, guide the USB cable and the power cable through it.
b. If no port is present, place the cables between the door and frame of the incubator.
3. After the cables are properly guided, place the CytoSMART® Omni inside the incubator and plug in
the cables (fig. 1).
4. Plug the other end of the power cable in a power socket.
5. Plug the other end of the USB cable in a USB-3.0 port of the PC
or tablet. You can recognize a USB-3.0 port by the superspeed
logo (and a blue bar; fig. 2).
a. After plugging in the USB cable, the device will home to
its start position.
Important: make sure to first plug in the power cable before plugging in the USB
cable.
6. Clean the Omni adapter plate with a damp lint-free wipe with 70% ethanol or
isopropanol (IPA).
7. Place the adapter plate on the CytoSMART® Omni in such a way that the curved
edges of the adapter plate align with the curved edges of the glass plate (fig. 3A).
fig. 2. Examples
of a USB-3.0 port.
fig. 1. USB port (left) and power port
(right) of the CytoSMART® Omni.

7
Registration of the Device
Before you can use the CytoSMART® Omni, you must register it. This only needs to be done the first
time you use the CytoSMART® Omni.
1. Start the preinstalled CytoSMART® Omni app by double clicking on the icon on the desktop (fig. 4).
2. In case you are asked if you want to allow this app to make changes to your device, answer with
“Yes”.
3. Once the app has started you will be asked to log in using you email and password (fig. 5). In case you
do not have an account yet, press “Register” to create a new account. You will be led to the
registration form (fig. 6). Please fill in all the details and click “Sign up”.
The next step is to register the device. The license key for this device is provided on a card that is delivered
together with the device. Enter the license key that is provided in the field “License” on the card and click
“Register” (fig. 7).
fig. 3. Top view images of A) Correct placement of the Omni adapter plate
on the CytoSMART®Omni, B) Correct placement of a well plate, and C)
correct placement of a T-flask.
fig. 5. Log in screen of the CytoSMART®Omni app. Sign in
with your email and password or create a new account.
fig. 6. Sign up registration form.
fig. 4. CytoSMART®Omni app icon.

8
Congratulations, you have now successfully registered and activated your CytoSMART®Omni!
fig. 7. Register your device by entering the license key.

9
4. Performing an experiment
Before you can start an experiment, you need to place your culture vessel on the CytoSMART® Omni. In
case you are using a well plate, place it with well A1 in the corner of the adapter plate (fig. 3B).
Subsequently you can select the well plate size in the CytoSMART® Omni app by clicking “Select Your
WellPlate” (fig. 8).
Choose the correct well plate from the dropdown list that appears (fig. 9). In case you are using another
cell culture vessel, select “Other Vessel”.
fig. 8. Experiment page. Select the well plate size by clicking “Select your WellPlate”.
fig. 9. Select the correct cell culture vessel from the drop-down menu.

10
Once you have selected your well plate size, an image of the well plate appears on the right side of the
screen (fig. 10A). In case you have selected “Other”, a light blue rectangle will appear (fig. 10B). Click on a
certain spot on the blue well plate image/rectangle to move the camera to that position, a red cross will
appear indicating the current position of the camera. Use the arrow keys for fine movements.
Focusing on the Cells
1. Go to the middle of one of the wells, use the arrow keys for fine movement to go exactly to the
middle of a well.
2. To focus, move the slider bar (bar on the bottom left; fig. 10) by dragging it with your mouse. Click
the plus- or minus-sign for fine changes in focus. For proper analysis of your cells, you should see a
contrast. You can choose the type of contrast that you prefer:
•Set the focus such that the cells are dark with sharp edges (fig. 11A)
•Set the focus such that the cells are white with a sharp dark edge (fig. 11B)
3. Once you have set the focus, move to the middle of a couple of other wells spread throughout the
well plate to check whether the cells in the other wells are also in focus.
•In case the cells in the other wells are not in focus, set the focus such that the cells in most wells
are clearly visible (try to find an average focus level).
fig. 10. A) Use the image of the well plate on the right to navigate to one of the wells. B) Navigate though your cell culture
vessel using the mouse or arrow keys. A red cross indicates the current position of the camera. Use the slider bar on the
bottom left for focusing. Click and drag the arrows for coarse adjustment of the focus, click the plus- or minus for fine changes.
A
B
fig. 11. Examples of the correct focus. Left: cells are completely black with sharp edges. Right: cells are white
with a clear black edge.
A
B

11
Starting an experiment
When the focus is set, you are ready to start your experiment. To start the experiment, follow the protocol
below:
1. Start the experiment by clicking on the blue
“Start experiment”button (fig. 10). The first time
you perform an experiment, you are immediately
led to the Create project page to create a project
(fig. 12). Your experiments are automatically
stored within a project, which you can view later
in the CytoSMART® Cloud. In the Start a project
page, you can name the project and give it a
description. The next step is to assign a colored
icon to the project. This helps you to find your
project easily, based on the color of the icon.
Click the “Create my project” button to finish the setup.
2. Once you have created a project, you will be led to the Settings page. In case you already have a
project, you will be led to the Settings page immediately after you click the blue “Start experiment
button”.
3. Select a project from the drop-down list on the top left of the Settings page (fig. 13) or create a new
project by selecting “Create a new project”. When you create a new project, you will be led to the
Create project page (fig. 13).
4. Next, give the experiment a name.
5. Check whether the correct culture vessels is selected. In case you have selected the wrong type of
culture vessel you can change this by going back to the Experiment page (fig. 13).
6. Subsequently select whether you want to perform time-lapse imaging or take a single scan. You can
set the time interval of the time-lapse experiment using the drop-down menu (fig. 13).
7. Select the type of image analysis that needs to be applied to your images. You can choose between
”Confluence detection”, “Colony detection” or “Scratch assay”.
8. In case you would like to be updated about
the status of the experiment, tick the “Send
me status updates by email on each scan”-
checkbox. If you want to be notified when
there is an internet connection issue, tick the
“Alert me with SMS”-checkbox.
fig. 13. Set the experiment parameters in the “Settings Omni
experiment” page.
fig. 12. Create a new project by filling in the details.

12
9. After entering the details, click the blue “Start experiment” button and the first scan of the
experiment will start! A new window opens indicating a scan is in progress (fig. 14) and you will
receive an email that the experiment has started with a link to the experiment page in the cloud.
During the scan, you can not adjust any settings of the experiment.
During the Experiment
After approximately one minute of inactivity, the app will go in sleep mode (fig. 15). Even though the app
is in sleep mode, the CytoSMART® Omni will continue scanning your cells according to your settings.
Once the scan is finished, the Scan in progress window will disappear (fig. 16) and the camera and LED will
turn off to protect your cells from light in-between scans.
fig. 14. Scan in progress window.
fig. 15. Sleep mode while a scan is being made.

13
In case you would like to check your cells or adjust the focus level between scans, tap or click on the screen
(fig. 16) to go to the Experiment page (fig. 17). The camera and LED will turn on so you can navigate
through your well plate and adjust the focus level if necessary. You cannot adjust the type of culture vessel
that you have selected. A progress bar on the bottom right indicates the time until the next scan will start.
fig. 17. Experiment page between the scans of an experiment. If necessary, you can
navigate through your well plate and/or adjust the focus level in-between scans.
fig. 16. Sleep mode in-between scans.

14
Ending an experiment
Stopping is as easy as starting. To end an experiment, select the
red “Stop experiment” button in the Scan in progress window
(fig. 14 and 15) or in the Experiment page (fig. 17). A new
window will appear asking you if you really want to stop the
experiment (fig. 18). Select “Stop experiment” to confirm. A
confirmation email indicating that the experiment has ended
will be sent.
Once the experiment has stopped, you are led to the Experiment page (fig. 8) so you can start a new
experiment or stop the Omni app.
fig. 18. Stop experiment window. Select
“Stop experiment” to confirm.

15
5. Appending a scan to an experiment
In case you would like to combine several single scans into one experiment, you can add a scan to an
existing experiment containing one or more single scans.
First, select the correct culture vessel and focus on you cells as explained above. Subsequently, click on
the gray “Extend experiment” button (fig. 19)
You will be led to the Extend experiment page (fig. 20), where you can select the experiment to which you
would like to add the scan. The list of experiments is a list of all experiments that contain one or multiple
single scans that were made with the selected culture vessel type.
In case you have not made any single scan with this type of culture vessel before, this list is empty and
you cannot add a scan to an experiment (fig. 21). Click the “back” button to go back to the Experiment
page (fig. 19) and start a new single scan experiment by clicking the “Start experiment” button. You can
add a scan to this single scan experiment at a later timepoint.
fig. 19. Click the Extend experiment button to add a scan to an existing experiment.
fig. 20. Click the append scan button to add a scan to a particular experiment.
fig. 21. There are no experiments to which a scan can be added. Click the “back” button.

16
6. Connecting to the Cloud
One of the coolest features of the CytoSMART® Omni is that the experiment results can be accessed
through the CytoSMART® Cloud, so you can monitor the progress of the experiment in real time. If you
want to access the cloud, you need a PC, tablet or other device with a web browser, an active internet
connection and your CytoSMART® Cloud login details.
After starting an experiment, the captured images will be stored in the cloud. To allow for this, make sure
the system has an active internet connection. All time logs in the cloud are set to GMT.
Login to the cloud
After starting or ending an experiment, a confirmation email is sent that contains a link to the cloud. If
you did not receive a confirmation email, please check your spam folder. Alternatively, go to
https://cloud.cytosmart.com/ to log in and view your projects and experiments. This link will lead you to
the CytoSMART®Cloud login page (fig. 22). Log in using the credentials you created earlier. If you have
multiple customer environments, choose which environment you would like to access (fig. 23).
Project overview
After logging in to the Cloud, you will get access to an overview of all projects (fig. 24A). If desired, the tile
mode of the Project overview page can be changed to a list mode (fig. 24B) using the list icon (fig. 24a).
Navigating the portal is simple. If you have multiple projects in an account, use the search bar (fig. 24b)
to quickly search for a project. To create a new project, select “New Project” (fig. 24c). This is similar to
beginning a new project, as described above. It is not possible to start an experiment from the cloud. To
access a project and all its assigned experiments, click on the project tile (fig. 24d). Advanced features can
be found after clicking on the three dots (fig. 24e). A new menu opens with the options to share the
project (arrow icon), edit project details (pencil icon) and delete the project (waste bin icon).
fig. 23. Choose a customer environment.
fig. 22. Cloud login page, use your account to log in.

17
Experiment overview
After selecting a project, you will get access to an overview of all experiments assigned to that project (fig.
25A). If desired, the experiments can be shown in list mode (fig. 25B) using the list icon (fig. 25a) Search
for a specific experiment using the search bar at the top left (fig. 25b). At the top right, you can open an
overview of the project data (fig. 25c) and share the project by clicking the “Share project” button (fig
25d). Select a specific experiment by clicking on the experiment image or name (fig. 25e). This will bring
up the experiment page of that specific experiment. Click the three dots to access the advanced features
(fig. 25f). In the new menu, you can choose to move the experiment to a different project (arrow icon),
edit the experiment details (pencil icon) or delete the experiment (waste bin icon).
Experiment results
After you select a specific experiment, an overview of the data collected during that experiment will be
presented in the Experiment page (fig. 26). In the next few pages, you will find an overview of the tabs,
panes and buttons in this Experiment page.
The experiment page contains:
•the Map view page,
•the Quantitative data page of the confluence, scratch or colony data.
fig. 24. Project overview in tile mode (A) and list mode (B). a) Switch between the modes
using the tile and list icon. b) Search projects, c) create a new project, d) open project and e)
advanced features.

18
Map view page
In the map view page (fig. 26) you find overview images of each scan made during the experiment.
•Use the slider bar at the bottom to go through the different time points. (fig. 26a)
•You can zoom in and out by scrolling or clicking the plus and minus signs on the left (fig. 26b).
•Click on an area (outline is highlighted when you hover over the area) to go to the Area page of that
area. The Area page is explained in detail below.
•On the left, you can also find the
buttons to go to full screen mode and
to print the image (fig. 26b).
•Click and drag the image to move it.
•Use the drop down menu on the top
right (fig. 26d) to obtain an overlay of
the analyzed data in green
(confluence), blue (scratch) or
orange (colony).
•Click the ruler icon (fig. 26e) to
enable a measuring tool. Click, move
the mouse, and click again. A blue
line will appear and the distance
between the two points is indicated.
fig. 26. Map view page. Zoom in and pan through the scan. Use the slider
bar to go through different timepoints (a). b) Zoom, full screen and print
buttons, c) edit mode button, d) dropdown menu for an overlay of the
data, e) ruler and f) brightness slider.
fig. 25. Overview of all experiments within a project in tile mode (A) and list mode (B). a)
Switch between the modes using the tile and list icons. b) Search experiments, c) project
details, d) share the project, e) open experiment and f) advanced features.

19
•Use the brightness slider on the
bottom right (fig. 26f) to adjust the
brightness of the image.
In case colony analysis was selected upon
the start of the experiment, some extra
features are available in the map view:
•The number of colonies in each
area is displayed in circles on the
map view (a in fig. 27A).
•Upon zooming in, individual
colonies are outlined in blue (fig
27B).
•Click on a colony to view the
information (area, circularity and
perimeter) of that specific colony
(fig. 27C).
•Gates can be applied to the
colonies based on size, circularity
and perimeter to select the
appropriate colonies (fig. 27b).
•Save the gates for the experiment
by clicking on the “Save gating”
button (fig. 27c).
Edit areas
After toggling on the edit mode (fig. 26c), you are led to the Edit areas page (fig. 28A). In this page you
can draw custom areas in the scan that (also) need to be analyzed. This is especially useful when you use
any vessel other than well plates. You can draw areas on top of the predefined well areas if necessary.
•Zoom in and out, and move the image as described above.
•Click the circle, rectangle or polygon tool on the right (fig. 28a) to draw areas on the scan. Create a
circle or rectangle by clicking and dragging your mouse. Create a polygon by clicking multiple times
on the image. Close the polygon by clicking on the green start node.
•Click on an area to edit it using the square handles that appear after selection (fig. 28e). Move the
area by clicking and dragging. Delete the selected area by using the delete button or the waste bin
icon in the list of shapes (fig. 28f).
•Copy, cut and paste an area by using the Ctrl + C, Ctrl + X and Ctrl + V keyboard shortcuts. The areas
will be pasted at the current position of the cursor. You can also right-click on the area and
subsequently select the copy, cut or paste option.
•Multiple areas can be selected simultaneously by using the group selection mode (fig. 28b). Select
the areas that need to be grouped by clicking and dragging a box around the areas or by holding the
Ctrl key and clicking the areas. The selected areas are indicated by a green outline (fig. 28B).
fig. 27. Colony options in the map view page. A) The number of colonies
is displayed in circles (a) on top of each area. b) Gating based on size,
circularity and/or perimeter can be applied to select the appropriate
colonies. c) Save the gate settings for the experiment. B) Upon zooming
in, individual colonies that fall within the gate settings are outlined in
blue. C) After selecting a colony, the information of that colony is
displayed in a text box.

20
•Grouped areas can be moved, copied
and pasted in the same way as
individual areas.
•All manipulations to the areas can be
undone or redone using the undo and
redo buttons on the top right (fig. 28b).
•Edit the names of the shapes in the area
list (fig. 28d) by clicking on the pen icon.
Save the name using Enter or by clicking
on the save icon.
•Analyze the areas by clicking the
“Process areas” button (fig. 28c). You
are led to the Submit selected areas
page (fig. 29) where you can select the
type of analysis you would like to
perform. Subsequently click the
“submit” button to analyze the areas. All
scans that are added to the experiment
after creating the new areas will be
processed. In case you only want to
analyze the timepoint in which the areas
are drawn, tick the preview checkbox.
Quantitative data page
Next to the map view page, the experiment page also
contains a tab (or multiple tabs) containing the
quantitative data of the selected algorithm(s). The quantitative data page contains:
•Confluence, scratch or colony graphs (fig. 30a),
•buttons to refresh the data and to download an Excel-file of the results of all areas at each
timepoint (fig. 30b),
•a button to clear the selected areas (fig. 30c),
•an overview image of
the scan in which areas
can be selected (fig.
30d),
•a drop-down menu to
go to the Area page (fig.
30e) and
•a button to group areas
(fig. 30f).
fig. 30. The experiment page contains a) graph pane(s), b) refresh and download
buttons, c) clear graph selection button, d) scan overview image, e) drop down menu
to go to single area experiment page and f) group areas button.
fig. 29. Select the type of analysis you would like to
perform on the created areas.
fig. 28. Edit areas page (A). Draw areas in the scan that you would
like to analyze. a) Circle, rectangle and polygon tools. b) Group
selection, undo and redo buttons. c) Process area button and d) list
of created areas. Drawn areas can be edited using the square handles
(e). Edit the names of the areas and delete areas using the tools in
the list (f). (B) Grouped areas are outlined in green.
Table of contents
Other CytoSMART Laboratory Equipment manuals
Popular Laboratory Equipment manuals by other brands

Gamry Instruments
Gamry Instruments ParaCell Operator's manual

Big Daishowa
Big Daishowa Base Master Mini BMM-20 Operation manual

Samsung
Samsung SM421 Operation handbook

Steinberg Systems
Steinberg Systems SBS-LZ-300D user manual

BANDELIN
BANDELIN Trison 4000 operating instructions

ProteinSimple
ProteinSimple FluorChem M user guide