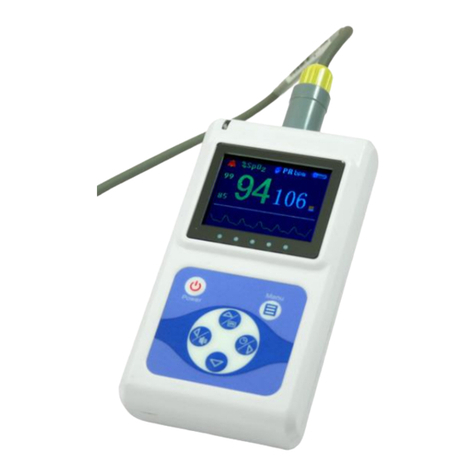
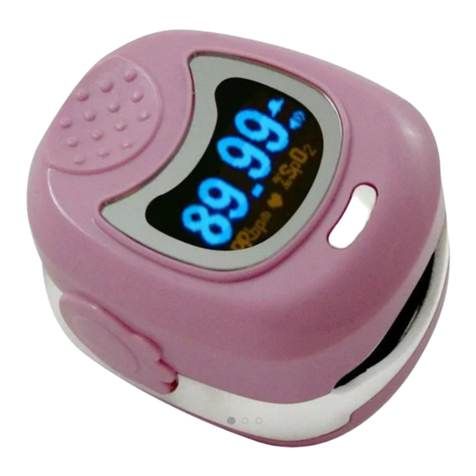
DARAY V402+ User manual

V402+
HANDHELD
PULSE OXIMETER
& TEMP MONITOR
OPERATING MANUAL
QAM/V402+ -1
–
02/07
®


3
®
1 SAFETY INFORMATION 4
2 FUNCTIONS 6
3 INSTALLATION 8
4 DISPLAY AND OPERATION 9
5 SPO2 MONITORING 18
6 TEMP MONITORING 22
7 MAINTENANCE 23
8 V402+ PATIENT MONITOR DATA VIEWER
26
9 PACKING LIST AND ACCESSORIES 26
RETURNS POLICY 29
WARRANTY 30
WARRANTY REGISTRATION 31

4
1. SAFETY
This manual provides the instructions necessary to operate the V402+ SpO2/TEMP patient
monitor in accordance with its function and intended use.
NOTE
Adherence to this manual is a requirement for proper performance and correct
operation of the V402, and ensures patient and operator safety.
This manual is an integral part of and should always be kept close to the monitor, so that it
can be to hand when necessary.
Content of this manual is subject to change without prior notice.
Statement
The manufacturer is responsible for safety, reliability and performance of this product only
in the condition that:
•All installation operations, expansions, changes, modifications and repairs of this
product are conducted by manufacturer authorized personnel
•The electrical installation of the relevant room complies with the applicable national
and local requirements
•This product is operated under strict observance of this manual.
The safety statements presented in this chapter refer to the basic safety information that
the operator of the monitor shall pay attention to and abide by. There are additional safety
statements in other chapters or sections, which may be the same as or similar to the
followings, or specific to the operations.
The following safety terms warning and caution are used throughout this manual to point
out hazards and to designate a degree or level or seriousness.
WARNING Indicates a potential hazard situation or unsafe practice that, if not avoided,
could result in death or serious injury.
CAUTION Indicates a potential hazard or unsafe practice that, if not avoided, could result
in minor personal injury or product/property damage.
NOTE: Provides application tips or other useful information to ensure that you get the
most from your product.

5
1.1 Warnings
•The monitor is intended only as an addition to patient assessment. It must be used in
conjunction with clinical signs and symptoms. It is not intended as a device used for
treatment purposes.
•The monitor is intended for use only by qualified clinical physicians or well-trained nurses.
•To ensure patient safety, verify this device and accessories can function safely and
normally before use.
•When using the monitor together with electrical surgery equipment, the user should
pay attention to and guarantee safety of the patient being measured.
•EXPLOSION HAZARD: Do not use the monitor in the presence of flammable
anaesthetics, explosive substances, vapours or liquids.
•Do not pull or lift the monitor by its cables. It could lead to falling and consequent
patient injury.
•It is not recommended to hang the monitor when transporting patients. Safety hazards
may arise from the swinging monitor during the transportation.
•Do not use the monitor and it’s transducer during MRI (Magnetic Resonance Imaging)
scanning because induced currents could potentially cause burns. The monitor can
interfere with the proper performance of MRI, and MRI is can interfere with the
measurement accuracy of the monitor.
•The monitor and its accessories may be contaminated by micro-organism during
transporting, use and storage. Use the recommended methods to sterilise and disinfect
the monitor or its accessories when the packing material is damaged, or if it has not
been used for a long time.

6
1.2 Cautions
•The monitor is not a fully sealed device. Keep its surface dry and clean, and prevent
any liquid from infiltrating it.
•The device should be positioned appropriately. Keep it from falling, strong vibration or
other mechanical damage.
•Do not use mobile phones near where the monitor is operating. Mobile phones may
emit electromagnetic radiation which is capable of interfering with the proper
performance of the monitor.
•The monitor should only be maintained by personnel approved by our company.
•Before using the monitor on patients, the user should be familiar with its operation.
IMPORTANT
Before use, carefully read this manual, all safety information and specifications.
The monitor is a non-invasive, handheld patient monitor. It operates on AC or rechargeable
battery power supply. It is suitable for monitoring adult and child patients. It is widely used
in the hospital’s operation room, ICU, clinic section office, out-patient department,
sickroom, emergency treatment, and the recovery and health care organisations, or in
family nursing and in patient transportation.
Parameters measured by the monitor include: arterial oxygen saturation (SPO2), pulse rate
(PR), plethysmogram waveform (PLETH), pulse strength and temperature (TEMP). The
monitor measures these parameters through a SPO2 sensor and a TEMP sensor and displays
them on the LCD screen.
The monitor is operated and controlled by the buttons on the front panel. It adopts a
monochrome LCD screen in displaying measurements and waveforms, and a dual-colour LED
in supplementary status indication. It is also capable of managing measured data and
transmitting the patient’s trend through the communication socket to a PC for display,
observation, saving and printing.
Function structure.
The monitor is composed of main unit, SPO2 sensor, TEMP probe and AC power adaptor.
2. FUNCTIONS
•The monitor has the following functions:
•Measuring: Intelligent display of SPO2, PR, PLETH, pulse strength and TEMP.
•Prompting: battery capacity, speaker volume.
•Alarm: judgement of exceeding the limits, Audio and visual alarm.
•Power saving: automatic shutdown when no monitoring.
•Data Managing: data storage, data adding, data deletion, drawing trend waveforms with
saved data.
•Communication: transmitting the patient’s trend data to a PC for display, observation,
saving and printing.
For the data display, observation, saving and printing function, you must install the data
viewer software in a PC equipped with a printer, and connect the monitor with the PC by a
special communication cable.
7
2.1 Appearance
Fig 1
1 SpO2sensor socket
2 TEMP prove socket
3 LCD display
4 Dual-colour LED: Green = power on. Red flashes with heartbeat
5 Power button
6 Menu button: changes display modes
7 Left arrow/contrast: Adjusts display contrast whilst monitoring or
moves cursor left in setup or viewing trend graphs
8 AC power adapter socket
9 PC serial link connector socket
10 Up arrow/backlight: Turns backlight on/off whilst monitoring or
moves cursor up in setup or viewing trend graphs
11 Right arrow/graph-view: Change display to graph-view whilst
monitoring or moves cursor left in setup or viewing trend graphs
12 Down arrow/mute: Speaker on/off whilst monitoring or moves
cursor down in setup or viewing trend graphs
1
2
3
4
5
6
7
8
9
10
11
12

8
3. INSTALLATION
3.1 Unpacking and Inspection
Please open the package and carefully remove the device and its accessories. Check all
materials against the packing list.
•Check the monitor for any mechanical damage.

•Check for damaged wires, sockets and accessories.

Contact supplier immediately if there is any problem.
NOTE: Please save the packing case and packaging material for future transport
and storage.
3.2 Connect SpO2 sensor and TEMP Probe
You can connect the SPO2 sensor and TEMP probe to the monitor by simply inserting their
connectors to the SPO2 socket on the monitor’s top side panel as shown in Fig. 1(1,2).
3.3 Connect AC Power Adaptor
Plug the AC adaptor into the mains and. The adaptor’s power indicator LED lights up. Insert the
adaptor’s connector to the adaptor socket on the monitor’s right side as shown in Fig. 1(8).
WARNING: The AC power adaptor supplied is built to special requirements and should
only be used with the monitor. Never use other adaptors else the device could be
damaged and may result in patient injury.
3.4 Power-on
Press the power button and hold for more than 3 seconds to turn on the monitor. The green
LED on the front panel lights up. The LCD screen displays the monitoring mode.
3.5 Computer Data Transfer
The monitor can be connected to a Personal Computer through the serial cable supplied, to
transmit patient trend data to the computer for review and saving. The trend waveforms
can then also be printed.
Connect the serial cable to the socket on the monitor’s right side panel (see Fig 1.9) and the
RS232 connector to the PC’s serial port.

9
4. DISPLAY AND OPERATION
The monitor displays three main screens: the monitoring, system setup and trend graphs.
The front panel controls operate the monitor on these screens. For more details, please see
below and refer to Fig. 1.
4.1 Power On/Off
Press the power button and hold for more than 3 seconds to turn on the monitor. The green
LED on the front panel lights up. When the monitor is on, press the power button to turn the
monitor off.
NOTE
The monitor is powered either by the built-in rechargeable battery or external AC power
supply. If not connected by the external AC power supply and the battery hasn’t enough
charge, the monitor may not turn on. If this happens, connect the external power supply to
charge the battery. The monitor will operate on the battery again after the battery is fully
charged. The battery charges automatically whilst connected to the external power supply.
If the SPO2 sensor and the TEMP cable are disconnected, or if the TEMP cable becomes
disconnected and the SpO2sensor stays connected but the finger is removed from the
sensor, the monitor automatically enters standby mode. In this mode, when the SPO2 sensor
is reconnected and a finger is inserted into the sensor, or the TEMP cable is reconnected,
the monitor automatically resumes operation; otherwise the monitor automatically shuts
down in 3 minutes.
4.2 Change Display Modes
The LCD initially displays the monitoring screen when the monitor is turned on. When the
monitoring screen is displayed, press the menu button once to change to the setup screen.
When the setup screen is displayed, press menu button once to change to the trend graphs
screen. When the trend graphs screen is displayed, press menu button once to return to the
monitoring screen. The menu button repeatedly cycles between the three screen modes in
the above sequence.
4.3 Monitoring Screen Display and Operation
The monitoring screen has two forms, parameter monitoring screen and
waveform/parameter monitoring screen.
4.3.1 Parameter Screen Display
The LCD displays the parameter monitoring screen. Parameter screen displays
measurements of the parameters. The monitor can identify which sensor is connected and
then display the appropriate parameter screen automatically. There are four various
parameter screens altogether.

10
SPO2/PR/TEMP Screen
If the SpO2sensor and the TEMP cable are connected, the LCD screen displays the
measurements of SPO2, PR, pulse strength and TEMP, status information and system
information (see Fig. 2).
Fig. 2
SPO2 /PR Screen
If only the SPO2 sensor is connected to monitor a patient’s SPO2, the LCD screen displays
the measurements of SPO2, PR and pulse strength, status information and system
information (see Fig. 3).
Fig. 3
TEMP Screen
If only the TEMP probe is connected to monitor a patient’s TEMP, the LCD screen displays the
TEMP measurement; status information and system information (see Fig. 4).
Fig. 4
1
2
3
4
5
6
7
8
9
10
11
1
2
3
4
5
6
7
8
11
2
4
5
9
10
11

11
Non-parameter Screen
As described in section 4.1, when the monitor enters standby mode and no parameter needs
to be measured, the LCD screen only displays status information and system information and
an animated ‘smiley’ is displayed (see Fig. 5).
Fig.5
4.3.2 Waveform/parameter screen display
The waveform/parameter screen displays PLETH waveform and measurements of the
parameters. (See Fig. 6).
Fig. 6
No Title Description
1 SPO2 SPO2 value (refresh: 1/second)
2 Alarm audio = ON = OFF
3 Pulse strength Max. 10 segments
4 Pulse audio = ON = OFF
5 Clock Displays the current time
6 PR PR value (refresh: 1/second)
7 BPM PR unit
8 % SPO2 unit
9 TEMP TEMP value (refresh: 1/second)
10 °C TEMP unit
11 Battery status Four states indicating battery charge level
12 PLETH PLETH waveform display (real-time)
Use this table as the key for Figs. 2-6
2
4
5 11
12
6
7
9
8
1
8

12
4.3.4 Button Operation
The four multifunction buttons, Left arrow/Contrast, Waveform/Right arrow, Up arrow/Backlight
and Down arrow/Mute, adjust the monitor’s functions on the monitoring screen.
Contrast Button
If it is pressed continually, the LCD contrast will increase cyclically.
Waveform Button
If it is pressed, the monitoring screen will switch between parameter screen and
waveform screen.
Backlight Button
If it is pressed, the LCD backlight will be turned on or turned off.
Mute Button
It is a main switch of the speaker. No matter what level the pulse sound is and whether
every parameter alarm is switched on or off, when it is pressed, pulse sound and alarm
sound become silence or audible totally.
4.3.5 Alarm Monitoring Function
When a parameter’s measurement exceeds its alarm limit, the monitor can give audio and
visual alarms simultaneously. The speaker sounds the alarm and the parameter’s
measurement flashes on the screen. If the speaker sound is turned off by pressing the Mute
button or the parameter’ alarm switch is set off, the parameter’ alarm sound will be
silenced, but the parameter’s measurement still flashes to prompt the alarm. Please refer
to section 4.4 for parameter alarm switch setup.
The alarm sound has top priority when the speaker is not mute. When there is a alarm
whose switch is set on, the speaker sound the alarm sound but not the pulse sound. Only
when there is no measurement exceeding its alarm limit or its alarm switch is set off, the
speaker sound the pulse sound. The pulse is also indicated by the red colour LED on the
front panel no matter whether the pulse sound can be heard. The alarm sound and the pulse
sound can be heard no matter which screen is displayed.
The icon of the alarm sound on the monitoring screen reflects the status of all alarm
switches. When they are all set off or the speaker is silenced by pressing the Mute button,
the icon shows OFF status and no sound can be heard. Otherwise the icon shows ON status
and the alarm sound will be heard if any parameter’s measurement exceeds its alarm limit.

13
4.4 System Setup Screen Display and Operation
The functions of the alarm limits setup, the system status setup and the data management
are performed on the setup screen.
4.4.1 Screen Display
The setup items and values are listed in a table on the system setup screen, as shown in Fig. 7
Fig. 7
4.4.2 Description of Information Displayed
The meanings of the words and the ranges of the values in Fig. 7 are listed in table 4-2 as follows.
Upper limit Lower limit Alarm
SPO2 85 – 100 85 - 100 ON or OFF
PR 40 - 250 40 - 250 ON or OFF
TEMP 30.0 - 45.0 30.0 - 45.0 ON or OFF
Alarm sound 0 - 2. Pulse sound has three levels.
If set to 0, the alarm sound is silenced and the icon on the monitoring
screen also shows OFF ( ).
Data output READY or WAIT
Data storage CLEAR or WAIT
Year
06 - 30 Month
01 - 12 Day
01 - 31 Hour
00 - 23 Minute
00 - 59

14
4.4.3 Button Operation
The four multifunction buttons, Left arrow/Contrast, Right arrow/Waveform, Up
arrow/Backlight and Down arrow/Mute, act as cursor keys on the system setup screen.
Left and Right Arrow Buttons
The cursor moves left when the left arrow is pressed and right when the right arrow is
pressed. The cursor is indicated by a small black square. It moves to the item which is going
to be set up and this item is highlighted.
Up arrow Button
Use the up arrow to increase the values of the alarm sound level or date and time to
increase their values using the up arrow. When the values reach their maximum, they return
to the minimum and start increasing again.
With the cursor on the alarm on/off positions, press the up button to toggle between ON
and OFF.
The Up arrow button is inactive when the cursor is on the DATA OUT and STORAGE items.
Down arrow Button
Use the down arrow to decrease the values of the alarm limit values, alarm sound level or date
and time. When the values reach their minimum, they return to the maximum and start
decreasing again.
With the cursor on the alarm on/off positions, press the up button to toggle between ON and
OFF.
When the Down arrow button is pressed with the cursor on the DATA OUT or STORAGE items,
the relevant function is executed. WAIT is displayed instead of READY or CLEAR because the
data process takes a short. All buttons are invalid during these processes. WAIT will be
replaced by READY or CLEAR when the process is finished.
NOTE
•Incorrectly set time and date interrupts the continuity of the trend time. The date or
time should only be adjusted when it is incorrect and should be done immediately after
the monitor is powered on.
•Alarm limits setup is very important when monitoring. Avoid setting the upper limits
too high or the lower limits too low. For example, the PR upper alarm limit should not
be more than 20 bpm higher than the patient’s actual PR.
4.5 Trend Waveform Screen Display and Operation
The monitor saves parameter measurements every 2 seconds. The storage area can store 36
hours trend data and the new data will overwrite the oldest data automatically after 36
hours. The saved data will never be lost even if the monitor is powered off. It can be viewed
on the trend screen.

15
4.5.1 Screen Display
When the LCD appears the trend screen due to the menu button is pressed on the other screen,
the monitor draws the parameter trend waveforms on the time-measurement coordinate series.
One screen can only display 3 hours data which is defined as a page. The whole storage area is
composed of 12 pages.
Fig. 8

16
4.5.2 Description of Information Displayed
No Description Remarks
1 SPO2 Arterial oxygen saturation.
2 SPO2 measurement
The current SPO2 measurement indicated by the time
indicator.
3 PR Pulse rate
4 PR measurement The current PR measurement indicated by the time indicator.
5 TEMP Temperature
6 TEMP measurement
The current TEMP measurement indicated by the time
indicator.
7 SPO2 waveform SPO2 trend waveform plot - data is stored in memory
8 PR waveform PR trend waveform drawn plot - data is stored in memory
9 TEMP waveform TEMP trend waveform drawn plot - data is stored in memory
10 Time indicator It is the scale indicator of the horizontal axis and the unit
indicator of the storage area.
11 Date and time It shows the moment indicated by the time indicator.
12 Storage area ruler It shows the total size of the trend data storage area.
13 Page indicator
The data forming one screen trend waveforms (time period of 3
hours) is defined as a page, which corresponding to 90 units of
the storage area. The page indicator points out the position of
this data segment of this page.
14 Vertical axis
It is the parameter measurement axis. It is divided into 3
segments which isSPO2 axis, PR axis and TEMP axis from top to
bottom. The terms on its left side mark the names of these
three axes.
15 Horizontal axis It is the time axis. Its minimum scale is 2 seconds and whole
length is 3 hours. The current moment is at the right end of it
and time moves forward in the left direction.
NOTE
•Obtaining stable measurements always needs a period of time. When the monitor is
powered on or the sensors are connected, the trend data may appear sudden change or
transit because of the transition period. The measurements in this period can not be
used as diagnostic basis.
•When time indicator points to the time period without monitoring, the displays of
measurements and the corresponding times are blank because nothing is saved.

17
4.5.3 Button Operation
The four multifunction buttons, Left arrow/Contrast, Waveform/Right arrow, Up
arrow/Backlight and Down arrow/Mute, act as arrow keys on the system setup screen.
Left and Right Arrow Buttons
The left and right arrow buttons move the time indicator left and right in single steps but
remains within the current page of data.
Up and Down Arrow Buttons
The up and down arrow buttons move the time indicator 8 steps at a time. When the time
indicator is at the far right or left, continual pressing changes the page of data stored in the
memory to change forwards or backwards in time.
NOTE: When the time indicator is moved rapidly by the up arrow button or the down
arrow button, the movement may be less than 8 steps.

18
5. SPO2 MONITORING
5.1 Measurement Principle
SPO2 plethysmogram measurement is employed to determine the oxygen saturation of
haemoglobin in arterial blood. The SPO2/PLETH parameter can also provide a pulse rate
signal, pulse strength and a plethysmogram wave.
How the SPO2/ PLETH Parameter Works
Arterial oxygen saturation is measured by a method called pulse oximetry. It is a continuous,
non-invasive method based on the different spectra absorption of haemoglobin and
oxyhaemoglobin (the spectro-photometer principle). It measures how much light, sent from
one side of the sensor, is transmitted through the patient’s tissue (such as a finger or a toe),
to a receiver on the other side.
The sensor measurement wavelengths are nominally 660nm for the Red LED and 940nm for
Infrared LED. Maximum optical power output for LED is 4mW.
The amount of light transmitted depends on many factors, most of which are constant.
However, one of these factors, the blood flow in the arteries, varies with time, because it is
pulsating. By measuring the light absorption during a pulsation, it is possible to derive the
oxygen saturation of the arterial blood. Detecting the pulsation gives a PLETH waveform,
pulse rate signal and pulse strength.
The SPO2 value, PR value, pulse strength and the PLETH waveform can be displayed on
the main screen.
SPO2 is a non-invasive measurement of the functional oxygen saturation.

19
5.2 Measurement Steps
Sensor selection for SPO2 measurement depends on the patient’s age. For an adult patient,
you should select an adult finger sensor; for a child patient, you can choose either a child
hand or toe sensor. The finger SPO2 sensor is a finger clip consisting of two parts. The LEDs
are placed in one part and the photo-detector is placed in another part.
Please follow the steps and Fig. 9 below to use the adult finger SPO2 sensor:
1. Insert the sensor’s connector to the monitor’s SPO2 socket.
2. Turn on the monitor. The LCD screen will display the parameter monitoring screen.
3. Attach the sensor to an appropriate site on the patient’s finger.
4. The readings will be displayed on the LCD screen a moment later.
Fig. 9
NOTE
•Make sure to place the SPO2 sensor on the finger correctly. The LED part of the sensor
should be at the backside of the patient hand and the photo-detector part at the
inside. Make sure to insert the finger to a suitable depth into the sensor so that the
fingernail is just opposite to the light emitted from the sensor.
•To acquire accurate results, please read data until the sensor is steadily placed.
•Readings may not be accurate when either the sensor or the patient is moving.

20
5.3 Measurement Limitations
If the accuracy of any measurement does not seem reasonable, first check the patient’s
vital signs by an alternate method. Then check the instrument for proper function.
Inaccurate measurements may be caused by:
•Incorrect sensor application or use;
•High-frequency electrical noise, such as noise from electrosurgical apparatus
connected to the system;
•Significant levels of dysfunctional haemoglobins (e.g. carboxyhaemoglobin
or methemoglobin);
•Significant concentrations of dysfunctional haemoglobin, such as
carboxyhaemoglobin and methemoglobin;
•Intravascular dyes such as indocyanine green or methylene blue;
•Intense illumination, such as surgical lamps (especially ones with a xenon light
source), bilirubin lamps, fluorescent lights, infrared heating lamps, or direct
sunlight (exposure to intense illumination can be corrected by covering the
sensor with a dark material);
•Excessive patient motion;
•Venous pulsations;
•SPO2 Is too low;
•Improper sensor installation or incorrect contact position of the patient;
•Placement of a sensor on the same extremity with a blood pressure cuff, arterial
catheter, or intravascular line.
•Loss of pulse signal can occur in the following situation:
•The sensor is too tight;
•There is excessive illumination from light sources such as a surgical lamp, a
bilirubin lamp, or sunlight;
•A blood pressure cuff is inflated on the same extremity as the one with a
SPO2 sensor attached;
•The patient has hypotension, severe vasoconstriction, severe anaemia, or
hypothermia;
•There is arterial occlusion proximal to the sensor;
•The patient is in cardiac arrest or in shock.
Table of contents
Other DARAY Medical Equipment manuals

DARAY
DARAY X700 Manual

DARAY
DARAY X240 Manual

DARAY
DARAY MAG700 Range User manual

DARAY
DARAY SL720 User manual

DARAY
DARAY MAG700 Range Installation and operating instructions

DARAY
DARAY X100LED User manual

DARAY
DARAY X100 Manual

DARAY
DARAY V409 User manual

DARAY
DARAY SL720 User manual

DARAY
DARAY DX4501D User manual
Popular Medical Equipment manuals by other brands

GE
GE Optima XR200amx Preinstallation manual

PARAMOUNT BED
PARAMOUNT BED A5 Series instruction manual

Huntleigh
Huntleigh Nimbus 3 user manual

Verathon
Verathon BladderScan i10 Operation & maintenance manual

Aspen Medical Products
Aspen Medical Products ELITE EXTENSION PANEL quick start guide

Watermark Medical
Watermark Medical ARES 610 Product guide