Doepke DRCA 1 Manual

Residual current analysis system
DRCA1
Instructions for use
and technical information
www --------- doepke.de
Residual current analysis
DRCA1
Doepke

Technical
Information
October 2019
Liability
All information contained in this document belonging to Doepke
Schaltgeräte GmbH is protected by copyright. The reproduction
and processing, altering and/or transfer against payment of such
information is permissible only with the express written approval of
Doepke Schaltgeräte GmbH. This information is provided solely as
customer information and does not constitute a binding guarantee
or undertaking. It is subject to changes at any time, be it in technical
content or in price/commercial terms. Binding statements can only
The use of this document is solely at your own discretion. Doepke
Schaltgeräte GmbH accepts no liability for any damages arising from
the use of this document, in particular breakdown of operations, loss
except in cases of compulsory liability, e.g. as provided for by the
Product Liability Law, or in cases of premeditation, gross negligence,
absence of promised capabilities or because of infringement of
fundamental contractual obligations.
Compensation for infringement of fundamental contract obligations
shall, however, be limited to contract-typical foreseeable damage,
provided there is no premeditation or gross negligence.
Copyright © Doepke Schaltgeräte GmbH

9.4 Installation requirements ––––––––––––––––––––––––––––––––––––––––––––––––––––––––––––––––––– page 24
9.5 Connection to the power supply –––––––––––––––––––––––––––––––––––––––––––––––––––––––––– page 24
9.6 Ventilation and cooling ––––––––––––––––––––––––––––––––––––––––––––––––––––––––––––––––––––– page 24
9.7 Residual current input ––––––––––––––––––––––––––––––––––––––––––––––––––––––––––––––––––––––– page 24
9.8 Symbols ––––––––––––––––––––––––––––––––––––––––––––––––––––––––––––––––––––––––––––––––––––––– page 25
9.9 Cleaning and consumable materials ––––––––––––––––––––––––––––––––––––––––––––––––––––– page 25
9.10 Operational safety ––––––––––––––––––––––––––––––––––––––––––––––––––––––––––––––––––––––––––– page 25
9.11 Maintenance –––––––––––––––––––––––––––––––––––––––––––––––––––––––––––––––––––––––––––––––––– page 25
9.12 Warranty –––––––––––––––––––––––––––––––––––––––––––––––––––––––––––––––––––––––––––––––––––––– page 25
9.13 Measurement category ––––––––––––––––––––––––––––––––––––––––––––––––––––––––––––––––––––– page 25
9.14 Firmware and updates –––––––––––––––––––––––––––––––––––––––––––––––––––––––––––––––––––––– page 25
10. Technical data –––––––––––––––––––––––––––––––––––––––––––––––––––––––––––––––––––––––––––––––– page 26
10.1 Product overview/Article numbers ––––––––––––––––––––––––––––––––––––––––––––––––––––––– page 27
1. TheDRCA1residualcurrentanalysissystem
1.1 Intended use of the device ––––––––––––––––––––––––––––––––––––––––––––––––––––––––––––––––– page 6
2. Installation–––––––––––––––––––––––––––––––––––––––––––––––––––––––––––––––––––––––––––––––––––– page 7
3. Connectingthedevice –––––––––––––––––––––––––––––––––––––––––––––––––––––––––––––––––––––– page 7
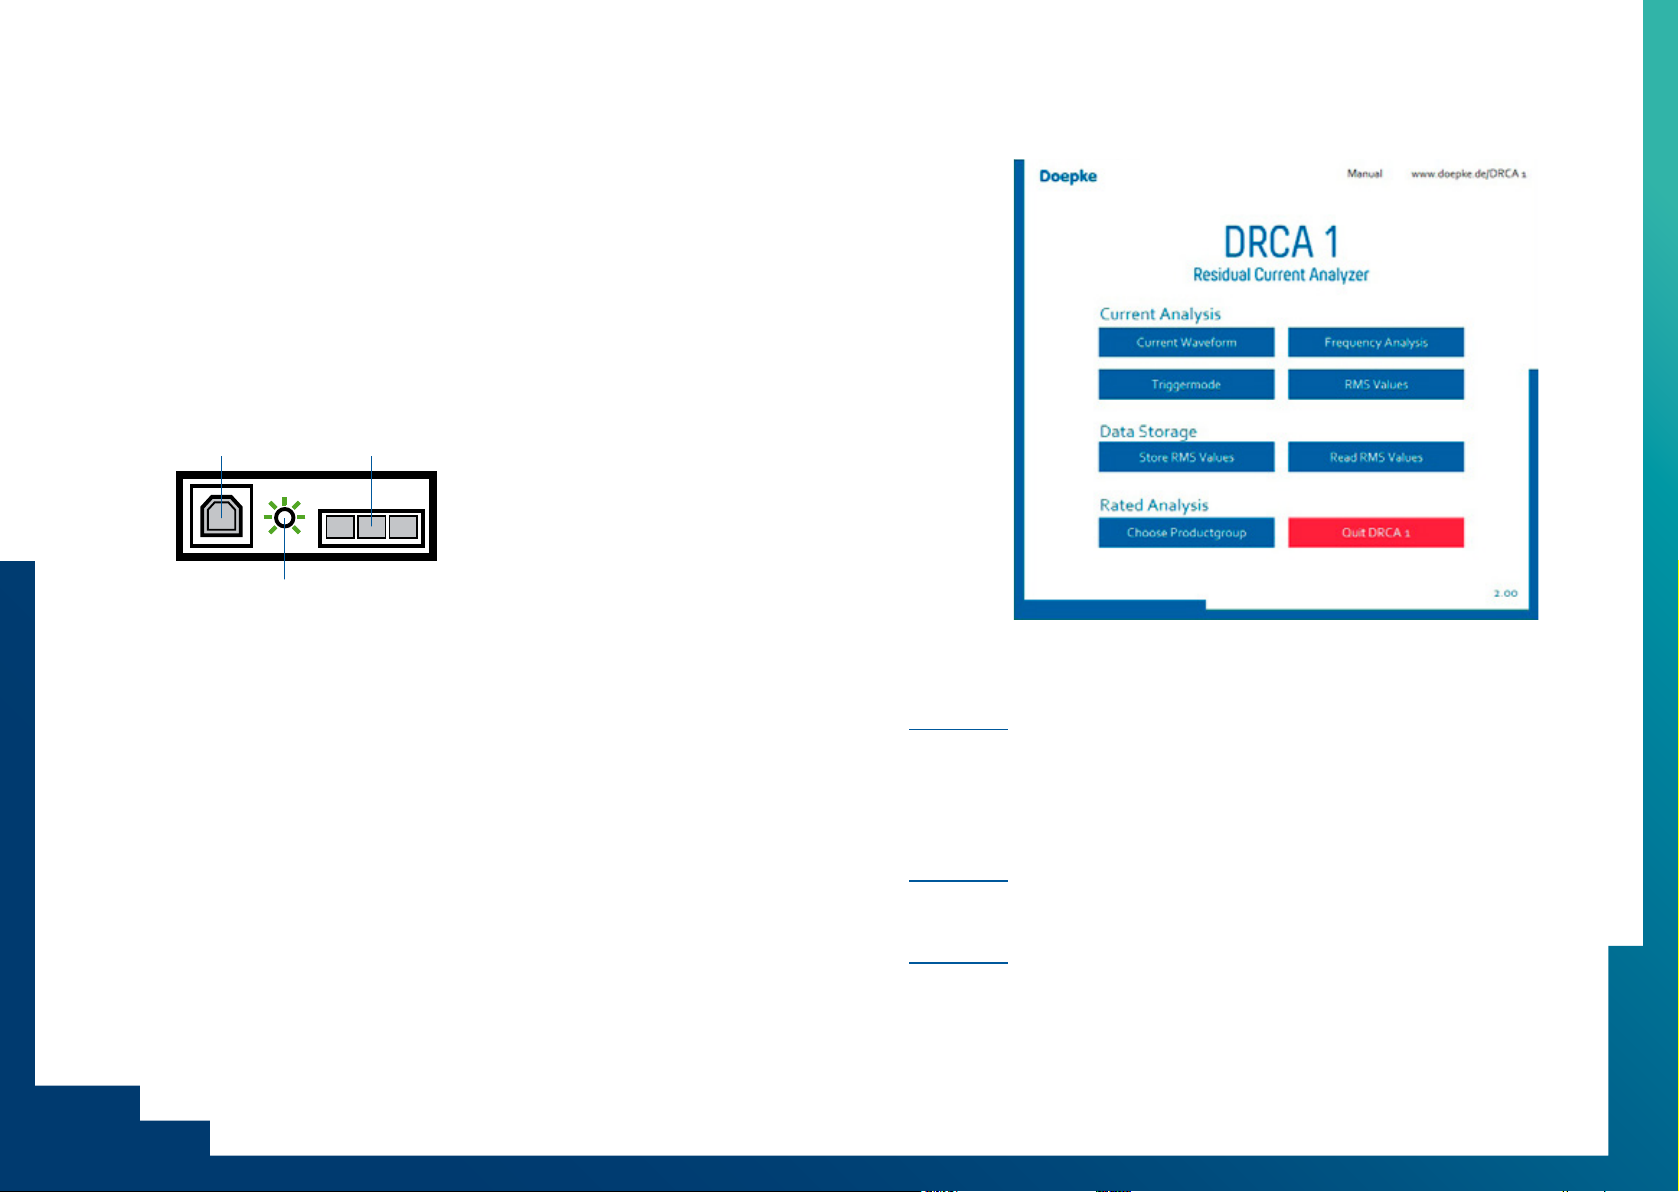
4. Mainmenu––––––––––––––––––––––––––––––––––––––––––––––––––––––––––––––––––––––––––––––––––––– page 9
5. Generalsignalanalysis
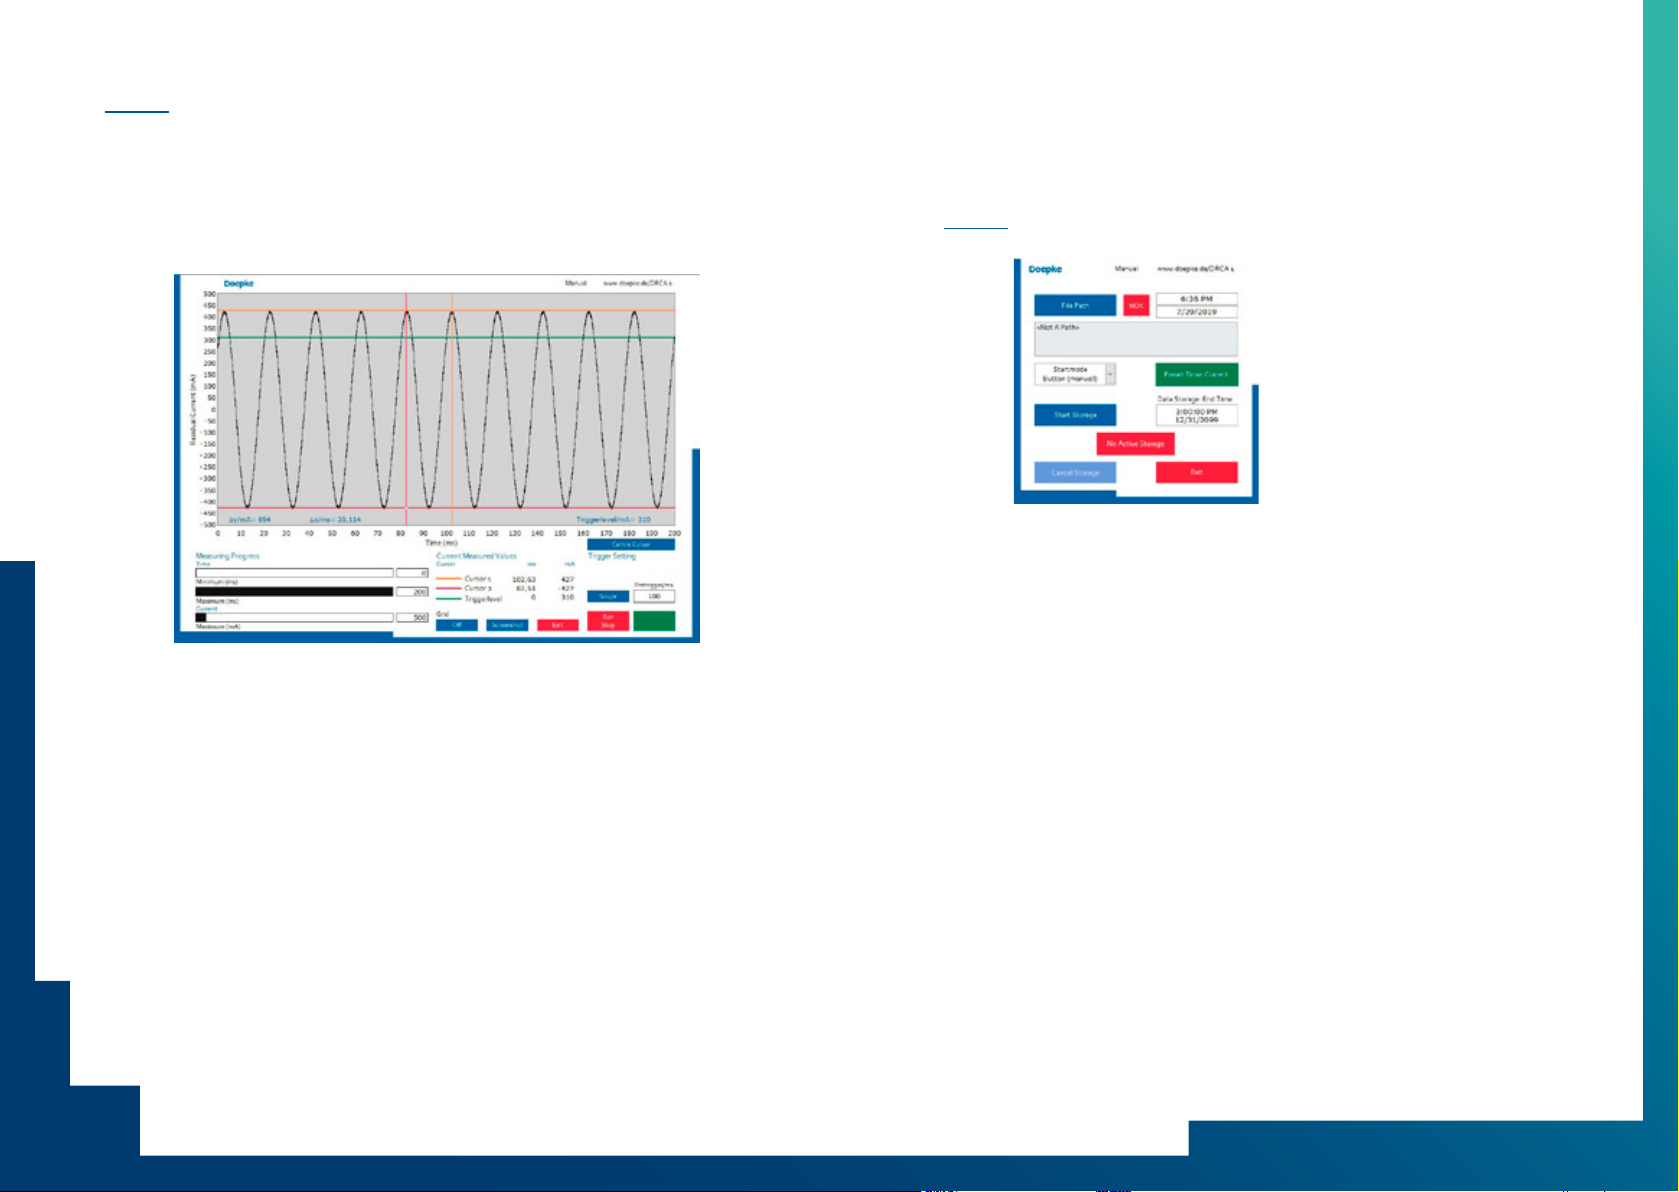
5.1 Current Waveform ––––––––––––––––––––––––––––––––––––––––––––––––––––––––––––––––––––––––––– page 10
5.2 RMS Values ––––––––––––––––––––––––––––––––––––––––––––––––––––––––––––––––––––––––––––––––––– page 11
5.3 Frequency Analysis ––––––––––––––––––––––––––––––––––––––––––––––––––––––––––––––––––––––––– page 12
5.4 Triggermode –––––––––––––––––––––––––––––––––––––––––––––––––––––––––––––––––––––––––––––––––– page 14
6. DataStorage
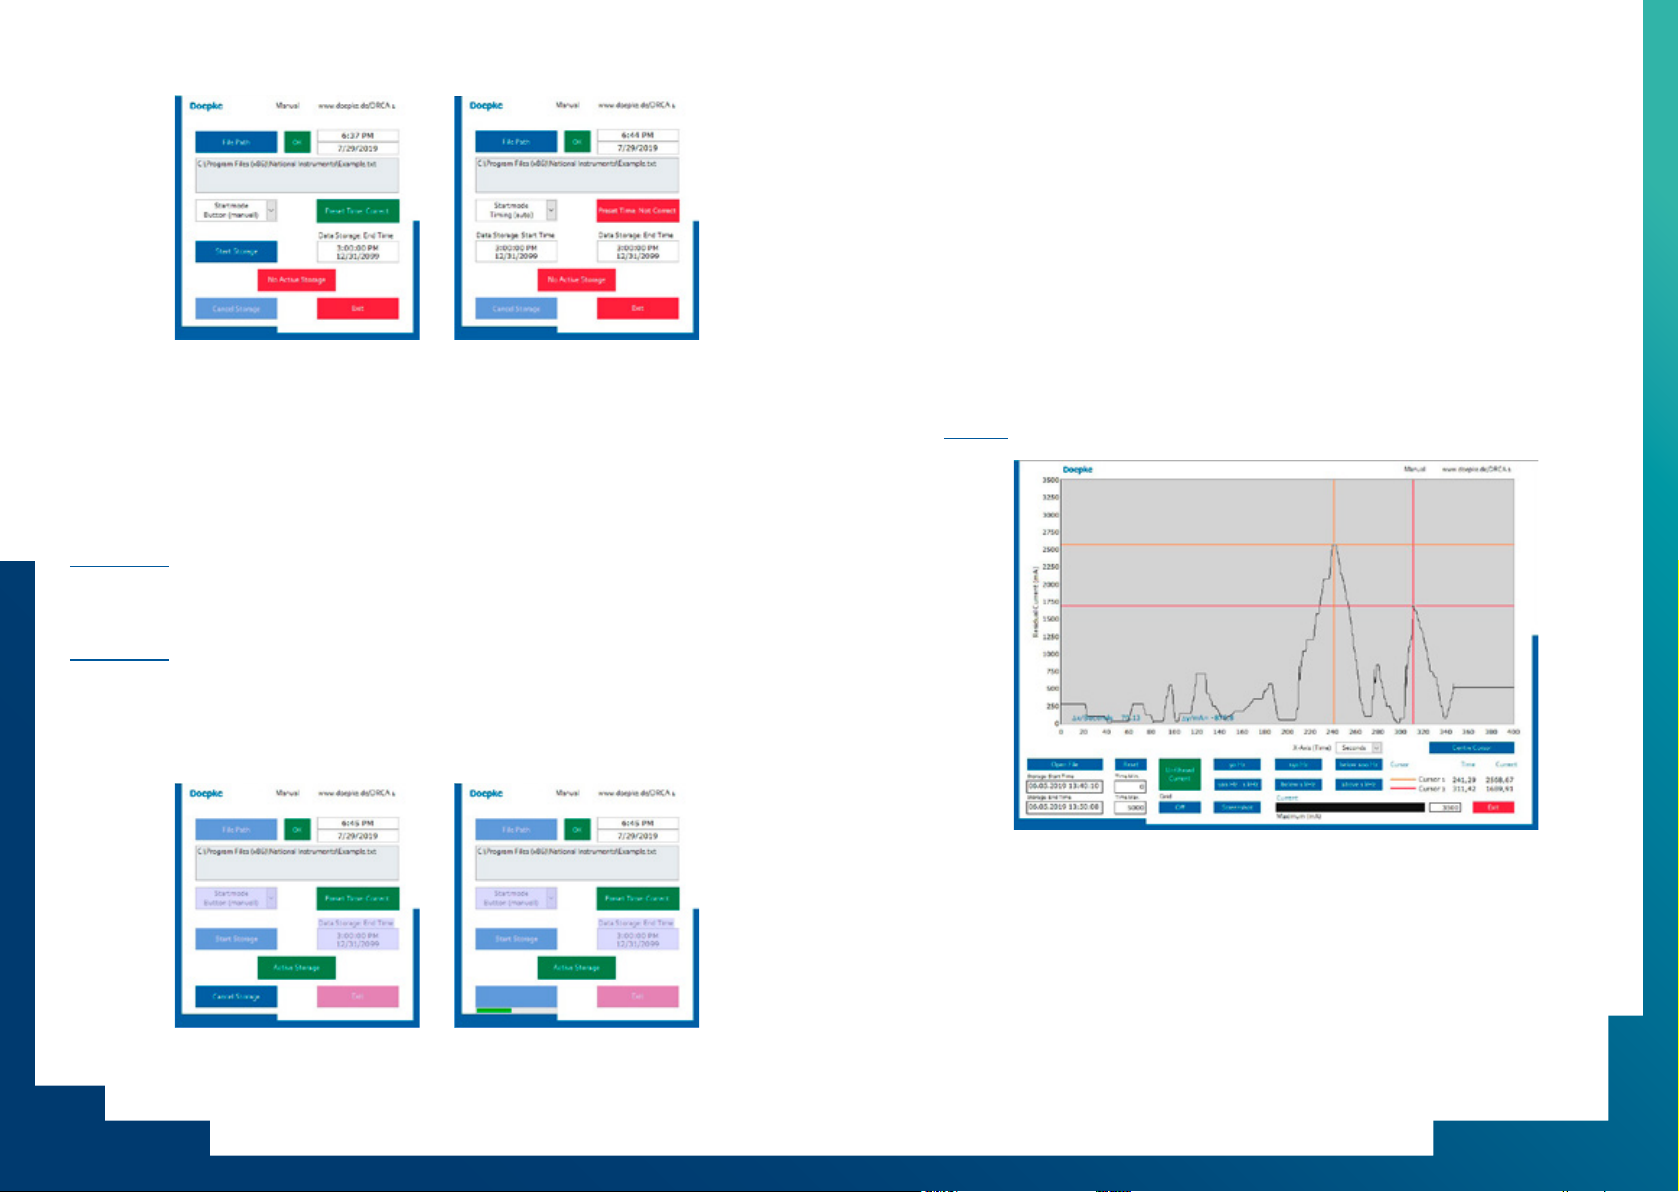
6.1 Store RMS Values –––––––––––––––––––––––––––––––––––––––––––––––––––––––––––––––––––––––––––– page 15
6.2 Read RMS Values ––––––––––––––––––––––––––––––––––––––––––––––––––––––––––––––––––––––––––––– page 17
7. RatedAnalysis
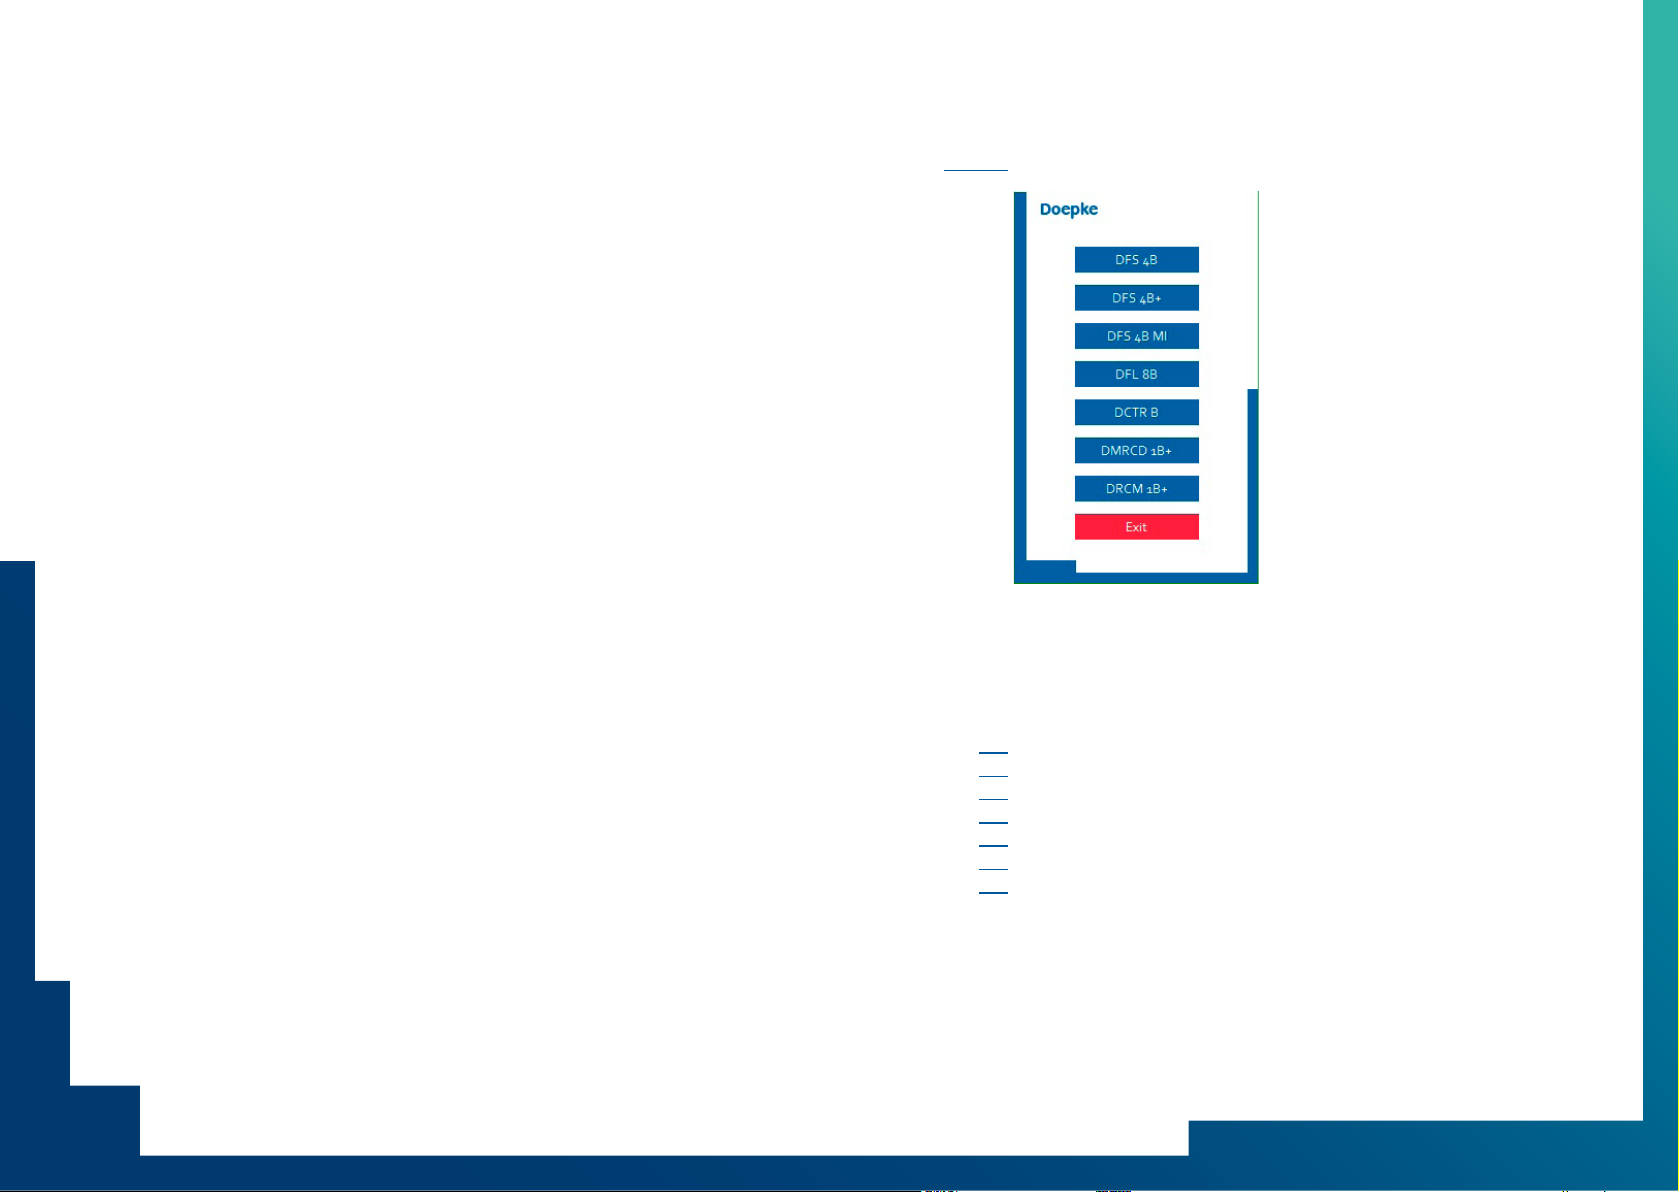
7.1 Choose Productgroup ––––––––––––––––––––––––––––––––––––––––––––––––––––––––––––––––––––––– page 19
7.2 Explanation of Rated Analysis ––––––––––––––––––––––––––––––––––––––––––––––––––––––––––––– page 20
7.3 Productgroup(usingtheexampleofDFS4B) –––––––––––––––––––––––––––––––––––––––––– page 21
7.4 Colour coding ––––––––––––––––––––––––––––––––––––––––––––––––––––––––––––––––––––––––––––––––– page 22
8. Notesandapplicationtips
8.1 Maximum frequency –––––––––––––––––––––––––––––––––––––––––––––––––––––––––––––––––––––––– page 22
8.2 Screen resolution –––––––––––––––––––––––––––––––––––––––––––––––––––––––––––––––––––––––––––– page 23
8.3 Crossover frequencies in the tripping current frequency response –––––––––––––––– page 23
8.4 Computer processor load –––––––––––––––––––––––––––––––––––––––––––––––––––––––––––––––––– page 23
8.5 Switch selection after RCD overview –––––––––––––––––––––––––––––––––––––––––––––––––––– page 23
9. Ratingdata
9.1 Supply voltage ––––––––––––––––––––––––––––––––––––––––––––––––––––––––––––––––––––––––––––––– page 24
9.2 Description of input connections ––––––––––––––––––––––––––––––––––––––––––––––––––––––––– page 24
9.3 Environmental conditions –––––––––––––––––––––––––––––––––––––––––––––––––––––––––––––––––– page 24
Content

THEDRCA1RESIDUALCURRENTANALYSISSYSTEM
6 / 7
2. Installation
Note ���������������� The software requires approximately 500 MB of free hard disk space.
The device must not be connected to start with. After executing the
program DRCA 1_Setup.exe, follow the further instructions in the
installation program. It will then prompt a restart, which is compulsory.
3. Connecting the device
Fig. 1: Schematic structure of the measuring system
1. TheDRCA1residualcurrentanalysissystem
1.1 Intendeduseofthedevice
The device is used exclusively for the measurement of residual
currents with the DRCA 1-CT residual current transformer intended
for this purpose. Load currents, e.g. motor currents, may not be
measured. The device may not be operated for measurement without
a transformer. If the measurement device is to be used to investigate
circuit-breaker, the residual current transformer must be electrically
installed where the residual current circuit-breaker is located. The
residual current transformer is to be permanently installed when the
distribution board is free from voltage. The DRCA 1-MC cable is to be
used for measurement. The installation of the transformer must only
Important:The device must only be used under the conditions and
for the purposes for which it was designed. Operational safety is not
use.
Scopeofdelivery
1 × installation USB stick DRCA 1 V2-SW
1 × measuring unit DRCA 1
1 × connection cable DRCA 1-MC
1 × transducer DRCA 1-CT 70
1 × USB cable
1 × manual/documentation

8 / 9
4. Main menu
Fig. 3: Main menu
The main menu is divided into three sections:
CurrentAnalysis
– Current Waveform (representation of the entire signal over time)
– Triggermode (determination of residual currents during switching
processes)
DataStorage
– Read RMS Values (display saved measurements)
RatedAnalysis
– Choose Productgroup (selection of Doepke products to be used
as basis for evaluation)
Note ���������������� The 'Quit DRCA 1' button closes the program and all previously opened
submenus. The results of Data Storage are retained.
When the distribution board is free from voltage, the DRCA 1-CT
series transformer is permanently installed in the distribution board
-
nected to the circuit directly after the residual current circuit-breaker.
The three phases and the neutral conductor must be guided through
the transformer. The transformer is then connected to the measuring
unit using the associated DRCA 1-MC measuring cable. The USB
connector of the measuring unit must be connected to a free USB
port on the computer.
The residual current circuit-breaker may need to be bypassed or
removed while the measurement is being carried out in order to
prevent it being tripped due to a false alarm during the measurement.
USB
power
DRCA1-CT
Fig. 2: Front view of measuring unit (schematic)
connectors for the USB cable and the DRCA 1-CT residual current
as soon as the device receives voltage via the USB connection.
MAINMENU

10 / 11
The 'Screenshot' button has been added for documentation purpos-
es. When this button is pressed, an image of the screen is saved. The
5.2 RMSValues
Fig. 5: RMS value display
RMS value display. The RMS of the measured current is displayed for
The display is provided in the form of a bar chart and a text display
of the exact value. The bar scaling is performed using the 'Display
are displayed.
overallsignal
cannot be changed
Standard values when opened;
can be freely selected by entry
Table 1: RMS value diagram bar chart
5. General signal analysis
5.1 CurrentWaveform
Fig. 4: Signal progression
The measuring signal is shown in terms of its progression over time.
The X and Y axes of the diagram can be scaled as desired. There
purpose. The setting is adjusted using the mouse via the slider or
by entering numbers on the keyboard. Two cursors can be seen in
the diagram. These can be moved freely over the graphs. The X and
Y positions of the cursor are displayed in the caption beneath the
are also additionally shown in the graphs themselves, as well as the
current is also displayed.
When scaling the current and time axis, the cursors retain their
position, which may mean that they are outside of the visible area.
The 'Centre cursors' button sets the positions of the cursors inside
the current image section. To improve readability, the signal can be
The signal will then no longer be updated.
GENERALSIGNALANALYSIS

12 / 13
5.3 FrequencyAnalysis
Fig. 6:
those set by the sliders. The display of the measurement result can
can be shown with either logarithmic or linear scaling. A coarse or
be selected using the four buttons 'Small Grid' and 'Main Grid'.
The two cursors can be moved freely over the graphs. The positions
of the cursors are shown in the caption. The graphs also contain
scaling, the cursors are outside of the visible area, they can be moved
back to the current image section using the 'Centre cursors' button.
If the 'Trigger' button is enabled, the display is only updated when
the residual current exceeds the set trigger level (blue cursor).
Note ���������������� If, for example, a trigger level of 300 mA is set and enabled, a residual
current of 200 mA would no longer be displayed. In order to avoid
erroneous measurement, the trigger is therefore disabled by default.
Fig. 7: Menu hidden Fig. 8: Menu visible
If the mouse pointer is moved to the 'Characteristic curves of AC-DC
sensitive products' bar, a further menu will open.
Here, a model can be selected from the product groups
DFS 4 B
DFS 4 B+
DFS 4 B MI
DFL 8 B
DCTR B
DMRCD 1 B+
DRCM 1 B+
response of which is then shown in the diagram. The product which
is currently selected is shown beneath the graphs. By moving the
mouse pointer to the right-hand bar in the characteristic curve menu,
this menu will be hidden, the characteristic curve remains in the
graphs until 'no characteristic curve' is selected.
GENERALSIGNALANALYSIS

14 / 15
5.4 Triggermode
The 'Trigger' module was developed to enable recording of switch-on
have steep edges cannot be recognised in other programs, as they
either cease to exist in the overall RMS of a sampling or are not visible
due to their short duration.
Fig. 9: Trigger mode
There are three sliders in the program, which can be used to scale the
current and time axis. The green cursor is not used for display here,
but rather for operation. The cursor forms the trigger level. If 'Run/
Stop' is now switched to 'Run' (green) and the trigger LED lights up
(green), the signal will be continuously updated.
If the trigger level is changed and is greater than the highest signal
Stop' set to 'Stop' (red), the updating can be stopped manually.
Single mode shows a signal section of 200 ms, as soon as the trigger
shall be stored before the trigger event can be set from 0–120 ms.
The 'Centre Cursor' button sets the level to 0 and the display cursor
to the centre.
6. Data Storage
In addition to the values shown in chapter 5.2 ('RMS value diagram'),
the peak value determined in each measurement cycle is also saved.
6.1 StoreRMSValues
Fig. 10: Recording of measured values after the program has been opened
save location' are disabled. The current date and time are displayed
at the top of the program. This corresponds to the time details set on
the computer.
Before a measurement can be started, the save location for the meas-
the previously blocked operating elements are made available.
DATA STORAGE

16 / 17
As soon as the measurement is started, all elements are blocked
to the user, except for 'Cancel Storage'. The measurement ends
automatically once the 'Measurement end time' is reached, although
it can be ended before this using 'Early termination'. Data recorded
up to this point is saved. The remaining memory time is indicated by
a progress bar. This process can take up to 20 seconds. The recorded
-
-
dure ensures that not all of the data is lost in the event of a computer
crash.
6.2 ReadRMSValues
Fig. 15: Read RMS Values
Previously recorded measured values can be easily displayed using
*.txt which contain correct measurement data can be read.
the user will be informed accordingly.
Fig. 11: Manual recording of measured values Fig. 12: Automatic recording of measured values
measurements should be taken manually or started automatically at
a particular time. The measurement can, however, only begin once
a correct time setting has been displayed by the program: Times in
the past and end times that are earlier than the start time for the
measurements cannot be accepted.
ManualStartmode(button)
If the setting is correct, the measurement can be activated using
'Start measurement'.
AutomaticStartmode(speciedtime)
If the time setting is correct, the measurement starts automatically
as soon as the set 'Measurement start time' is reached.
Fig. 13: Active measurements Fig. 14: Abort active measurements
DATA STORAGE

18 / 19
The progression of RMS values across the entire time period is now
shown. The beginning and end of the measurements is indicated
beneath the diagram. The X-axis of the graphs shows the time
elapsed since the start of measurements. This is set to seconds by
default when opened, but can be changed to minutes and hours using
the button in the axis label.
seen whether and to what extent signal components were present in
currently selected area is highlighted in green.
observation of a period, also be individually adjusted, but only via the
and 'Max. time', a particular time range can be shown in more detail.
Using the 'Reset' button, the values 0 to maximum measurement
duration are restored.
The cursors and cursor caption have the same properties as in chapter
5.1 ('Signal progression'). It is also possible to take screenshots at this
stage. It is always the visible area that is recorded, so that images can
7. Rated Analysis
7.1 ChooseProductgroup
Fig. 16: Product group overview menu
By selecting 'Product group selection' in the main menu,
an overview menu opens.
The product groups
DFS 4 B
DFS 4 B+
DFS 4 B MI
DFL 8 B
DCTR B
DMRCD 1 B+
DRCM 1 B+
produced by Doepke Schaltgeräte GmbH are available,
which can measure the residual current to be evaluated.
As the program operation for each product group is identical,
the function is explained using one selected group (DFS 4 B).
There follows a brief explanation of why an evaluated analysis
is actually necessary.
RATEDANALYSIS

20 / 21
7.3 Productgroup(usingtheexampleofDFS4B)
Fig. 18: Overview DFS 4 B
In this view, the viewing window is divided into two areas. In the
left-hand part of the image, there is an overview of all designs in the
selected product group. For each type it is shown at what percentage
-
here, but instead relative values in relation to the tripping current
Explanation ���� A DFS 4 B 30 mA NK trips at 50 Hz/30 mA. From this it follows that, at
50 Hz, a residual current would represent a peak of 100% in the diagram.
If, at 30 mA, there is a frequency of 20 kHz, this would represent a load
of 10%, since the DFS 4 B NK only trips at 300 mA or above at 20 kHz.
The product to which the diagram relates can be determined using
types.
7.2 ExplanationofRatedAnalysis
AC-DC sensitive residual current circuit-breakers evaluate current
Further information on this topic can also be found in Doepke's
brochure: 'AC-DC sensitive residual current devices: RCD Type B'.
Fig. 17:
-
residual currents. The bars represent the range in which the switches
must trip. In order to evaluate the tripping current, the middle of
these ranges is used in the software for the respective type.
RATEDANALYSIS

22 / 23
8.2 Screenresolution
768 pixels. The windows can be scaled up/down, but the displays
screen, regardless of resolution, and can then be moved as desired.
8.3 Crossoverfrequenciesinthetrippingcurrentfrequencyresponse
As already indicated in chapter 7 ('Evaluated signal analysis'), the
three characteristic ranges. Initially, the tripping current remains
identical, then increases by 20 dB per decade and then remains the
-
the signals are no longer one hundred-percent synchronous, which,
enlarges or reduces the resulting signal to some extent. The bars of
the percentage display, however, always shows the correct value and
is therefore to be given preference.
8.4 Computerprocessorload
If several programs are open at the same time, interruptions may
occur during the measurement.
8.5 SwitchselectionafterRCDoverview
The RCD overview shows snapshots and not an evaluation of longer-
term measurements: If the product group overview is considered,
only a small part of the tripping current may be displayed, for
example. If this exact device is now installed, it can nevertheless
be tripped by leakage currents if non-measured system statuses or
unforeseeable switching processes occur.
7.4 Colourcoding
Display Evaluation
greater
than 74%
(red)
high load,
restricted availability
or operational safety
50% to 74%
(yellow)
elevated load,
insecure availability
0% to 49%
(green)
low to no load,
high availability
Table 2:
For a better overview, the values are colour-coded according
to the tripping threshold reached.
8. Notesandapplicationtips
8.1 Maximumfrequency
of a signal that is continuous over time. The DRCA 1 uses a sampling
-
cy are recorded with reduced amplitude and altered signal form, as
-
cies in the display to some extent.
NOTESANDAPPLICATIONTIPS
DFS 4 B+ 30 mA
DFS 4 B+ 100 mA
DFS 4 B+ 300 mA

24 / 25
9.7 Residualcurrentinput
The maximum rated residual current that can be measured with
the transformer is a peak value of 10 A. For the measuring unit
a maximum rated current of 10 mA applies (secondary current transformer).
9.8 Symbols
The safety symbol on the transformer connections indicates a general
labelled in this way.
9.9 Cleaningandconsumablematerials
There are no consumable materials, which means that no mainte-
nance intervals have to be complied with for their replacement.
9.10 Operationalsafety
If the device is not used in accordance with the manufacturer's
operating instructions, the intended protection may be impaired.
Operational safety will no longer be guaranteed.
9.11 Maintenance
9.12 Warranty
All professionally installed, unaltered devices are covered by warranty
during the statutory warranty period from the day of purchase by the
end user. The guarantee is not applicable to damage incurred during
transport or caused by short-circuit, overloading or improper use.
In the event of defects in workmanship or material being discovered
within the warranty period, the company will provide repair or
replacement free of charge. The warranty will be rendered null and
void if the device is opened without authorisation.
9.13 Measurementcategory
The device corresponds to measurement category I
(measurements in circuits not directly connected to the mains).
Warning:The device must not be used in measurement categories II, III
and IV. Protection and operational safety will no longer be guaranteed.
9.14 Firmwareandupdates
can be found on our website, www.doepke.de.
9. Rating data
9.1 Supplyvoltage
The power supply is provided via +5 V (USB).
9.2 Descriptionofinputconnections
The USB cable, which is connected to the PC/notebook, is connected
via a USB socket. The transformer is connected to the DRCA 1-CT
socket with the supplied DRCA 1-MC measuring cable.
9.3 Environmentalconditions
Pollution degree 2: The device must only be used indoors.
Temperature range: 0 °C to 45 °C
Humidity: max. 90% rel. humidity. Condensation not permitted.
Max. permitted height above sea level: 2000 m
9.4 Installationrequirements
selection of installation location and installation:
All installation work relating to the residual current transformer must
The residual current transformer must be added to the circuit at the point
at which the residual current circuit-breaker is or will in future be located.
For the measurement, the transformer must be permanently installed
in the distribution board.
The residual current transformer is connected to the measurement device
using the DRCA 1-CT measuring cable.
Only residual currents may be measured, not load currents
such as individual phases of a motor.
9.5 Connectiontothepowersupply
The measurement device is connected to the computer using
a USB cable (plug type A to plug type B).
9.6 Ventilationandcooling
to ventilation or cooling.
RATINGDATA

26 / 27
DRCA1-CTtransducer
Rated current DRCA 1-CT 70 200 A
DRCA 1-CT 105 250 A
DRCA 1-CT 140 350 A
DRCA1measuringunit
The device was manufactured
(VDE 0411 Part 1): 2002-08
control and laboratory use'.
Note ���������������� With the rated currents stated above, a maximum measurement error
of 10 mA can be expected with a centred line structure for the primary
load current. This error is the result of asymmetrical currents within the
transformer core material.
DRCA1-SWsoftware
Operating system Windows 7 SP1 or higher
500 MB free hard disk storage
10.1 Productoverview/Articlenumbers
DRCA 1 set 09 352 050
consisting of:
DRCA 1 09 352 051
DRCA 1-CT 70 09 352 052
DRCA 1-MC 09 352 053
DRCA 1-SW 09 352 054
10. Technical data
DRCA1measuringunit
Rated voltage +5 V (USB)
Wiring USB cable
Sampling rate
Damping
Measuring range AC: up to 10 A peak-to-peak value,
DC: not measurable
Accuracy when I = 100 mA
when residual current I = 100 mA
Resolution 0.2 mA
Pollution degree 2 (for indoor use only)
Operating temperature range 0 °C to 45 °C
Storage temperature range -20°C to 70°C
Resistance to climatic changes max. 90% rel. humidity,
condensation not permitted
Operating altitude max. 2000 m above sea level
Dimensions 250 mm × 160 mm × 40 mm
(L × W x D)
Weight 0.85 kg
Positioning optional
Measurement category
I
(please note: the device must
not be used in measurement
categories II, III and IV)
TECHNICALDATA

|
Doepke Schaltgeräte GmbH
Stellmacherstraße 11
@----------------- [email protected]
T ----------------- +49 (0) 49 31 18 06-0
F ----------------- +49 (0) 49 31 18 06-101
www-------- doepke.de
Doepke
Table of contents