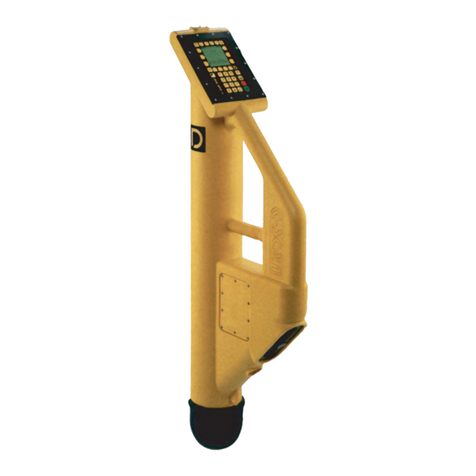
Dynalog C-SCAN 2000 Series User guide

www.dynalog.co.uk
SYSTEM MANUAL
Dynalog Electronics Limited
Bristol, England
For Model 2010

Dynalog Software
Please read Licence Agreement overleaf before installing
Contents of Applications CD
The programs listed below are available on the Applications CD provided with
your C-SCAN Survey System. To install any of the applications or print a copy
of this manual, place the CD in your drive and the installer should autorun
index.html in your default web browser. If Autorun fails to start, open the CD
content from My Computer and double click ‘index.html’. Each program can be
installed from the suite menu.
DCAPP GE
This is the software needed to download data from a C-SCAN 2010. Folders
created on root drive:
\DCAPP2010
\DCAPP2010\archive\
\DCAPP2010\archive\original
C-SCAN Manual
Electronic copy of the manual in Adobe* PDF format. You must have Adobe
Acrobat* installed to view the manual.
C-SCAN Updater
This program updates the C-SCAN firmware in the Detector head unit. If you
are sent an upgrade file, this is the program to use to update your Detector.
Should you be sent an update, all instructions for use will be included with the
upgrade.
C-SCAN Diagnostics
This program will communicate with the C-SCAN Detector to provide status
information on various sub-systems to assist in problem diagnosis.
*Adobe and Acrobat are copyright Adobe Corporation
**Windows and Excel are copyright Microsoft Corporation
***Google Earth is copyright Google Inc

DYNALOG LICENCE AGREEMENT
IMPORTANT: These products are supplied to you on the terms and conditions of the licence agreement indicated below. If you proceed to install these products you will
be deemed to have accepted of these terms and conditions. If such terms and conditions are not accepted by you, do not install the product. The programs in the
provided Suite are subject to this licence agreement – namely DCAPP GE, DCAPP 2010, DCAPP for Excel, C-SCAN Upgrader, C-SCAN Diagnostics and C-SCAN
Manuals.
In this licence:
'DYNALOG' means DYNALOG ELECTRONICS Ltd; and
The 'Program' means the program or programs and online documentation that are about to be installed. The Purchaser does not hereby acquire any rights of
ownership in the Program.
The 'Product' means the device or devices that the program is designed to connect to.
1. COPYRIGHT
The copyright and all other intellectual property rights in the Program shall be and remain vested in DYNALOG.
DYNALOG grants to the Purchaser of this package a non-exclusive right to use the Program in accordance with these terms and conditions. Such Licence may be
transferred only in accordance with Clause 3 below.
Any other use or dealing not expressly authorised by these terms and conditions is strictly prohibited.
2. USE
The Program may only be used on a single machine or terminal at any one time but may be copied in support of that use. Any such copying is subject to there being no
modification of the Program and in particular to all the copyright notices being preserved in the copy. Save for copying as aforesaid, any other operations (including
subdivision, modification, decompiling, reverse-engineering or translation from machine readable form) are expressly prohibited.
Only a single copy of the Program is licensed for use at any one time. Where the Purchaser wishes to use multiple copies of the Program on different machines or
terminals, application should be made in writing to DYNALOG which will be considered in its discretion.
Where multiple copies of the Program are provided, this is for convenience of use only, it does not imply multiple licences.
3. TRANSFER
The Program may be transferred to a third party provided the original and all copies are transferred or otherwise destroyed and provided further these terms and
conditions are produced to that third party and prior to the transfer that party agrees and undertakes to observe and continue to observe the same.
Without such transfer and undertaking any application of the Program or copies thereof by any other person will not be authorised by DYNALOG and will be in breach of
DYNALOG's copyright and other proprietary rights.
4. DOCUMENTATION
The copyright and all other intellectual property rights in the documentation accompanying the Program shall be and remain vested in DYNALOG. However, no right to
reproduce that documentation in part or in whole is granted by DYNALOG. Should additional copies of the documentation be required for whatever reason, application
must be made in writing to DYNALOG which will be considered in its discretion.
5. BREACH
If the Purchaser acts in breach of any of these terms and conditions it shall indemnify DYNALOG against all loss suffered (including loss of profits) and the licence
granted hereunder shall be deemed to be terminated forthwith. DYNALOG may also terminate the licence hereby granted without notice if the Purchaser declares itself
bankrupt or, in the case of a business customer only, if it shall cease to carry on its business or shall have a liquidator, receiver or administrative receiver appointed to it
or over any part of its undertaking or assets or shall pass a resolution for its winding up (otherwise than for the purpose of a bona fide scheme of solvent amalgamation
or reconstruction where the resulting entity shall assume all of the liabilities of it) or a court of competent jurisdiction shall make an order, or shall enter into any
voluntary arrangement with its creditors, or shall be unable to pay its debts as they fall due.
On termination the Purchaser shall cease using the Program and deliver up to DYNALOG all infringing and lawful copies of the Program within seven days of
termination of the licence hereby granted.
6. EXCLUSIONS
Neither DYNALOG nor any person authorised by it gives warranties or makes representations that the Program is error free or will meet functions required by the
Purchaser. It shall be the responsibility of the Purchaser to satisfy itself that the Program meets the Purchaser's requirements.
The Program is supplied on an 'as is' basis and save as expressly provided in these conditions all warranties of any nature (and whether express or implied) are
excluded.
7. LIABILITY
7.1 DYNALOG warrants that any physical media on which the Program is stored are free from material defect and through normal use will remain so for a period of 90
days after purchase. This warranty excludes defects arising out of accident, neglect, misuse, failure of electric power or causes other than ordinary use. In the event of
any breach of this warranty (or statutory warranty or conditions incapable of exclusion by these conditions) the responsibilities of DYNALOG shall be limited to replacing
the enclosed Program or to returning the price paid as DYNALOG may in its absolute discretion determine. In the event of a refund, Purchaser's right to use the
Program shall automatically expire.
7.2 The aggregate liability of DYNALOG in respect of any loss or damage suffered by the Purchaser and arising out of or in connection with this Agreement, whether in
contract, tort (including negligence) or for breach of statutory duty or in any other way shall not exceed the price paid for the Program.
7.3 DYNALOG shall not be liable, in contract, tort (including negligence) or for breach of statutory duty or in any other way for:
7.3.1 any economic losses (including, without limitation, loss of revenues, profits, contracts, business or anticipated savings); or
7.3.2 any loss of goodwill or reputation; or
7.3.3 any special or indirect or consequential losses
in any case whether or not such losses were advised to DYNALOG or its dealer, suffered or incurred by the Purchaser arising out of or in connection with the use by the
Purchaser of the Program, or any other matter under this Agreement.
8. MISCELLANEOUS
8.1 The Purchaser confirms that, in agreeing to enter into this Agreement, it has not relied on any representation save insofar as the same has expressly in this
Agreement been made a representation and agrees that it shall have no remedy in respect of any misrepresentation which has not become a term of this Agreement
save that the agreement of the Purchaser contained in this clause shall not apply in respect of any fraudulent or negligent misrepresentation whether or not such has
become a term of this Agreement.
8.2 This Agreement shall be governed by and construed in accordance with the laws of England and Wales. The Purchaser hereby irrevocably submits to the non-
exclusive jurisdiction of the English courts in respect of any dispute or matter arising out of or in connection with this Agreement.
8.3 The Purchaser agrees to supply vehicle statistics (excluding vehicle and personal specific data) via electronic transfer on subsequent calibration of the product.
Leaders in Pipeline Survey Systems
C
C
C-
-
-S
S
SC
C
CA
A
AN
N
N
2
2
20
0
01
1
10
0
0
SYSTEM MANUAL Version 6.03i
1
C-SCAN SURVEY MANUAL
PREFACE
This manual explains the operation of the C-SCAN System for surveying the condition of
the wrap or coating on buried metal pipelines, and locating faults in the wrap. It is
intended for the use of surveyors with some experience of the survey and maintenance
of pipelines
While the C-SCAN equipment is reasonably robust and weatherproof, it contains delicate
electronic components and should be handled with appropriate care and it should be
transported in its specially designed soft cases or otherwise protected from major
shocks. The C-SCAN Detector Unit can also be damaged by exposure to some forms of
radiation and to static electricity. Maintenance of this equipment should only be carried
out by qualified personnel.
The material contained in this Manual is copyrighted by Dynalog Electronics Ltd, and is
not to be photocopied, duplicated, or reproduced in any form without the express
written consent of Dynalog Electronics Ltd.
Publication in this manual of information on the design and operation of the C-SCAN
System does not confer any rights to use this information other than for the purpose of
operating C-SCAN equipment supplied by Dynalog Electronics Ltd.
Dynalog reserves the right to make improvements in its products without incurring any
obligation to incorporate such improvements into products already sold.
Specifications, instructions, and other information contained in this Manual are subject
to change without notice.
Before any setup work or survey work is undertaken, these instructions must be read and
fully understood by the operators who will carry out the survey work using this
equipment.
Any comments, queries or suggestions concerning this manual
should be sent to :
Dynalog Electronics Limited
PO Box 1073 | Bristol | BS15 0DW | United Kingdom
web: www.dynalog.co.uk
Issue 6-03i – 1601 E&OE
For firmware versions 4.10 or higher
United Kingdom Health & Safety at Work Act 1974
Section 6 (a) of this Act requires manufacturers to advise their customers
on the safety and handling precautions to be observed when installing, operating,
maintaining and servicing their products.
The user’s attention is therefore drawn to the following:
1. The appropriate sections of this manual must be read carefully before using the equipment.
2. Operation and maintenance must only be carried out by suitably trained personnel.
3. Normal safety precautions must be taken and appropriate procedures observed to avoid accidents
Refer to the equipment suppliers — name and address below — for any technical advice or
product information

Leaders in Pipeline Survey Systems
C
C
C-
-
-S
S
SC
C
CA
A
AN
N
N
2
2
20
0
01
1
10
0
0
SYSTEM MANUAL Version 6.03i
2
1. OUTLINE OF THE C-SCAN SYSTEM....................................................................... 7
1.1. Signal Generator ................................................................................................... 7
1.2. Detector Unit ......................................................................................................... 8
2. UNPACKING AND ACTIVATING THE C-SCAN 2010 SURVEY SYSTEM .............. 9
2.1. Unpacking.............................................................................................................. 9
2.2. Charging the Signal Generator ............................................................................ 9
2.3. Signal Generator External Power ...................................................................... 11
2.4. Charging the Detector Unit ................................................................................ 11
3. OVERVIEW .............................................................................................................. 15
3.1. Signal Generator – Keypad ................................................................................ 15
3.2. Signal Generator – Display ................................................................................ 15
3.3. Signal Generator – Side Panel ........................................................................... 16
3.4. Detector Unit – Front Panel................................................................................ 16
3.5. Detector Unit – Display....................................................................................... 17
3.5.1. LCD Contrast.................................................................................................... 18
3.5.2. LCD Backlight .................................................................................................. 18
3.6. Detector Unit – Keypad....................................................................................... 18
4. SIGNAL GENERATOR - FIELD OPERATIONS ..................................................... 19
4.1. Operating Environments .................................................................................... 19
4.2. Survey Information ............................................................................................. 19
4.3. Connection to Pipeline ....................................................................................... 19
4.3.1. Location of Injection Point.............................................................................. 19
4.3.2. Check Pipeline ................................................................................................. 19
4.3.3. Signal Interference .......................................................................................... 20
4.4. Connection Methods........................................................................................... 20
4.5. Setting the Signal Current.................................................................................. 22
4.6. Pipeline Voltage message.................................................................................. 23
4.7. Automatic level adjustment ............................................................................... 23
4.8. Apparent Problems with Current Value ............................................................ 24
4.9. Key Sequence for AUTO Operation................................................................... 25
4.10. Key sequence for MANUAL operation .............................................................. 26
5. DETECTOR UNIT – PRINCIPAL DISPLAY SCREENS.......................................... 27
5.1. Start-up Screen ................................................................................................... 27
5.2. Pipeline Specification Screen............................................................................ 27
5.3. Search Screen ..................................................................................................... 28
5.4. Menu Screen........................................................................................................ 29
5.5. Survey Screens ................................................................................................... 30

Leaders in Pipeline Survey Systems
C
C
C-
-
-S
S
SC
C
CA
A
AN
N
N
2
2
20
0
01
1
10
0
0
SYSTEM MANUAL Version 6.03i
3
6. DETECTOR UNIT – FIELD OPERATIONS ............................................................. 31
6.1. Operating Environment ...................................................................................... 31
6.2. Survey Principles ................................................................................................ 31
6.2.1. Survey Type ..................................................................................................... 31
6.2.2. Survey Procedure Overview ........................................................................... 32
6.3. Survey Planning .................................................................................................. 32
6.3.1. Preparation....................................................................................................... 32
6.3.2. Planning............................................................................................................ 33
6.3.3. Common Fault Areas....................................................................................... 33
6.3.4. Reference Readings ........................................................................................ 33
6.4. Survey Procedure ............................................................................................... 33
6.4.1. Signal Injection ................................................................................................ 33
6.4.2. Locate Pipeline ................................................................................................ 33
6.4.3. Locate Overhead.............................................................................................. 34
6.4.4. Record Sample................................................................................................. 34
6.4.5. Subsequent Samples ...................................................................................... 36
6.4.6. Entering Distance ............................................................................................ 37
6.4.7. Graphs .............................................................................................................. 38
6.4.8. Low Signal........................................................................................................ 39
6.4.9. Move Generator ............................................................................................... 39
6.5. Survey Numbering & Memory Storage ............................................................. 39
6.6. Notes on Entering Distances ............................................................................. 40
6.7. Chainage.............................................................................................................. 40
6.8. Fault Location ..................................................................................................... 42
6.8.1. Closer Inspection............................................................................................. 42
6.8.2. Close Interval Mode......................................................................................... 43
7. SURVEY PLANNING AND INTERPRETATION OF RESULTS.............................. 47
7.1. Distance Between Survey Points ...................................................................... 47
7.2. Attenuation Values.............................................................................................. 47
7.3. Conductance ....................................................................................................... 48
7.4. Signal Range ....................................................................................................... 50
7.5. Fault Size ............................................................................................................. 50
7.6. Minimum Distance Between Survey Points...................................................... 51
7.7. Reading Accuracy............................................................................................... 51
7.8. Close Interval Surveys........................................................................................ 51
7.9. Repeat Surveys ................................................................................................... 51
7.10. Long Term Program............................................................................................ 52
7.11. High Soil Resistivities ........................................................................................ 52
7.12. Changes in Soil Resistivity ................................................................................ 53

Leaders in Pipeline Survey Systems
C
C
C-
-
-S
S
SC
C
CA
A
AN
N
N
2
2
20
0
01
1
10
0
0
SYSTEM MANUAL Version 6.03i
4
7.13. New Pipelines...................................................................................................... 53
8. INTERFERENCE AND FIELD DISTORTION .......................................................... 54
8.1. The C-SCAN Signal............................................................................................. 54
8.2. Ground Lead Interference .................................................................................. 54
8.3. Other Signals Carried by the Pipeline............................................................... 54
8.4. Buried Metal Structures...................................................................................... 54
8.5. Cross Bonds........................................................................................................ 55
8.6. Insulating Joints/Flanges................................................................................... 55
8.7. Sacrificial Anodes............................................................................................... 57
8.8. Pipeline Bends and ‘Tees’.................................................................................. 57
8.9. Sleeves................................................................................................................. 57
8.10. Effects of ‘Return Current’ ................................................................................. 57
8.11. Orientation of Detector to Pipe Axis ................................................................. 58
9. EXAMPLES.............................................................................................................. 59
9.1. Example 1 ............................................................................................................ 59
9.2. Example 2 ............................................................................................................ 60
10. DEMO MODE........................................................................................................... 61
11. DCAPP..................................................................................................................... 63
11.1. Additional windows ............................................................................................ 64
11.1.1. Pipeline layout .............................................................................................. 64
11.1.2. Table View ..................................................................................................... 64
11.1.3. Pipeline Details ............................................................................................. 66
11.2. How to download from C-SCAN ........................................................................ 67
11.3. Saving, Printing & Exporting ............................................................................. 68
11.3.1. Saving............................................................................................................ 68
11.3.2. Printing .......................................................................................................... 68
11.3.3. Exporting....................................................................................................... 68
11.4. Advanced Functions........................................................................................... 69
11.4.1. Tools Menu.................................................................................................... 69
11.4.2. GPS Functions.............................................................................................. 70
11.4.3. Auto Analyse................................................................................................. 71
11.4.4. Data Manipulation......................................................................................... 71
11.4.5. Show Close Interval Plots............................................................................ 71
11.5. Clearing the Detector Memory ........................................................................... 72
12. GPS.......................................................................................................................... 72
12.1. GPS Setup ........................................................................................................... 73
12.2. External GPS Configuration............................................................................... 73
12.3. GPS Reset............................................................................................................ 74

Leaders in Pipeline Survey Systems
C
C
C-
-
-S
S
SC
C
CA
A
AN
N
N
2
2
20
0
01
1
10
0
0
SYSTEM MANUAL Version 6.03i
5
12.4. Geo-fencing ......................................................................................................... 74
13. BATTERY INFORMATION ...................................................................................... 74
13.1. Battery Life .......................................................................................................... 74
13.2. Battery Indicator.................................................................................................. 76
13.3. Power Modes....................................................................................................... 76
14. UPGRADING ........................................................................................................... 76
15. DIAGNOSTICS ........................................................................................................ 77
16. FAQ / NOTES .......................................................................................................... 79
16.1. TR Stations – The need to disconnect .............................................................. 79
16.2. Generator Connection Problems....................................................................... 79
16.2.1. Connecting to the Pipeline .......................................................................... 80
16.2.2. Establishing a good earth............................................................................ 80
16.2.3. Use alternative earth connection ................................................................ 80
16.3. Re-call Calibration Settings ............................................................................... 81
16.4. Display Messages ............................................................................................... 82
17. SPECIFICATION...................................................................................................... 83
18. MAINTENANCE....................................................................................................... 85
APPENDIX 1 – COM PORTS IN WINDOWS .................................................................... 86
APPENDIX 2 – LOG SHEET TEMPLATE......................................................................... 86
GLOSSARY ....................................................................................................................... 88
Versions used in this manual:
Detector Firmware 4.10
DCAPP 2.77
Updater 5.2.1
Diagnostics 3.0

Leaders in Pipeline Survey Systems
C
C
C-
-
-S
S
SC
C
CA
A
AN
N
N
2
2
20
0
01
1
10
0
0
SYSTEM MANUAL Version 6.03i
6
PRINCIPLES OF OPERATION
An electrical current applied to a well coated buried metal pipeline will decrease gradually
with increasing distance from the current injection point, as the current escapes to earth
through the coating.
If the coating has a uniform thickness and separates the pipeline from the surrounding soil
at all points, the strength of the signal current on the pipeline will decline logarithmically,
and the rate of decline will be dependant primarily on the electrical resistivity of the wrap or
coating in use, and the area of coating in contact with the soil per unit length of pipe (i.e.
for a given coating, the decline is proportional to the circumference of the pipe). [Note:
because of the relative magnitude of the resistances involved, local changes in soil
resistance can usually be ignored].
If there is a low resistance electrical path from the pipeline direct to the soil at any point,
there will be a substantial local increase in the rate of loss of signal current. Such a low
resistance path could arise from: incorrectly applied coating, mechanical damage to the
coating before, during or after installation, decay of the coating due to soil conditions,
disbonding of the coating from the pipeline (provided that ground water has penetrated into
the gap to provide an electrical path to earth), or a leak in the pipeline itself causing the
coating to fail at the leak point.
Because the resistance of such a path is likely to be several orders of magnitude less than
the resistance of the undamaged coating, the resultant loss of current, even from a single
small fault less than 0.1252in, can usually be detected by a significant increase in the
apparent rate of current decline over quite a long length of pipeline.
In practice, the existence of one or two small faults on a section of pipeline several
hundred feet in length can usually be tolerated because the Cathodic Protection System
can be expected to prevent serious corrosion developing quickly. In this case it may not
be necessary to locate the specific faults immediately but the rate of logarithmic decline of
current between two specific points can be logged for future reference so that any
deterioration of the condition of the pipeline can be monitored. [Note: the logarithmic rate
of decline of the current (attenuation), which is always measured in millibels per metre, is
effectively independent of the applied current and is only marginally affected by seasonal
changes in soil resistivity, so that it is virtually an absolute indication of the average
condition of the coating between two given points at the date of the survey.].
If the attenuation level over a given section of pipeline is particularly high, serious
anomalies (or a large number of small anomalies) in the protective coating are indicated.
Intermediate readings of attenuation levels can be taken to identify the worst sections, and
the precise location of these anomalies (generally to an accuracy of 3-6ft) can be
determined by recording and plotting the actual current levels at close intervals (6-30ft)
over the suspect section and noting those places where the rate of current decline is
steepest. The most serious anomalies can then be excavated and repaired.

Leaders in Pipeline Survey Systems
C
C
C-
-
-S
S
SC
C
CA
A
AN
N
N
2
2
20
0
01
1
10
0
0
SYSTEM MANUAL Version 6.03i
7
1. OUTLINE OF THE C-SCAN SYSTEM
The main elements of the C-SCAN Pipeline Coating Evaluation System are the Signal
Generator and the Detector Unit.
The Signal Generator is connected to the pipeline and to an appropriate ground point, and
generates a constant AC signal which passes along the pipeline, this in turn produces an
electromagnetic field which radiates from the pipeline.
The Detector Unit measures the strength of this electromagnetic field radiating from the
pipeline and uses it to determine the location and depth of the pipe, along with the residual
current remaining on the pipeline at the observation point. This data is stored in the
memory of the Detector Unit’s computer and is used to compute and store attenuation
rates between any two given observation points. The complete record of the survey (with
time, date & GPS positioning) may be downloaded and printed out at the end of the survey
to provide a permanent record.
1.1. Signal Generator
The C-SCAN Signal Generator is a self-contained unit producing a computer controlled AC
signal current with a frequency of 937.5 Hz.
Fig. 1.1 – Signal Generator
The output from the Signal Generator is a sine wave signal at a frequency of 937.5Hz, with
a nominal maximum voltage of 60V p-p (18V RMS). The maximum current obtainable is
1.5A (1500mA). The RMS value of the current being produced is displayed on the LCD on
the control panel, expressed in mA. The actual level of current produced is set by the
Surveyor using the instrument’s controls. Once set, this current level will be maintained at
a constant level (despite any transient changes in soil resistivity) until the batteries are
exhausted. In tests, the unit, when fully charged, has maintained a constant output of
600mA for up to 8 hours continuous operation when using the internal batteries. Use of an
external 12-18 volt supply can extend this time indefinitely.
Automatic
pressure relief
valve
Auxiliary Power
socket for charger
or external 12 volt
supply
PIPE connector -
connects
generator to
p
i
p
eline
GROUND
connector -
connects
generator to
suitable earth
Battery ISOLATOR switch
- used when storing or in
transit

Leaders in Pipeline Survey Systems
C
C
C-
-
-S
S
SC
C
CA
A
AN
N
N
2
2
20
0
01
1
10
0
0
SYSTEM MANUAL Version 6.03i
8
1.2. Detector Unit
The Detector Unit is housed in a weatherproof plastic case.
The front tube contains the antenna system, and the keyboard and LCD display are
mounted on the top of the tube with the main computer and GPS system. The base
compartment contains the communications and charger computer, the batteries and
connectors.
Fig. 1.2 – Detector Unit
The antenna consists of a number of large diameter air cored coils.
In operation, the computer calculates the vector sum of the field strengths measured by
the coils over the length of the instrument. The Detector display (as shown on page 17)
indicates to the operator the location of the pipeline and its approximate distance away,
guiding the operator towards the pipeline. When the field measured by the vertical axis
coil falls below a threshold value, the instrument display changes; the pipeline position
indicator shows the pipeline in the centre of the display and the overhead location bars
begin to close. When these bars are as close together as possible, the Detector is
positioned in the vertical centreline of the pipeline.
When the Detector is stationary in this ‘overhead’ position, a sample of 300 readings of the
field strength values can be taken over a period of approximately six seconds. The
computer will then calculate the depth of the pipeline (from the base of the Detector to the
centre line of the pipeline) and the strength of the residual signal current on the pipe.
The ‘DEPTH’ and ‘CURRENT’ values (in feet and mA) are shown on the LCD.
Using the keyboard, and following the prompts appearing on the display, the operator can
store the displayed data (which is automatically given a reference number), and request
the computer to calculate the logarithmic attenuation of the signal from any previous
location stored in its memory. This information is displayed on the LCD and is also stored.
The total number of points or surveys that Detector can hold in its memory is 500 points
spread over 100 surveys (whichever number is reached first), so although it is unlikely that
a surveyor will run out of memory, it is advisable to download the data and clear the
memory after each survey or survey series. Each survey data point contains the location
Display and Keypad
Carrying Handle
Battery Compartment
USB PC Connection
Battery Charger port

Leaders in Pipeline Survey Systems
C
C
C-
-
-S
S
SC
C
CA
A
AN
N
N
2
2
20
0
01
1
10
0
0
SYSTEM MANUAL Version 6.03i
9
reference number, GPS location, depth of pipeline, strength of signal current, distance
from a previous location reference, and logarithmic attenuation of the signal, in millibels
per metre (mB/m), between the two points. At the beginning of each survey, the computer
will also note automatically the time and date using the internal clock, and this information
will also appear on the subsequent download/printout.
At the end of a survey (or whenever required) the Detector Unit may be plugged into a
standard computer via the USB connector (or RS232 serial interface) and the survey data
can be downloaded and/or printed out in full, using Dynalog’s DCAPP software.
The Detector Unit is powered by either NiMH rechargeable batteries which will normally
provide enough power to run the instrument continuously for over 4 hours, or by Alkaline C
cells, which will provide approximately 12 hours of continuous use. There is, in addition, a
built-in lithium power source to maintain the data stored in the memory when the batteries
have been exhausted. This has an estimated life of ten years.
The surveyor must remember that the C-SCAN System is not immune to electromagnetic
interference but it incorporates a number of features which are designed to keep such
interference to an absolute minimum. Briefly, these features include: the generation of a
pure sine wave so that no complex harmonics are produced, the use of a carefully
selected frequency with virtually no harmonics in common with other frequencies in
general use, the narrow bandwidth of the filters in the Detector Unit and the collection of
300 signal samples over a period of approximately 6 seconds to eliminate transient
interference. The instrument can usually be used in the presence of mains AC and is not
affected by any residual ‘ripple’ in operating DC (rectified) Cathodic Protection systems.
2. Unpacking and Activating the C-Scan 2010 Survey System
2.1. Unpacking
For shipping safety the Detector and Signal Generator are shipped with their battery
isolation switches in the OFF position. For future shipping and long storage periods
ensure that the batteries are isolated.
Unpack the entire system from the soft cases and make sure all the items are present in
accordance with the packing list.
NOTES:
A copy of the packing list can be found in the pocket of the Detector soft case. Report
any obvious damage or any missing items immediately.
Do NOT try to activate damaged equipment.
If everything appears to be present and undamaged proceed to 2.2 below to charge
the Signal Generator and Detector Unit ready for use.
2.2. Charging the Signal Generator
The generator has a built-in re-chargeable lead-acid battery, having a nominal capacity of
17 ampere-hours.
Charging is initiated by attaching the charger power unit to the Charge socket on the side
of the Signal Generator and plugging the charger unit into the mains power. Selection of
mains voltage (110-240V, 50/60Hz) is automatic. When powered the charger unit will
show a green light. This light is only a power indicator light and does not show charge
status.
The Signal Generator will automatically switch on and enter the charge cycle. Note that
the battery isolator must be ON (not isolated) – if the isolator switch is in the OFF position,
a warning will be shown on the screen and the back-light will flash.

Leaders in Pipeline Survey Systems
C
C
C-
-
-S
S
SC
C
CA
A
AN
N
N
2
2
20
0
01
1
10
0
0
SYSTEM MANUAL Version 6.03i
10
-- CHARGING
-
-
<01:52 Remaining
85.0% Capacity
Stage 2
Checking in 59s
107.2% Capacity
Stage 3
-- CHARGING
-
-
<04:22 Remaining
9.0% Capacity
Stage 1
!--CHARGED--!
Remove Charger
(Float active)
The charging cycle is in four stages: Stage 1 charges to 80%. Stage 2 charges to 99%,
Stage 3 charges to 100%+ and balances the battery and Stage 4 is the float charge which
can remain active indefinitely.
Stage 1.
This stage can last up to 6 hours if the battery is very low.
This message shows estimated time to charge is 4 hours 22
minutes, battery capacity is 9.0%.
Stage 2.
If the battery is well-used or old, this stage may last the
longest
Stage 3.
Stage 3 is for top-off or charge balance. A timer will
disconnect the charge such that after 2 minutes the battery is
checked for its ability to hold a charge. If this passes then
stage 4 will be active. Should the battery not hold a charge
then a warning will be given.
Stage 4.
Charging is now complete and the charger can be removed.
Float charge is now active which will continued to trickle
charge the battery if the charger is left attached.
The charge can be terminated at any time by removing the charger. Pressing the OFF key
will prompt you to remove the charger.
A full charge should last for two to three days of normal survey work (depending on level of
signal current). The battery should not be allowed to discharge completely and if possible,
the generator should be put on charge at the end of each day’s survey. This will extend
the life of the battery. When storing for long periods (in excess of 1 month) isolate the
battery using the isolator switch. Check and charge the battery every 6 months.
NOTE: The batteries are shipped in a low state of charge and it may take many hours of
continuous charging to reach a fully charged state. The unit should be left on
charge until it turns itself off.
There are two battery chargers supplied with the equipment. They are identical
and can be used interchangeably to charge either the Signal Generator or the
Detector Unit.
The Signal Generator is powered by a completely sealed lead-acid battery. This
battery is permanently installed and may be replaced only by a trained technician.
IMPORTANT: Interrupting the initial charging cycle may seriously affect the ability of the
batteries ever to reach full capacity.
When shipping by air the battery must be isolated.

Leaders in Pipeline Survey Systems
C
C
C-
-
-S
S
SC
C
CA
A
AN
N
N
2
2
20
0
01
1
10
0
0
SYSTEM MANUAL Version 6.03i
11
2.3. Signal Generator External Power
If the internal battery of the Signal Generator is too low to complete or carry out a survey
and there is no time to charge the Signal Generator, an external 12-18 volt battery (car
battery etc.) can be connected using the cable supplied (9-way socket terminated with red
and black crocodile clips). This will extend the usable time to the capacity of the external
battery.
The external power can be connected to the Signal Generator at any time, even during a
survey. The Signal Generator will recognise the presence of the external power and
automatically switch to that power source. If the external power source fails then the
Signal Generator will automatically switch back to internal batteries until either the internal
batteries are exhausted or the external power source is replaced.
During external power use the Signal Generator will not display the battery % and time
indication, instead EXTERNAL ON will be shown.
Note: The external battery must be charged separately.
2.4. Charging the Detector Unit
There are two controls for the power supply to the Detector:
1. The Main Power isolator switch located in the battery compartment and normally left
ON
2. For normal operational use the Detector is switched ON and OFF by pressing the
button marked I/O on the Detector display panel / control keypad.
The Detector is powered by NiMH (Nickel-Metal Hydride) C cells (4500mAh). The battery
compartment is pictured below:
The Detector can be powered either
by re-chargeable NiMH batteries OR
by alkaline batteries.
Only the NiMH batteries can be
charged using the following
procedure. Using the charger
with alkaline batteries installed in
the Detector will result in damage
to the unit.
Fig. 2.1 – Battery Compartment
If not already installed, unpack the six (6) NiMH batteries and put them to one side.
Remove the two battery covers using the battery removal tool. Ensure that the main
power switch in this compartment is OFF! Insert the batteries, NEGATIVE (-ve) end first,
three to each battery compartment, as shown in Fig. 2.2 below, and re-fit the battery
covers. Use the battery removal tool to fit the covers but do not over tighten or cross
thread the covers.Switch the Main Power Isolator to ON.
C Cells
4.5Ah NiMH
Main Power
Isolator (ON/OFF)

Leaders in Pipeline Survey Systems
C
C
C-
-
-S
S
SC
C
CA
A
AN
N
N
2
2
20
0
01
1
10
0
0
SYSTEM MANUAL Version 6.03i
12
Fig. 2.2 – Inserting Batteries
The LCD will now display either the clock and date setting panels (if these have not been
factory set - Figs 2.3a & 2.3b below) or the Start-up screen. To set the time and date use
the &arrows to select the hh:mm:ss or mm:dd:yyyy and the arrows to increase or
decrease the selection. Once complete the Detector will perform some checks and the
START-UP screen will be displayed. The Detector can now be charged.
Fig. 2.3a – Time Display screen Fig. 2.3b – Date Display screen
If the display does not activate, turn the Main Switch to OFF again, ensure the
battery caps are fitted properly and wait for 5 seconds, then switch it back to ON. If
the display then activates, proceed with charging. If the display fails to activate the
batteries are exhausted – see Recovery charging procedure below.
NOTE: Up to this point no buttons have been pushed on the Detector display panel. The
only switch that has been activated is the Main Power Isolator in the battery
compartment.
+
-

Leaders in Pipeline Survey Systems
C
C
C-
-
-S
S
SC
C
CA
A
AN
N
N
2
2
20
0
01
1
10
0
0
SYSTEM MANUAL Version 6.03i
13
•Standard charging procedure
−Locate the battery charger port on the right hand side of the Detector and unscrew
the port cover
−With the Detector in the OFF state, attach the battery charger and connect the
charger power cord to a mains outlet socket – voltage selection is automatic. Make
sure the mains outlet is ‘live’
−Switch on the Detector either by the main power isolator or the I/O key if isolator is
already on. The charge cycle will automatically commence and the display will show
the charge screen and countdown timer (Fig.2.4c below), or
−If the Detector is already ON, then the charge cycle can be initiated manually by
selecting MENU from the START-UP screen and selecting CHARGE as shown in
figures 2.4a & 2.4b below
Fig 2.4a –Start-up screen Fig. 2.4b –Menu screen Fig. 2.4c –charge screen
When charging, the Detector will display a timer screen that counts backwards; the time
displayed being the maximum time allowed to charge the batteries. If the batteries are
charged before that time has expired charging will be terminated and the unit will revert to
trickle-charge and the display will switch off automatically.
If it is necessary to terminate the charging cycle before the batteries are fully charged, the
charging cycle may be ended by pressing the ³key. The display will shut off and the unit
will enter trickle-charge.
•Recovery charging procedure
If the NiMH batteries are completely exhausted (flat) the Detector display will either not
activate after the I/O button on the display panel is pressed or display a BATTERY LOW
warning (ensure batteries are installed and main power isolator battery switch is ON). In
this instance it maybe necessary to attempt to recover the batteries by the following
method:
−Make sure the main power isolator in the battery compartment is ON position.
−Connect the charger power cord to the mains supply outlet socket. Make sure the
socket is ‘live’.
−Leave the charger attached for 30 minutes.The charger will now attempt to recover
the batteries but the screen will not display. When the batteries have been charged
sufficiently the unit will automatically turn on and continue the charge cycle as
described in the standard charging procedure.
−If the unit fails to switch on, disconnect the charger, switch off at main power isolator
for 5 seconds, then on again. The Detector should start and display the START-UP
screen. The standard charging procedure above can then be followed.
NOTE: Attaching charger without batteries will start the detector in charge mode. Since
there are no batteries, they will not be charged. System will switch off in 4 hours or
can be aborted by pressing the ³key. If this has been done, disconnect the
charger and ensure the switch is set to OFF before inserting rechargeable NiMH
batteries.

Leaders in Pipeline Survey Systems
C
C
C-
-
-S
S
SC
C
CA
A
AN
N
N
2
2
20
0
01
1
10
0
0
SYSTEM MANUAL Version 6.03i
14
The Detector draws a small amount of current from the batteries when it is switched off at
the Control/Display Panel I/O switch but with the main power isolator switch left ON. If left
for a long period in this state the charge in the batteries will eventually be reduced to zero.
If the unit is to be inactive for a period of time switch the main power isolator to OFF. If the
unit is to be stored for longer periods of time (3 months +) or shipped without its shipping
crate, the batteries must be removed.
Leaving alkaline batteries in a stored Detector - even with the main power isolator Off -
may result in battery corruption and leakage, causing internal damage to the Detector.
NOTE: Survey data storage is NOT affected by the removal of the batteries.
•NEVER USE THE CHARGER WHEN ALKALINE BATTERIES ARE INSTALLED IN
THE DETECTOR
•NEVER use carbon/zinc or lithium-based batteries AT ANY TIME
•NEVER use or charge a mix of different types of batteries
WARNING

Leaders in Pipeline Survey Systems
C
C
C-
-
-S
S
SC
C
CA
A
AN
N
N
2
2
20
0
01
1
10
0
0
SYSTEM MANUAL Version 6.03i
15
AUTO: Sets the output to
600mA or maximum
attainable current up to
600mA.
Pressing and holding key
enters MANUAL mode
where the current can be
manually set to a chosen
output using &
buttons.
ON/OFF: Pressing and
holding this key
switches the generator
ON or OFF A quick
press whilst active will
disconnect the output.
STORE: Stores the present
valued to memory
: Decreases current in
MANUAL mode.
RECALL: Recalls previously
stored value
: Increase current
in MANUAL
mode.
3. OVERVIEW
This section gives an overview of the Signal Generator and Detector Unit, looking at the
keypad interfaces, displays and icons and connections for each part of the C-SCAN 2010
system.
3.1. Signal Generator – Keypad
3.2. Signal Generator – Display
The Signal Generator has a backlit display, providing the surveyor with the current status
of the Signal Generator while carrying out a survey. The details of the main screen are
listed below.
1. Battery Capacity
2. Estimated survey time remaining
for set current
3. Internal temperature
4. Battery state indicator - ³shown
if external power used
5. Power taken by the Generator
6. Peak output voltage
7. Loop Resistance between Signal
Generator, Earth and Pipeline.
This includes the contact
resistance of the earthing system
(Earth Spike, ground bed, etc.) –
usually the main contributor
XYZ
[\]^
99% 06:49 i25°
GENERATOR OUTPUT
SET to 600mA
16w 10.7v 10Ω

Leaders in Pipeline Survey Systems
C
C
C-
-
-S
S
SC
C
CA
A
AN
N
N
2
2
20
0
01
1
10
0
0
SYSTEM MANUAL Version 6.03i
16
3.3. Signal Generator – Side Panel
3.4. Detector Unit – Front Panel
The C-SCAN 2010 is the next generation design in the 2000 series Pipeline Survey
System. The system increases the speed and accuracy and includes more statistical
features for noise reduction, including:
•Built in Global Positioning System (GPS) unit for precision position indication.
•Attenuations can be calculated using GPS position information
•Full graphic interface allows the displaying of data without the use of a laptop or PC.
The onboard search facility displays:
1. Pipeline position
2. GPS coordinates
3. Depth/Cover indicator
4. Pipeline diameter
5. Survey and location number
6. Facility for recording pipeline
diameter and wall thickness.
7. Display of approximate coating
conductance in μS/m2.
8. Display of approximate coating
resistance in m2
9. Symbol inclusion for landscape
features
10. Graphs include:
Attenuation – by chainage or
increment
Depth – cover or to centre line
Current – including close interval
plots
GPS plot – show the plan of the
pipeline
•Full compatibility with DCAPP for Excel included in C-SCAN 2000
•Software upgradeable via PC
Connection to
suitable EARTH
Connection to
PIPELINE
CHARGER or AUXILIARY
power connector
USB Diagnostic /
Upgrade port
BATTERY
isolator switch.

Leaders in Pipeline Survey Systems
C
C
C-
-
-S
S
SC
C
CA
A
AN
N
N
2
2
20
0
01
1
10
0
0
SYSTEM MANUAL Version 6.03i
17
Where possible, all displays are language independent, with graphic icons representing
features or functions:
Depth to Centre
Depth to top (cover)
Current
Attenuation
Chainage
Distance
Symbols relating to landscape
features such as trees, walls,
fences, roads, rivers, pylons, etc.
Symbols are available with the
indicator on the left or right side
Symbol for GPS
3.5. Detector Unit – Display
Below is an example of the C-SCAN 2010 SEARCH screen showing the component parts
of the graphical display during search mode. At this initial search stage, depth, current
and distances are approximate.
Overhead Locator Bars
Pipeline Position indicator
GPS coordinates
Signal strength indicator
Pipeline Diameter
Approx Distance to Pipeline
Approx. Depth to centre or cover
Approx. Current
Other manuals for C-SCAN 2000 Series
3
This manual suits for next models
1
Table of contents
Other Dynalog Control System manuals
Popular Control System manuals by other brands

Techno CNC Systems
Techno CNC Systems BT1212 user manual

Idex
Idex Knight Ultra Micro-Pro UMP 100 Series instruction manual

elsner elektronik
elsner elektronik WS1000 Style Assembly instructions

REXROTH
REXROTH VisualMotion 9 troubleshooting guide

Fiberstars
Fiberstars WPC-3 installation instructions

Zonex
Zonex DigiTract 4-2 installation guide