Quick Start Guide smartBox V1.0.1| -2- | V1.1 | 10.11.2016
EN
1Selection of period to be displayed
2Green graph: volume flow
3Blue graph: energy yield
To display detailed values, move the cursor within the graph. To zoom in,
press and hold the mouse button.
1
2
3
1
2
1Selection of period to be displayed
2Blue graph: CO₂ saving
To display detailed values, move the cursor within the graph. To zoom in,
press and hold the mouse button.
1
2
3
1Selection of period to be displayed
2Chart of temperatures selected
3Click to show/hide temperature sensors
To display detailed values, move the cursor within the graph. To zoom in,
press and hold the mouse button.
Overview (home) page
Detailed overview of energy yield
Detailed overview of CO₂ saving
Detailed overview of temperatures
Remote access to solar controller
Language selection: for the website
Help
Login: (365) for service and extended view
Manage account and devices
Access to service funcons
Name of the connected device
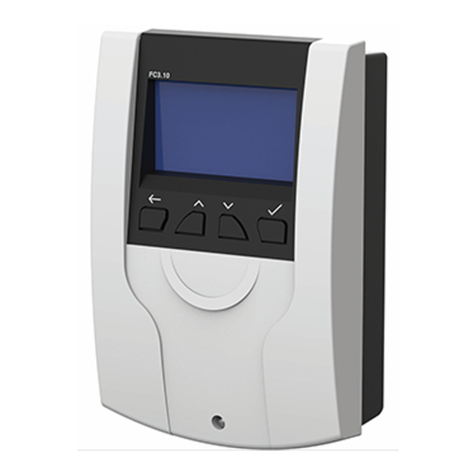
1Solar controller live display
2Virtual controls for solar controller
In this mode, you can operate the solar controller as though stood in front of it.
12

