LPPYRA11 -4-V1.1
2WORKING PRINCIPLE
The LPPYRA11 albedometer is based on a pair of thermopile sensors, one of them
measuring the incident radiation on the ground [ ↓] and the other one the reflected
radiation [ ↑]. Each thermopile works as an independent pyranometer. The thermo-
pile sensitive surface is coated with a black matt paint, which allows the pyranometer
not to be selective at different wave lengths.
In order to grant the thermopile a proper thermal insulation from the wind and reduce
the sensitivity to thermal irradiance, LPPYRA11 is equipped with two concentric domes
having 50 mm and 32 mm outer diameter on each side. The domes protect the ther-
mopile from the dust, which might change spectral sensitivity if it lies on the black
surface.
The pyranometer spectral range is determined by the transmission of the two glass
domes. Thanks to the use of a new material for the manufacturing of the domes, the
spectral range has been further extended to short wavelengths starting from 283 nm.
Considering a standard solar spectrum, the portion of solar irradiation measured by
the pyranometer is greater than 99.8%. Figure 2.1 shows the relative spectral sensi-
tivity of the LPPYRA11 albedometer and a standard solar spectrum.
Fig. 2.1: LPPYRA11 albedometer relative spectral sensitivity (blue line) com-
pared with a standard solar spectrum (red line)
Radiant energy is absorbed by the thermopile black surface, thus creating a difference
of temperature between the center of the thermopile (hot junction) and the pyranom-
eter body (cold junction). Thanks to the Seebeck effect, the difference of temperature
between hot and cold junction is converted into a Difference of Potential.
A second thermopile, not accessible by light, is mounted inside the instrument. This
second thermopile, connected in anti-series with respect to the sensor exposed to
light, reduces the signals due to sudden temperature changes of the pyranometer
(thermal shocks).
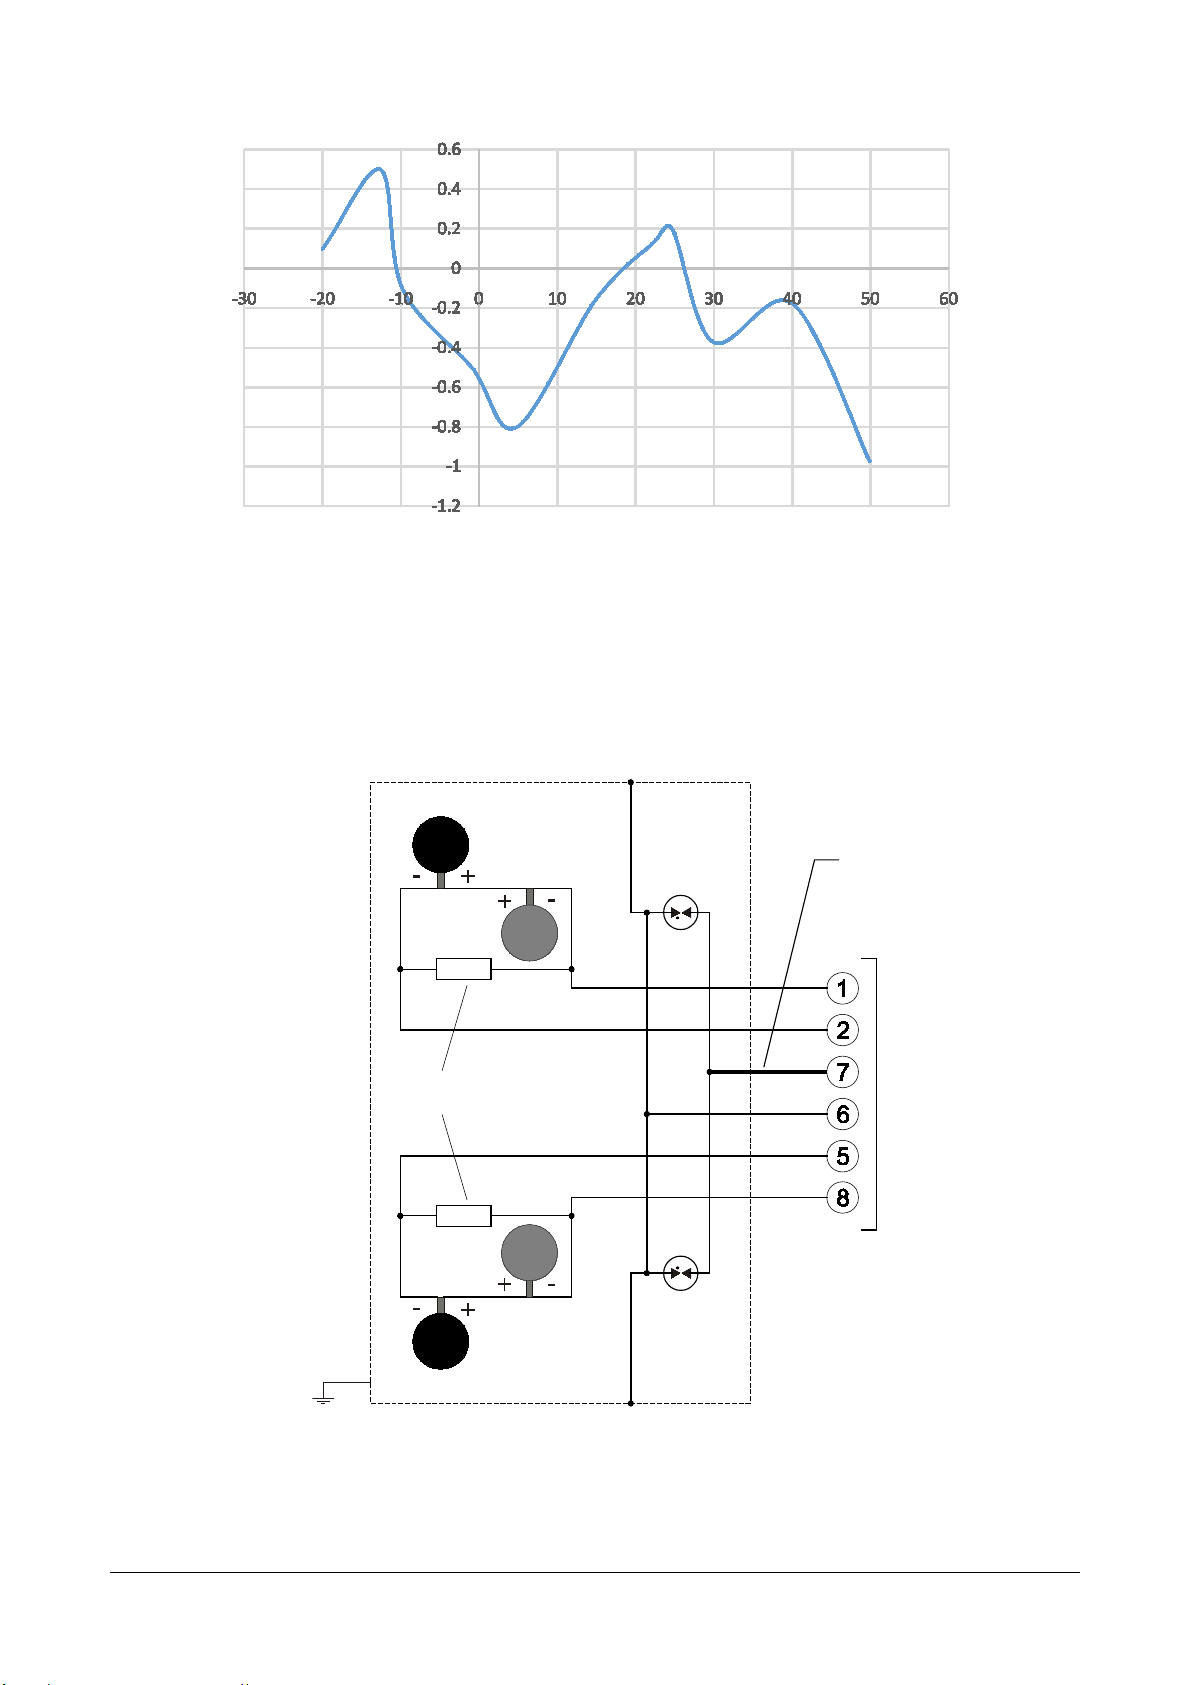
In order to minimize sensitivity changes with temperature, LPPYRA11 is equipped with
a passive compensation circuit. The graph in figure 2.2 shows the typical variation of
sensitivity at different temperatures. The deviations are calculated from the sensitivity
measured at 20 °C.