Image Engineering camSPECS User manual

Image Engineering GmbH & Co. KG · Im Gleisdreieck 5 . 50169 Kerpen-Horrem . Germany
T +49 2234 2273 99 99 1-0 . F +49 2234 2273 99 99 1-10 . www.image-engineering.com
camSPECS
User Manual
29. April 2020

Image Engineering
Seite 2von 36
CONTENT
1INTRODUCTION......................................................................................................... 4
1.1 Intended use......................................................................................................... 4
1.1.1 Departing from described setup........................................................................4
1.2 General safety information..................................................................................... 4
2GETTING STARTED................................................................................................... 5
2.1 Scope of delivery................................................................................................... 5
2.2 Commissioning...................................................................................................... 5
3OPERATING INSTRUCTIONS HARDWARE ............................................................... 6
3.1 camSPECS........................................................................................................... 6
3.2 Filter panel............................................................................................................ 6
3.3 Spectrometer calibration........................................................................................ 6
3.4 Camera settings.................................................................................................... 7
3.4.1 Camera position and lenses used.....................................................................7
3.4.2 Exposure.........................................................................................................7
4OPERATING INSTRUCTIONS SOFTWARE................................................................ 8
4.1 To install camSPECS software............................................................................... 8
4.2 RAW file conversion.............................................................................................. 8
4.3 Workflow............................................................................................................... 8
4.3.1 Spectral sensitivity (camSPECS) module..........................................................8
4.3.2 Spectral sensitivity (iQ-LED) module.................................................................9
4.3.3 Validation module............................................................................................9
4.3.4 Color transforms module..................................................................................9
4.3.5 ICC profile evaluation module.........................................................................10
4.3.6 Sample data set description...........................................................................10
4.4 Image data...........................................................................................................11
4.4.1 Color filter array (Bayer pattern) .....................................................................12
4.5 Spectral sensitivity (camSPECS) module ..............................................................13

Image Engineering
Seite 3von 36
4.5.1 Advanced settings .........................................................................................16
4.6 Spectral sensitivity (iQ-LED).................................................................................18
4.7 Validation module.................................................................................................25
4.8 Color transforms module.......................................................................................26
4.9 ICC profile evaluation...........................................................................................29
4.10 Calibration............................................................................................................30
4.11 Use of the in-situ database ...................................................................................33
4.12 Known issues.......................................................................................................34
4.13 Trademark and Copyright .....................................................................................34
5ADDITIONAL INFORMATION....................................................................................35
5.1 Maintenance ........................................................................................................35
5.2 Disposal instructions.............................................................................................35
6TECHNICAL DATASHEET.........................................................................................36

Image Engineering
Page 4of 36
1 INTRODUCTION
Important information: Read the manual carefully before using the device.
Inappropriate utilization may cause damage to the device, to the DUT (device under test), and/or other
components of your setup.
Keep these instructions in a safe place and pass them on to any future user.
1.1 Intended use
camSPECS consists of an illuminating hardware device and software for evaluating the spectral sensitivity of
camera systems. The included calibration spectrometer is used for periodic on-site calibration.
The camSPECS software measures spectral sensitivity by capturing images of the filter plate taken with a
camera system.
•Only suitable for indoor use.
•Place the system in a dry, constant tempered environment without light interference and avoid
high humidity.
1.1.1 Departing from described setup
For commissioning, the following steps must be performed in the correct order. Departing from this order
may lead to incorrect results.
•Install the Matlab component runtime (MCR)
•Install the camSPECS software
1.2 General safety information
The backside housing of camSPECS gets hot during operation.
•Do not cover the fan discharge ducts on the right and back sides of the device.
•Place the back side of the device at a suitable distance from the walls.
•Do not open the top sliding port of the housing during operation for bulb exchange.
•Do not open the device when connected to the power supply.

Image Engineering
Page 5of 36
2 GETTING STARTED
2.1 Scope of delivery
•camSPECS filter box
•Software
•Calibration file
•One replacement bulb
•Calibration device
2.2 Commissioning
•Remove the packaging material.
•The plug for the power supply and the main switch is on the box's backside. Connect camSPECS
with a power socket and switch it on.

Image Engineering
Page 6of 36
3 OPERATING INSTRUCTIONS HARDWARE
3.1 camSPECS
Switch camSPECS on and let it run for a couple of minutes (>= 4 min) until it reaches a stable temperature.
3.2 Filter panel
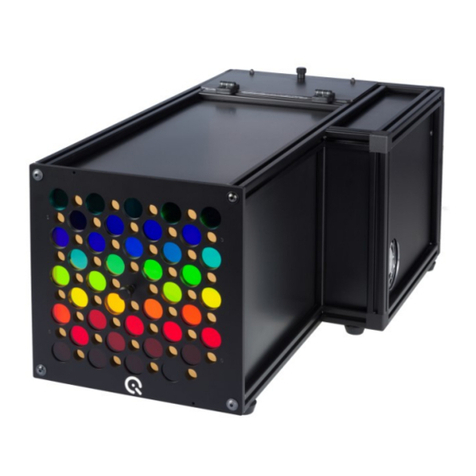
A set of 39 interference filters is used to generate narrow-band light. The filters cover a range of 380 - 760
nm in 10 nm steps. The filters are mounted on the front plate of the camSPECS box. The arrangement of the
filters can be seen in the following figure. The series starts with 380 nm on the upper left side and continues
line by line to 760 nm. The neutral density (ND) filters for inhomogeneity correction are positioned in
between.
3.3 Spectrometer calibration
The calibration device for the filters is already calibrated when delivered. The device needs a recalibration
once a year, regardless of the operating hours. Please read chapter 5.1.
380 nm filter
ND filters
760 nm filter

Image Engineering
Page 7of 36
3.4 Camera settings
Requirements on the camera (device under test, DUT):
Set the camera to manual exposure mode. If manual mode is not available, use the automatic exposure
mode. The camera should be able to save pictures as linear raw files to get the best results.
Exposure program
Manual
Aperture
No default value
ISO Speed
Lowest value (e.g.100)
Auto focus
Off
File type
RAW
3.4.1 Camera position and lenses used
Place the camera in front of the filter plate. The principal axis of the lens
must be aligned perpendicular to the center of the filter plate. Adjust the
distance between the lens and filter plate, so the filter plate occupies
approximately two-thirds of the field of view of the camera, centered. Avoid
using wide-angle lenses since there is a slight angle dependence of the
radiance power and the peak wavelength of the interference filters. Using
lenses with higher focal distances ensures a minimum viewing angle. Viewing angles below 15° do not
cause noticeable impacts on the resulting spectral responses.
Note:
Ensure that the filters are the only light sources captured by the camera. The pictures should be
taken in a dark room, or the space between the camera and the camSPECS box should be
shielded to avoid stray light or other light hitting the camera sensor.
3.4.2 Exposure
Set camera exposure, so the maximum recorded value of the camera capture of the filter plate is
approximately 75% of the valid encoding range. For instance, if the available encoding range is 16 bits per
channel and the valid encoding range of the image data is 12 bits per channel, set the exposure so that the
maximum value of the recorded filter plate is approximately 3000. To get correct results, the image of the
filters must not be overexposed. Take a picture with appropriate exposure settings (typically f = 5.6, t = 1/2s,
ISO 100, depending on camera and lens) in RAW mode (with Bayer pattern). Check the RAW image for the
highest recorded value in all RGB channels using a RAW image viewer or converter (i.e., dcraw).

Image Engineering
Page 8of 36
4 OPERATING INSTRUCTIONS SOFTWARE
The camSPECS software is a powerful tool to measure the spectral sensitivity of camera systems. The
results may be used for comparison or documentation purposes and for calculating Color Correction
Matrices (CCM) and ICC profiles.
The results can be saved in plain text (.txt) or XML files. For fast documentation purposes, the resulting
plots and images can be saved to images (JPEG, PNG, TIFF, BMP, GIF).
The software allows for a validation of the measurement setup with well-known reference data (based on
ColorChecker charts) and a recalibration of the hardware with the included spectrometer.
The camSPECS software also determines the white balancing multipliers of the camera and computes
various colorimetric transform profiles.
4.1 To install camSPECS software
•First, install the Matlab Component Runtime required for camSPECS. Execute the MCR installer (32
or 64-bit) and follow the instructions. This installer will install the Matlab Component Runtime if
necessary.
•Then start camspecs_Vx.x.x_win64.exe or camspecs_Vx.x.x_win32.exe (depending on the Windows
operating system version) to install the camSPECS software.
4.2 RAW file conversion
camSPECS uses dcraw to convert typical camera raw images to TIFF images. There is a list of all supported
cameras at: www.cybercom.net/~dcoffin/dcraw/
Standard processing converts to linear TIFF files while retaining the CFA pattern. A dark frame subtraction
(DFS) is supported to suppress fixed pattern noise. Other supported file types are TIFF, BMP, PGM, PPM,
and PNG. dcraw can also read the EXIF data from the images, such as shutter speed, f-stop, and ISO
speed.
4.3 Workflow
This chapter describes the general workflow of spectral response measurement and evaluation.
4.3.1 Spectral sensitivity (camSPECS) module
•Start the camSPECS software and switch to the module Spectral sensitivity (camSPECS).
•Check the advanced settings menu to adjust the default values as needed.
•Add the master calibration file delivered on the CD in the settings panel with the "+"-button. More
files can be added or removed from the menu using the corresponding buttons ("+," "-"). Calibration
files created during the calibration process with the software are automatically added to this menu.
•Update all other settings as needed and add an optional dark image.
•Select and add images with the '+' button.

Image Engineering
Page 9of 36
•Click the Start button.
•Check the result of the automatic detection and confirm by double-clicking on the image outside the
displayed Regions of Interest (ROI). The rectangles may be rearranged here if necessary.
•The measurement result is displayed, and a text file with the image name is saved in the same
directory as the images.
•The spectral curves can be saved as an image file for documentation purposes.
4.3.2 Spectral sensitivity (iQ-LED) module
•Start the camSPECS software and switch to module Spectral sensitivity (iQ-LED).
•Select the Spectral Sensitivity Database.
•Select the module Dark frame subtraction and the image file for an optional dark image.
•Select Add Spectra Folder containing the iQ-LED spectral power distribution files, ensuring that the
file naming convention is as specified below.
•Select Add Image Folder containing the camera captures of the iQ-LED spectra files, ensuring that
the file naming convention is as specified below.
•Click the Start button.
•The computed spectral sensitivities are displayed and saved as a text file.
4.3.3 Validation module
•Take a picture of a ColorChecker (24 patches) or ColorChecker SG (140 patches) chart that was
illuminated by a light source whose spectral distribution is included in the software (D50, D55, D65,
A, C). Additional spectral distribution files can be added to camSPECS.
•The picture shall have uncompressed RGB or raw data (e.g., TIFF format).
•Select the Validation module and choose a spectral sensitivitymeasurement. The previous spectral
measurement, if available, is shown in the highlighted field.
•Select the light source and reflectance data from the drop-down menus corresponding to the
selected ColorChecker.
•Select the ColorChecker image.
•Select a dark image for correction as an option.
•Click the Start button and draw a rectangle around the patches in the displayed image.
•Double-click on the image and check the positions of the ROIs in the next step. Their positions may
be corrected with drag and drop before clicking on the image outside the ROIs to continue.
•The graph displays the measured RGB values for each patch plotted against the predicted values in
normalized values (from 0...1).
•The graph can be saved as an image file for documentation purposes.
4.3.4 Color transforms module
•Select the measured Camera Spectral Sensitivities file.
•Select the Transform type, Reference illuminant, and Profile type.

Image Engineering
Page 10 of 36
•Select the training data that will be used to create the transform, the test data that will be used to
evaluate the transform, and additional test data (if any) that will also be used to evaluate the
transform.
•Click Start to calculate the transform.
•Click Export to save the transform, if desired.
4.3.5 ICC profile evaluation module
•Load a raw camera image.
•Click Select ICC profile directory… to show a list of profiles saved from the Color Transforms
module.
•The color-managed image will be shown for viewing on an sRGB-calibrated display.
•Export the color-managed image if desired.
4.3.6 Sample data set description
There is a set of sample data available on the USB drive. The images and text files can be used in all
modules to gain quick insight into the software. Explanation of the sample data:
•Spectral Sensitivity (camSPECS) module, camSPECS XL folder:
oXL_Calibration.txt –sample input calibration file for the camSPECS image. Not
applicable for customer’s hardware.
ocamspecs.ARW–sample input raw capture of camSPECS filter plate.
ocamspecs_*.* –computed output spectral sensitivities saved in several formats.
•Spectral Sensitivity (iQ-LED) module, iqLED folder:
oSS_RGB.txt –sample input spectral sensitivity database.
oImage folder - sample input folder of camera captures of the LEDs corresponding to the
contents of the Spectra folder.
oSpectra folder - sample input folder of LED spectra saved from separate iQ-LED
software.
oiQLED_specs.txt –sample computed spectral sensitivities output.
ocameraPCs.txt, cameraRGBs.txt, LEDspectra.txt, sample output data files.
•Validation module:
ocamspecs_specs.txt –computed spectral sensitivities output from the Spectral
Sensitivity module is the input for the Validation module.
oColorChecker.RW2 –sample raw capture of Color Checker illuminated with a D65
simulator.
•Color Transforms module:
ocamspecs_specs.txt –computed spectral sensitivities output from the Spectral
Sensitivity (camSPECS) module is the Color Transforms profile creation module input.
ocamSPECS.icc - profile created from camspecs_specs.txt
oiqLED.icc - profile created from iQ-LED_spectral.txt

Image Engineering
Page 11 of 36
•Profile evaluation:
oTest Images folder - sample images to which sample ICC profiles may be applied.
Sample data set is provided with camSPECS for setup and functionality verification. It’s recommended to
exercise all software functions with this data set to ensure that the illustrated results can be replicated.
Sample data set files are used throughout the documentation for illustrative purposes only.
4.4 Image data
The camSPECS software can handle demosaiced images or images with the original CFA independent from
the file type. With other raw image converting software, convert the images to TIFF files and maintain the
Bayer pattern. The program dcraw converts raw camera files (the latest release is delivered with
camSPECS). Mac OS X and Windows versions are available. camSPECS can also handle RGB images as
long as they have adequate bit depth, have not been rendered for color and tone, and are radiance linear.
If raw files are selected, the raw processing is performed automatically for all images selected in every
module. The files are saved as TIFF files to a sub-directory named “converted” at the location of the original
files. These images are used for subsequent processing. If further tests with images are desired, choose the
converted images for faster processing. Images are converted, retaining the original Bayer pattern.
Note
See www.cybercom.net/~dcoffin/dcraw/ for a list of all supportedcameras. On this site, there is a
link to the latest executable version of dcraw. To update dcraw, replace the dcraw.exe with the new
one in the “app” directory of the camSPECS program. Or choose dcraw from a different location in
the advanced settings.

Image Engineering
Page 12 of 36
4.4.1 Color filter array (Bayer pattern)
Sometimes it might be necessary to set the CFA manually. To determine how the pixels are located in the
CFA, see the corresponding filters in an image taken with camSPECS. These filters represent blue, green,
and red. Non-standard color filter arrays are supported: select 'C' (for Clear) for each channel in the
corresponding drop-down menu in the advanced settings panel.
For example, in the CFA in the 450 nm picture, the brightest pixel is blue. The brightest pixel in the 650 nm
filter picture is red; the remaining two pixels of a 2x2 area represent the green channel of the camera. This
procedure should work with most regular 3-channel cameras.

Image Engineering
Page 13 of 36
4.5 Spectral sensitivity (camSPECS) module
Description of the numbered controls marked in the image above:
1. Select the calibration file for the camSPECS hardware. Calibration files can be added and removed from
the list using the '+' and '-' buttons. The' S' button can save all calibration files to a specified location.
The selected calibration file in the menu must correspond to the images selected. The calibration files
are located in the directory /calibration_files/filter of the camSPECS program folder.
Wavelength (nm) of the color filters or
‘1’ for the ND filters
Power of the filters
377
0.1933
1
0.1009
386
0.1629
1
0.1219
…
…
750
0.0829
1
0.1681
760
0.0604
1
0.1094
The table above explains the formatting of the calibration file for camSPECS V2: the rows contain values
for the wavelength and the power of the color filters and the ND filters alternating from line to line. “1”
stands for the ND filter.

Image Engineering
Page 14 of 36
2. The ND filters adjacent to the interference filters are used for correcting inhomogeneities caused by the
DUT (camera + lens). This option should always be selected.
3. Use EXIF data for correction of different exposure settings. This option is only necessary when the
camera's automatic exposure control is used in the Multi-shot version of camSPECS.
4. Apply dark frame subtraction. Supported image types include TIFF, PGM, BMP, PNG, PPM, and raw
files. Take an image with the same camera exposure settings used for the camSPECS images. It will be
subtracted from each image in the processing list. This option subtracts the offset value of all images
originating in the sensor's dark current. The offset value hurts the spectral measurement.
5. Set the maximum allowed digital value per the Exposure guidelines above. An error message is
displayed if this value is exceeded in an image.
6. Add an image(s) to the processing list. Supported image types include TIFF, PGM, BMP, PNG, PPM, and
raw files (The term "raw file" indicates files that are created by a digital camera in "RAW-Mode" and are
readable by the software dcraw. This term does not include raw files with unsupported image file formats
– these should be converted to 16-bit Tiff images first.). Depending on the selected calibration file (see
item 1), one or more images can be chosen that contain the filter arrangement of camSPECS. The '+,' '-,'
and 'C' buttons are options to add images, remove one selected image or clear the whole list. After the
measurement, the spectral curve of the first image in the list is displayed. The corresponding results are
displayed by clicking on the other images in the list.
7. Check the advanced settings (chapter 0).
8. Starts the processing procedure. The filters in the images are detected automatically or manually. After
the detection process, a confirm dialog is shown where the ROIs for each filter can be manually
repositioned if necessary (Fig. 4.5.2). Double-clicking on the background starts the processing. The
resulting spectral curves are displayed and saved to plain text (*specs.txt or *QE.txt) and an XML file in
the same directory as the original image directory. If multiple images are selected, an additional *_SS.txt
file is created and saved in the installation camSPECS/lib folder, which is the default location when
selecting the Spectral Sensitivity Database in the Spectral sensitivity (iQ-LED) module. For the
camSPECS version (Multi-shot), a tile image is saved to the same directory as the origin of the image's
directory (Fig. 4.5.1), assembled from all images. Check this image for the correct positions of the ROIs
or all filters.
9. When the measurement is done, switch between raw and normalized RGB spectral curves data. Raw
spectral curves – single plot the uncorrected camera code values as a function of wavelength for the
highlighted image, while Normalized spectral curves – single apply the calibration file from 1 above and
then plot the corrected camera code values as a function of wavelength. Quantum Efficiency shows the
normalized spectral sensitivities converted to quantum efficiencies. Similarly, the * - all choices plot the
curves for the complete set of images. The order of the legend is the same as the image list. The valid
spectral range is specified in the spectrometer_settings.txt file described above.

Image Engineering
Page 15 of 36
10. Export the spectral curves to an image (JPEG, PNG, TIFF, BMP, GIF) for documentation purposes.
Figure 4.5.2: camSPECS filter capture with adjustable ROIs for modifying measurement areas.
Figure 4.5.1: A tiled image is created from all images of a series for camSPECS multi-shot. Displaced filter frames can easily be
identified.

Image Engineering
Page 16 of 36
4.5.1 Advanced settings
1. The software detects the Color Filter Array (CFA) automatically by default. Choose the manual option to
set the color filter array manually. If a CFA is not a standard pattern, e.g., unique cameras without a filter
for one channel, C (Clear) can be chosen. In this case, all four channels are measured separately and
displayed as four different channels without any assignment to a color.
2. This option is the default for the display and export of the curves. Both green channels are averaged.
3. With this option, all four channels of the CFA are displayed and exported as result files separately.
4. Use a decimal comma in the resulting text and XML files.
5. This option interpolates the spectral response data to increments of 5 nm. The default value is 10 nm if
this option is not selected. 5 nm graded values are necessary for further processing in the modules
Validation and CCM calculation.
6. Size of the ROI for measuring digital values in every filter to the diameter of the filter. The default value is
50 %. Higher values may result in inaccurate results due to vignetting artifacts of the filters near the
borders. The minimum size is limited by the number of pixels inside the ROI; more than 100 pixels are
needed for statistical significance. If the number falls below this value, the program gives a warning.
7. Select the dcraw application (see note below). By default, the dcraw version delivered with the software
is used and located in the directory "app" inside the camSPECS program directory. For raw image
processing, camSPECS uses dcraw to convert standard camera raw files to TIFF files, and the
converted images are saved to a sub-directory named 'converted.'
1
2
3
4
5
6
7
8
9

Image Engineering
Page 17 of 36
Note:
A long file path or a network path can cause problems using dcraw. Try to use short paths. (For
example: C:\program files\dcraw). See www.cybercom.net/~dcoffin/dcraw/ for a list of all
supported cameras and the current version of dcraw.
8. Choose the detection mode for the filters in camSPECS images:
- Automatic detection: Several camSPECS images can be measured subsequently without interruption.
- Semi-automatic detection: Each spectral measurement is interrupted by a dialog to control the filters'
ROI locations. The preceding filter detection is automatic, and the ROIs can be activated and aligned
with the mouse.
Semi-automatic detection of the filters in camSPECS. The ROIs shown in this example were set to a size of 50% (left), respectively
70% (right) of the diameter of the corresponding filters.
- Manual detection: Each spectral measurement is interrupted by a dialog for manual detection of the
filters. Use this option if the automatic detection fails. Reasons for failing are mostly images exposed with
wide-angle lenses or images with artifacts caused by stray light during shooting. Use the four sliders to
limit the characteristics of the neutral density filters. Compare the detection in the image (left side) to the
nominal positions of the filters. If the correct number of filters of 40 is found, continue by clicking the OK
button. This dialog panel is also invoked when automatic detection fails with an image.

Image Engineering
Page 18 of 36
9. Check White Balancing Paraxial Correction when characterizing cameras with wide-angle lenses or
when matching white balance over a wide range of focal lengths is desired.
4.6 Spectral sensitivity (iQ-LED)
The Spectral sensitivity (iQ-LED) module is intended to help identify the parameters for high-speed
production-line camera colorimetric calibration using Image Engineering illumination devices that embed iQ-
LED technology. While the Spectral sensitivity (camSPECS) module directly determines a camera's spectral
sensitivities, the Spectral sensitivity (iQ-LED) module determines the spectral sensitivities of production-line
cameras. Images captured from a few LEDs combined with an analysis of a database of reference spectral
sensitivities from cameras with the same make and model sampled from production. The database is created
with a monochromator such as camSPECS then data from a test camera is selected for parameter
optimization and comparison of results as described below. This process can be repeated for additional test
cameras to confirm that the optimized parameters are robust across the cameras under test.

Image Engineering
Page 19 of 36
The method is comprised of two parts, as illustrated above, assuming the use of camSPECS software v4.2,
camSPECS monochromator, iQ-LED software v3.3, and an iQ-LEDV2-based instrument:
Setup is a do-once operation wherein a set of camera modules of a given make and model are selected that
represent production variation. Each module is measured with a monochromator (such as camSPECS, as
described in the previous section) to determine spectral sensitivity. This process is repeated for each module
in the set resulting in a spectral sensitivity camera database that characterizes the statistics of spectral
variation of the given make and model. Setup is performed for each make and model of the camera module
resulting in a unique spectral sensitivity camera database for each make and model of a camera module.
Setup best practices are comprised of the following steps Spectral Sensitivity Database Creation, iQ-LED
Settings, and Verification.
Spectral Sensitivity Database Creation:
1. Select 43 camera modules that are representative of the expected production variation.
2. Select one of the camera modules to optimize the exposure of the camSPECS filter plate, allowing for
adequate headroom. Capture a black frame with these settings.
3. Select 43 camera modules and make captures with these settings of the camSPECS filter plate.
4. Select 40 of the 43 camera modules. The remaining three modules will be used later for Verification.
Create the representative spectral sensitivity database by loading the black frame and all 40 captures of
the camSPECS filter plate in the Images section of the Spectral sensitivity (camSPECS) module. After
selecting Start, each module’s spectral sensitivity will be displayed and should be inspected for expected
behavior. Once all 40 modules have been processed, the new representative spectral sensitivity
database is written to Program Files > Image Engineering > camSPECS > lib.
Setup Production
spectral sensitivity
estimation
camSPECS spectral sensitivity measurements of 30+
units representative of production variation
camera
database
iQ-LED
calibration data
7-22 images per
sample
~ weekly recalibration captured images
Production unitsiQ-LED device
Wavelength [nm]
rel. intensity
spectral data RGB data
spectral sensitivity

Image Engineering
Page 20 of 36
iQ-LED Settings:
1. Since the spectral sensitivity of typical modules has been measured above, the spectral sensitivity
wavelength range is known. Once an iQ-LED V2 device and spectrometer are connected to the
computer, launch the iQ-LED software v3.3 and allow for warmup.
2. Select the first LED (blue) for which the camera has sensitivity. Set its power to 95% with all other LEDs
set to 0 and drag the Current Illuminant to the Stored Illuminant panel. Repeat for only those LEDs for
which the camera has sensitivity resulting in a series of individual LED stored illuminants at 95/0% power
over only the camera spectral sensitivity wavelength range. Do not include LEDs whose peak output lies
outside the camera spectral sensitivity wavelength range.
3. Since the stored illuminants are the reference for these LEDs, use the Stored Illuminant panel to select
the just created stored illuminants. With a mouse-right-click, select Export selected illuminant(s)
reference spectra to a new folder.
4. Within Create Illuminant, 1) select spectral distribution A and 2) select intensity corresponding to
95% of maximum Illuminance [lx] shown after selecting circle i. Drag the Current Illuminant to the
Stored Illuminant panel. The spectral measurement panel will show the reference illuminant and the
created spectrum. Since the reference and actual spectra are not the same, use the File Save icon in
the upper left of the measurement panel to save the measured spectrum. Repeat for Illuminants D65
and E. Confirm that the red triangle with “!” is not displayed.
5. Rename all the saved stored illuminant text files in the folder to follow the naming convention
(text_number) and order (short to long wavelengths, A, D65, E) illustrated in column A of the spreadsheet
below.
6. When the camera module is placed directly at the exit port of the iQ-LED device and all ambient light is
excluded, perform captures of each stored illuminant in the order above and with exposure set for
adequate headroom for the brightest illuminant. Save these images using the naming convention
text_number.ext so that the numbering order is the same as the capture order specified.
7. Launch the camSPECS software Spectral sensitivity (iQ-LED) module and load the dark frame, image
folder, and spectra folder as described below. With the default settings, click Start, and after completion,
open the cameraRGBs.txt file output in the images folder, illustrated in columns C:E below.
8. Inspect to ensure that these values do not exceed 75% of the valid linear encoding range, including any
black offset associated with the dark frame. Inspect the maximum values illustrated in column F below to
ensure that the maximum camera response to each stored illuminant is approximately balanced.
9. The maximum camera response to each stored illuminant should be approximately balanced to achieve
proper neutral balance in subsequent spectral sensitivity determination reliably. The estimated adjusted
powers will create approximate balance as illustrated in column H. Create a new set of stored
illuminants with these powers (minimum 15%), increase exposure proportionately, and repeat steps 5-8
above. Confirm that the maximum camera response to each newly adjusted stored illuminant is
approximately balanced, as illustrated in columns I:L.
10. The existing stored illuminants must be deleted and recreated anytime an iQ-LED device is recalibrated.
Other manuals for camSPECS
1
Table of contents
Other Image Engineering Measuring Instrument manuals

Image Engineering
Image Engineering camSPECS User manual

Image Engineering
Image Engineering iQ-FoV Box User manual

Image Engineering
Image Engineering LED-Panel V5 User manual

Image Engineering
Image Engineering GEOCAL User manual

Image Engineering
Image Engineering TE292 User manual

Image Engineering
Image Engineering LED-Panel V4 User manual

Image Engineering
Image Engineering TE292 User manual

Image Engineering
Image Engineering CAL4-E User manual